752
IEEE JOURNAL OF SELECTED TOPICS IN APPLIED EARTH OBSERVATIONS AND REMOTE SENSING, VOL. 5, NO. 3, JUNE 2012
Estimation of Root Zone Soil Moisture Using Apparent Thermal Inertia With MODIS Imagery Over a Tropical Catchment in Northern Thailand Tzu-Yin Chang, Member, IEEE, Yi-Chen Wang, Chen-Chieh Feng, Alan D. Ziegler, Thomas W. Giambelluca, and Yuei-An Liou, Senior Member, IEEE
Abstract—Understanding the variability of soil moisture content (SMC) is important for studying ecohydrological processes because it provides insights into surface water and energy balances. To comprehend the dynamics of SMC under different land use/cover types in tropical environments, this study proposes an apparent thermal inertia (ATI) approach with the Moderate Resolution Imaging Spectroradiometer (MODIS) imagery for estimating root zone SMC. Root zone SMC at depths of 10 cm, 100 cm, and 200 cm were estimated for seven sites over a northern Thailand catchment from 2005 to 2008, and compared with in situ observations. Pearson correlation coefficient and the Nash-Sutcliffe efficiency coefficient between the ATI-MODIS retrieved SMC and the measurements were respectively 0.80, 0.84, and 0.84, and 0.57, 0.537, and 0.492 for the 10 cm, 100 cm, and 200 cm depths. Root Mean Square Errors were 0.055, 0.025 and 0.029 for the three respective depths. Potential issues of the mixed land cover types within the 1 km MODIS pixel were examined; the mixed agricultural land cover types at two of the seven sites with agricultural activities such as irrigation water use might have affected the SMC estimation. Overall, the ATI-MODIS approach performed well, particularly for the 100 cm depth. Index Terms—MODIS, soil moisture content, thermal inertia, tropical forest.
I. INTRODUCTION
S
OIL moisture dominates the exchange of energy and water between land and atmosphere. Over land, approximately 58% of net radiation is used to drive evaporation and transpiration from water bodies, moist soils, and plants [1]. For the process of transpiration, vegetation plays an essential role in Manuscript received September 25, 2011; revised December 25, 2011; accepted February 20, 2012. Date of publication April 26, 2012; date of current version June 28, 2012. The work of T.-Y. Chang, Y.-C. Wang, and C.-C. Feng was supported by the National University of Singapore (NUS) grant R-109-000070-101. The work of A. D. Ziegler and T. W. Giambelluca was supported by the NASA grant NNG04GH59G, the Asia Pacific Network grant ARCP200801CMY, and the NUS grant R-109-000-092-133. T.-Y. Chang is with the National Science and Technology Center for Disaster Reduction, Taiwan. Y.-C. Wang, C.-C. Feng, and A. D. Ziegler are with the Department of Geography, National University of Singapore, Singapore (e-mail:
[email protected]. sg). T. W. Giambelluca is with the Department of Geography, University of Hawai’i at Mānoa, Manoa, Hawaii, USA. Y.-A. Liou is with the Center for Space and Remote Sensing Research, National Central University, Taiwan. Color versions of one or more of the figures in this paper are available online at http://ieeexplore.ieee.org. Digital Object Identifier 10.1109/JSTARS.2012.2190588
removing water from soils and returning it to the atmosphere. Many studies have shown that soil moisture content (SMC) has a strong relationship with precipitation variability [2]–[5]. During rainy seasons, precipitation can help to maintain a high SMC, while during non-rainy seasons, root zone SMC critically influences evapotranspiration and heat flux allocation, which dominate the water and energy budgets over large watersheds, thereby influencing water resource management [6][7]. Root zone SMC is also an important rainfall-runoff connection in hillslope hydrological processes [8][9], and its spatial and temporal variability within a watershed is mainly controlled by vegetation cover, topography and landscape position [10]. SMC is measured at some weather stations and meteorological towers where precipitation or flux data are collected. In hydrological research catchments, researchers commonly install sensors to trace water movement, including rain gauges to measure precipitation, water level sensors to measure outflow, and Time Domain Reflectometry (TDR) sensors to measure soil moisture [11]. Point measurements, such as these, are generally inadequate to characterize the high spatial and temporal variability of SMC. With the advances in remote sensing techniques, estimating SMC over large areas has become a feasible means of filling this gap. To further the goal of improving remote-sensing-based SMC estimates, several coordinated field campaigns have been conducted, including REBEX (Radiobrightness Energy Balance Experiment) [12], Washita’92 [13], SGP97 (Southern Great Plains 1997) [14], SGP99 [15], SMEX02 (Soil Moisture Experiment 2002) [16], SMEX04 [17], CEOP (Coordinated Enhanced Observing Period) [18], CEOP Enhanced Observing Periods 3 and 4 (EOP-3 and EOP-4), NAFE’05 (National Airborne Field Experiment 2005) [19], NAFE’06 [20], and so on. Some studies have estimated SMC using visible and infrared images with energy balance approaches or based on the correlation between surface temperature and the Normalized Difference Vegetation Index [21]–[24]. Prior work has also employed passive/active microwave remote sensing to estimate SMC directly [25]–[29]. However, restricted by spatial resolution and electromagnetic penetration depth, the substantial body of work has mostly focused on low-density canopies and agriculture areas of semi-arid and arid regions. To retrieve SMC under forests, studies have used radar imagery from the European Remote Sensing Satellites (i.e., ERS-1 and ERS-2) [30][31]. Although some scientists are concerned about the ability of visible and thermal sensors to detect soil
1939-1404/$31.00 © 2012 IEEE
CHANG et al.: ESTIMATION OF ROOT ZONE SOIL MOISTURE USING APPARENT THERMAL INERTIA WITH MODIS IMAGERY
moisture under dense forest canopies, Verstraeten et al. [32] have successfully estimated root zone SMC of the European forests from METEOSAT imagery by combining the apparent thermal inertia (ATI) approach and the soil moisture saturation index (SMSI). Compared with the ground truth observations from the EUROFLUX soil moisture field measurements, their results performed better than those derived from the ERS Scatterometer. Additionally, unlike the studies using energy balance approaches that would require many local meteorological conditions, such as wind speed, air temperature, and humidity, from the ground stations, the ATI approach is based on variables derived directly from remotely sensed data and would require fewer ground information. While progress has been made in using radar and thermal images in SMC estimation, most prior work has focused on boreal and temperate forest ecosystems [33][34], and scant attention has been given to tropical forests. This may be due in part to the diverse vegetation and the problems associated with persistent cloud cover [35]. Estimating root zone SMC in tropical countries, especially in mountainous areas, is challenging because topography and rapid land use/cover change have resulted in fragmented landscape patches [36], increasing the spatial and temporal variability of the SMC [37]. However, understanding root zone SMC in tropical forests, including those in mountainous regions, is needed to provide insights into the potential impact of land use/cover change on hydrological processes. To fill in the gap in root zone SMC estimation in tropical forests and to improve understanding of the dynamics of SMC under different land use/cover types in tropical mountainous environments, equipment was installed in 2004 to measure precipitation and SMC of three depths at 10 cm, 100 cm and 200 cm in the Mae Sa catchment in northern Thailand. These in situ SMC measurements allow us to evaluate the ATI root zone SMC retrieval algorithm [32]. Data from the Moderate Resolution Imaging Spectroradiometer (MODIS) on NASA’s Terra satellite were selected for this analysis because MODIS provides both day-time and night-time thermal images and daily surface albedo, allowing the retrieval of SMC with the ATI approach. We estimate root zone SMC at depths of 10 cm, 100 cm and 200 cm, for the period 2005 to 2008 at the Mae Sa experimental sites with methods modified from the ATI algorithm in Verstraeten et al. [32] in conjunction with Terra MODIS images (hereafter referred to as the ATI-MODIS approach). The aims of this study include: (1) estimating root zone SMC in tropical forests using the proposed ATI-MODIS approach; (2) evaluating the performance of the ATI-MODIS approach for SMC estimations at the three root zone depths of interest; and (3) examining the possible factors responsible for the SMC variations at the three root zone depths over different land use/cover types. II. METHODOLOGY A. The ATI-MODIS Approach The soil moisture retrieval algorithm of the proposed ATIMODIS approach is based on the concept of thermal inertia, which is a measure of the resistance of a material to change in temperature and is determined by the thermal conductivity and specific heat of the material. Because water has a high spe-
753
cific heat, water bodies have a higher thermal inertia and show a lower diurnal temperature fluctuation than dry soils. Likewise, when the water content in the soils increases, thermal inertia also proportionally increases, resulting in a reduction of the diurnal temperature fluctuation range of the soils [32]. Thermal inertia is defined as: (1) is where K is the thermal conductivity, is the density and the specific heat at constant pressure. Thermal inertial offers a possible approach for using remote sensing to estimate soil moisture. However, the variables in (1) cannot be derived directly from remotely sensed data. Previous studies have, therefore, used the diffusion equation and a boundary condition to simplify the thermal inertia computation to allow the use of remotely sensed data. For example, a Radiobrightness Thermal Inertia forward model has been presented to apply passive microwave remote sensing data, including the Scanning Multichannel Microwave Radiometer (SMMR) and the Special Sensor Microwave/Imager (SSM/I), to monitor soil moisture over the Great Plains in the USA [38]. Thermal inertia algorithms have been applied for mapping arid and semi-arid ground surface and showing the temporal variability of soil moisture over plains in different countries using the Advanced Very High Resolution Radiometer (AVHRR) images and MODIS data [39]–[42]. The ATI has also been employed to replace the parameters in (1) because it can be derived directly from multi-spectral remote sensing data [43]. Following such approach, the ATI per pixel retrieved from remotely sensed images is the ratio of shortwave radiation absorptivity to the diurnal temperature variation : (2) where is the broadband albedo and is the diurnal land surface temperature difference between the day-time and nighttime radiometric temperatures of the Terra MODIS. According to Liang [44], the total visible albedo is independent from solar zenith angle and atmospheric visibility. Therefore, the total visible albedo acquired from the Terra MODIS calculated in Liang [44] is regarded as the broadband albedo in this study. The equation is written as follows: (3) and are the reflectances of MODIS band1, where , band3 and band4, respectively. Because ATI is derived from remote sensing imagery directly, its values represent the combination of canopy and soil moisture variability. The higher the ATI value, the higher the moisture content of the surface. The rationale to employ ATI to derive soil moisture is that high ATI values correspond to maximum SMC while low ATI values correspond to minimum SMC [32]. Following Verstraeten et al. [32], the surface moisture saturation index is next used to normalize the ATI values for analysis. (4)
754
IEEE JOURNAL OF SELECTED TOPICS IN APPLIED EARTH OBSERVATIONS AND REMOTE SENSING, VOL. 5, NO. 3, JUNE 2012
where is the ATI at time t; and represent respectively the highest and the lowest ATI values retrieved from the ATI time series. Verstraeten et al. [32] present the water dynamics of the soil profile using a simple two-layer water budget: the first layer being the remotely sensed surface layer and the second layer being the root zone layer. By assuming that the vertical movement of water is proportional to the difference in soil moisture content between the two layers, the water balance equation for the root zone layer is written as (5) where L is the depth of the root zone layer; C is a pseudo-diffusivity coefficient which depends on the soil properties; is the moisture content of the root zone layer; is the moisture content of the surface layer. We define T, equal to L/C, as the characteristic time length associated with a specific amount of root zone soil moisture change. Substituting T for L/C in (5) and integrating, the root zone soil moisture content can be written as (6) Assuming that is a linear function of , and replacing the integral in (6) with a discrete summation, Verstraeten et al. [32] define the time-dependent soil moisture saturation index for a 1-m profile, SMSI(t), as (7) The root zone SMC time series can be formulated as (8) is the root zone SMC at time t; and are respectively the maximum and the minimum of the SMSI time series; and are respectively the maximum and the minimum SMC at the measuring depth. For the and estimations, they can either be calculated respectively from the mean of field capacity and saturation value and the mean of wilting point and residual soil value, or be acquired from a time series soil moisture measurement data in this study. where
B. Accuracy Evaluation Three indexes were used to evaluate the accuracy, precision and predictive ability of the ATI-MODIS approach, the Pearson correlation coefficient (R), Root Mean Square Error (RMSE), and the Nash-Sutcliffe efficiency coefficient (E). The latter has mainly been used to assess the predictive power of hydrological models and is defined as (9)
and are respectively the observed SMC, which is where the in situ measurement, and the predicted SMC, which is derived from the ATI-MODIS approach, at the data point; is the averages of and n is the total number of points. The value of E ranges between 1.0 (perfect fit) and . When E is negative, it indicates that the observed time series would have been a better predictor than the model. III. DATA AND IMAGES A. Ground Stations The study area, the Mae Sa catchment in the Chiang Mai Province, northern Thailand, is located at and with a total area of about 285 . According to the Thailand Meteorological Development Bureau (http://www.tmd.go.th/en/climate.php?FileID=4), the annual rainfall of northern Thailand in 2009 is 1190.3 mm. The rainy season usually begins from May and lasts until October, and the dry season is from November to April. Evergreen broadleaf, dipterocarp and some evergreen pine forests occupy the hill areas while rice paddies and fruit plantations are located in the alluvial plains [45]. In situ measurements of eight ground stations in the catchment are used (Table I). These include three micro-meteorological stations (Site No. 421, 429, and 433); three sites with both rain gauge and soil moisture probes installed (Site No. 423, 425 and 428); one site with only soil moisture probes installed (Site No. 426); and one site with only rain gauge installed (Site No. 427). Because Site 426 and Site 427 are located close to each other, the SMC from Site 426 and the precipitation measurement from Site 427 are combined as one dataset in the subsequent analyses and indicated as Site 426 in this study. The three micro-meteorological stations acquire surface meteorological and hydrological parameters, including rainfall, air temperature, relative humidity, pressure, wind speed, wind direction, net radiation, soil heat flux, and SMC. For all the sites with SMC measured, data are available at three depths of 10 cm, 100 cm and 200 cm. All the measurements are taken at a 20-minute interval, and the daily averages are used as ground truth for analysis. B. Images After considering the spatial and temporal resolutions, spectrum information, and stability of data acquisition (e.g., routinely receiving and producing data products), we used MODIS data to provide necessary solar broadband albedo and diurnal temperature variation input data for (2). Depending on the spectral band, the spatial resolution at nadir is 250 m, 500 m, or 1000 m. Data of the Terra MODIS derivative land products from 2005 to 2008 were acquired from the Land Processes Distributed Active Archive Center (LPDAAC) at the U.S. Geological Survey Center for Earth Resources Observation and Science. Three surface parameters, including daytime land surface temperature, nighttime land surface temperatures, and total visible albedo were obtained from the Terra MODIS Land Surface Temperature & Emissivity 8-Day L3 Global 1 km (MOD11A2) and Band 1–7 Surface Reflectance 8-Day L3 Global 500 m (MOD09A1)
CHANG et al.: ESTIMATION OF ROOT ZONE SOIL MOISTURE USING APPARENT THERMAL INERTIA WITH MODIS IMAGERY
755
TABLE I LOCATIONS, LAND COVER TYPES AND EQUIPMENT INSTALLED AT THE GROUND STATIONS IN THE STUDY AREA
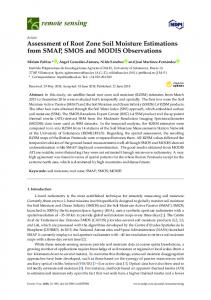
Fig. 1. Land cover map of the Mae Sa catchment digitized from the 2006 Quick Bird imagery with the 1 km MODIS grids overlaid and the ground stations labeled.
products. Although the 8-day composite images were used in this study, date of observation for every pixel was recorded in the MOD11A2 and MOD09A1 files. Therefore, the SMC retrieved from the MODIS images can be compared with daily average of the ground truth measurements of the same date. As in many other tropical mountainous areas, rapid land use/ cover change in the hilly terrain has resulted in fragmented land use patterns in the Mae Sa catchment. A high resolution 60 cm QuickBird Standard Pansharpened Natural Color imagery in 2006 was used to derive a detailed land cover map to examine the potential MODIS mixed pixel issue on the retrieved SMC values. The land cover map of Mae Sa digitized from the QuickBird imagery included eight classifications: urban, road, forest, crop field, fallow field, fruit plantation, greenhouse, and water body (Fig. 1). Forest was the dominant land cover type in the catchment, occupying approximately 80% of the area. Cultivated and fallow fields were found along the river valleys and hillslopes.
IV. RESULTS AND DISCUSSION A. Comparison of the Root Zone SMC Derived From the ATI-MODIS Approach and the in Situ Measurements 1) Incorporation of Precipitation Data Into the ATI-MODIS Estimations: The high temporal resolution of the Terra MODIS enabled the SMC estimation at an 8-day interval, but cloudiness during the May to October rainy season limited the availability of the images for analysis. As can be seen in Fig. 2(a), ATI-MODIS SMC estimations have large gaps during the wet season every year. From January to April, within the dry season, the ATI-MODIS estimations corresponded well with the in situ measurements (Fig. 2(a)). For the early dry season, however, especially in November each year, some discrepancies between estimated and observed SMC are seen. The lack of surface SMSI information during the wet seasons probably affected the accuracy of SMC estimates at the beginning of the dry seasons.
756
IEEE JOURNAL OF SELECTED TOPICS IN APPLIED EARTH OBSERVATIONS AND REMOTE SENSING, VOL. 5, NO. 3, JUNE 2012
TABLE II R, RMSE AND E BETWEEN THE in situ SMC MEASUREMENTS AND THE ATI-MODIS DERIVED SMC ESTIMATIONS AT THREE DEPTHS. THE CHARACTERISTIC TIME LENGTH (T) FOR EACH SITE WAS GIVEN FOR THE BEST-FIT ESTIMATION
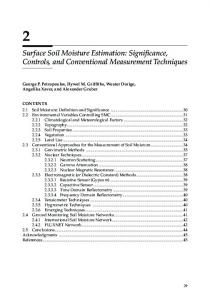
Fig. 2. Comparison of the in situ SMC measurements and the SMC estimations from the ATI-MODIS approach for the 100 cm depth at Site 426 from the beginning of 2005 to the end of 2008 for (a) without the precipitation and (b) with the precipitation. The year in the X axis is labeled at the beginning of each year.
To reduce the influence of data discontinuity resulting from the cloud cover images in the rainy seasons, we incorporated precipitation as a constraint in the ATI-MODIS approach. The precipitation constraints could provide insights into whether the cloudy days have precipitation and hence the root zone soil moisture is almost in saturation, or they only have persistent cloud cover without precipitation. Such information is needed for root zone SMC estimations because even when cloud free images became available at the beginning of the dry season, we would still require prior surface soil moisture information before the image was taken (i.e., for (6)). The precipitation constraint was determined when all the seven sites in the study area recorded precipitation, assuming that the surface soils of that day could be considered as saturated in the ATI algorithm. We noted that when the daily precipitation recorded at the Chiang Mai station of the Thai Meteorological Department reached 5% of the highest daily rainfall in a year, all the seven sites in the study area also recorded precipitation, which was approximately 40 mm per 24 hour over the catchment (derived from the in situ measurements from 2005
to 2008). Therefore, on days with precipitation reached the 5% threshold, the surface SMSI of that day could be considered as saturated, and the SMSI would then be set equal to one in the ATI algorithm. Fig. 2(b) shows the improved SMC estimations from the MODIS images with precipitation constraints in the ATI algorithm. The correlation coefficient between the in situ measurements and the ATI-MODIS estimations at Site 426 increased from 0.77 without the precipitation constraint to 0.87 with the precipitation constraint. Incorporating the precipitation constraints into the ATI algorithm not only filled in data gaps, but also improved the accuracy of root zone SMC estimation, particularly at the beginning of the dry seasons. Thus, precipitation data were incorporated into all the SMC estimations with the ATI-MODIS approach for the subsequent analyses unless otherwise specified. 2) Validation of the ATI-MODIS Derived SMC at Three Depths: An assumption of the ATI-MODIS approach is that the characteristic time length (T) represents the time necessary for water to move vertically from the top soil layer to the root zone layer. For the EUROFLUX forest sites, the T value for retrieving the SMC at the depth of 100 cm was suggested to be equal to 60 days [32]. In this study, the optimal T values at 10 cm, 100 cm and 200 cm depths at each experimental site were determined with an interval of 10 days (i.e., ) by obtaining the best fit between the in situ SMC measurements and the ATI-MODIS derived SMC estimations. The optimal T values ranged between 10 and 30 for the top soil layer at the depth of 10 cm, varied from 30 to 60 days for the depth of 100 cm, and between 40 and 70 days for the 200 cm depth. The mean T values for 10 cm, 100 cm and 200 cm were, respectively, 20, 40 and 60 days (Table II) for the Mae Sa catchment. The larger the T value, the longer the period of surface moisture information needed to estimate the root zone SMC. The results of tests to validate ATI-MODIS-derived SMC estimates are shown in Table II. The observation sites had SMC measurements from 2005 to 2008 for validation, except for Site 421, for which data were collected from 2005 to 2007, and Site 433 that had measurements only between 2005 and 2006. In terms of the mean values of the seven sites, the average E values
CHANG et al.: ESTIMATION OF ROOT ZONE SOIL MOISTURE USING APPARENT THERMAL INERTIA WITH MODIS IMAGERY
757
TABLE III PERCENT VALUES OF THE LAND COVER TYPES DIGITIZED FROM THE QUICKBIRD IMAGERY FOR EACH OF THE SEVEN 1 KM MODIS GRIDS WHERE THE SITES WITH in situ SMC MEASUREMENTS ARE LOCATED. THE PERCENT VALUES ARE ROUNDED UP TO INTEGERS
were 0.57, 0.537, and 0.492, respectively, for the SMC estimations at 10 cm, 100 cm, and 200 cm, showing a decreased predictive power from the surface root zone layer to the deep root zone layer for the ATI-MODIS approach. The averaged R values for the 100 cm and 200 cm depths, both 0.84, are higher than that of the 10 cm depth (0.80). The 10 cm estimations had the highest average RMSE, 0.055 , while the 100 cm estimations had the lowest RMSE at 0.025 . Evaluating the ATI-MODIS derived SMC estimations at the three depths using these validation statistics thus suggested that the ATI-MODIS approach performed the best for the root zone SMC estimation at the 100 cm depth. 3) Evaluation of Possible Mixed Pixel Effects on the ATIMODIS Estimations: The land use/cover patterns on the hillslopes of a tropical mountainous catchment are often patchy and fragmented. The coarse MODIS 1 km resolution data, therefore, have the problem of spectral mixing, i.e., a given 1-km MODIS pixel is likely to contain more than one land use/cover type. To evaluate the extent to which the mixed pixel affects the root zone SMC estimations from the ATI-MODIS approach, a detailed land cover map for the Mae Sa catchment was derived from the high resolution 60 cm QuickBird imagery (Fig. 1). Table III shows the percentages of the land cover types within the 1-km MODIS grid for each of the seven sites. Although the forest cover dominated all the seven sites ranging from 45% at Site 421 to 95% at Site 428, most of the sites were more or less mixed with other land cover types, such as crop field, fruit plantation, and fallow field, within the 1-km MODIS grid (Table III). Site 426 and site 428, both with soil moisture probes installed under forest (cf. Table I), were compared for the evaluation of the mixed pixel effects. According to the QuickBird imagery, the land cover in the area surrounding Site 428 was dominated by forests (95%) with a very small portion of fallow fields (3%). Conversely, the land cover composition of Site 426 was a mixture of forests (57%), fruit plantations (20%), fallow fields (18%), and croplands (4%). The homogeneity of the nearly 100% forested pixel for Site 428 probably accounted for its low RMSE value of 0.031, lowest of all the sites, for the 10-cm depth SMC estimates. However, the RMSE for the mixed pixel of Site 426 was only slightly higher (0.038), the second lowest among the seven sites (Table II). For the root zone SMC estimations at 100 cm and 200 cm depths, the mixed land cover of Site 426 did not seem to affect the performance
of the ATI-MODIS approach, with the RMSE for those two depths both better than those of Site 428 (Table II). On the other hand, high RMSE values at the three depths were observed for Site 421 and Site 433, for which, the land cover types were also mixed within their MODIS pixels. The poor accuracy at these two sites might be attributed to two main causes. First, both sites had relatively short-term in situ measurements compared with the other five sites. As opposed to having four years of data from 2005 to 2008 for validation, Site 421 and Site 433 had three and two years of in situ SMC measurements, respectively. Second, the in situ measurements at both sites are made under non-forest cover. The soil moisture probes at Site 421 were installed under crop field while those at Site 433 were installed under fruit plantation. Agricultural activities, such as irrigation, might have affected their SMC. In addition, the construction of a new pond by the villagers nearby the installed equipment at Site 433 might have modified the microclimate of the site condition, further influencing the SMC estimations with the ATI-MODIS approach. These factors might explain the high RMSEs for Site 433 at 10 cm and 100 cm depths compared with the other sites. B. Possible Factors Responsible for the Variation of Root Zone SMC in Mae Sa Insights into the SMC variability over different land cover types are important for understanding hydrological and ecological processes. Vegetation cover and topography exert strong control over the variability of the root zone SMC [10]; while changes in vegetation type also affect the SMC through the alteration of land surface energy and soil pore spaces [46]. In the Mae Sa catchment, SMC variation had a larger amplitude in the top soil layer than in the deeper root zone layers for all the seven sites of various land cover types (Fig. 3(a)–(b)). Comparing land cover types, the 200 cm SMC exhibited smaller fluctuations under the forest cover for Sites 425, 426, and 429 than under the agricultural land cover types such as the crop field for Site 421 and the fruit plantation for Site 433. Within the four forest sites (i.e., Sites 425, 426, 428, and 429), Site 428 had the largest SMC variation at the 200 cm depth, a fluctuation of more than 0.1 over a year, as opposed to fluctuations of less than 0.1 for the other three sites. The scatter plot of the in situ measurements against the ATI-MODIS estimations for the 200 cm depth also shows that Site 428 had the largest variation
758
IEEE JOURNAL OF SELECTED TOPICS IN APPLIED EARTH OBSERVATIONS AND REMOTE SENSING, VOL. 5, NO. 3, JUNE 2012
Fig. 3(a). The relationship between the in situ SMC measurements and the ATI-MODIS retrieved SMC estimations for 10 cm, 100 cm, and 200 cm depths at Site 421, Site 423, Site 425, and Site 426.
compared with other sites (Fig. 3(b)). An examination of site condition of Site 428 showed that it was located at a valley, and hence topography might be influenced on its SMC variation. To minimize the topographic effect on SMC variation, sites with similar topographic positions and soil characteristics were further compared so as to assess the variability of SMC at different depths under different land cover types. Site 421 (agri-
culture) and Site 425 (forest) were selected because their topographic positions were both located at the hilltops. Besides, both sites were of the same soil group without soil profile development [47]. At the depth of 10 cm, the amount and the temporal dynamic of SMC for the two sites was similar. For the depths of 100 cm and 200 cm, however, differences between the two sites became apparent. The 100-cm SMC was lower during the dry
CHANG et al.: ESTIMATION OF ROOT ZONE SOIL MOISTURE USING APPARENT THERMAL INERTIA WITH MODIS IMAGERY
759
0.3 . In addition, the 200 cm SMC was more stable at the forest site than the agriculture site (Fig. 3(a)). The differences in root zone SMC between the two sites were probably due to the higher rate of evapotranspiration for forest and the use of irrigation at the agricultural site during the dry seasons. Hence, differences in land cover contributed to spatial variability of root zone SMC. The scatter plots in Fig. 3(b) suggest that the ATI-MODIS approach underestimated the SMC values for all the three depths at Site 433, and for the 100 cm and the 200 cm depths at Site 428. This was probably due to a site condition change at Site 433 and the topographic effect at Site 428 previously discussed. For the other five sites of different land cover types, the scatter plots showed good positive correlations with most of the data points falling near the 1:1 line, suggesting the usefulness of the ATIMODIS approach in retrieving SMC of various land cover types in this tropical mountainous catchment. This allows long-term monitoring of SMC using the ATI-MODIS approach, which in turn will contribute to water resource management of tropical catchments. V. CONCLUSIONS
Fig. 3(b). The relationship between the in situ SMC measurements and the ATI-MODIS retrieved SMC estimations for 10 cm, 100 cm, and 200 cm depths at Site 428, Site 429, and Site 433.
seasons for the forest site (i.e., Site 425) at approximately 0.25 than the agriculture site (i.e., Site 421) at approximately
The study adopted the ATI soil moisture algorithm from [32] in conjunction with the MODIS imagery to estimate the root zone SMC in tropical environments. The parameters used in the proposed ATI-MODIS approach included daytime and nighttime surface temperatures and total visible albedo from the Terra MODIS land products, and precipitation, soil texture, and the minimum and maximum SMC measurements from the ground stations. The MODIS images in the Mae Sa catchment of northern Thailand from 2005 to 2008 were used to estimate the root zone SMC at the three depths of 10 cm, 100 cm, and 200 cm. The retrieved SMC estimations from the ATI-MODIS approach were validated with the in situ measurements from seven ground stations using the Pearson correlation coefficient, the RMSE, and the Nash-Sutcliffe efficiency coefficient. Comparison of the retrieved SMC with the in situ measurements at the three root zone depths showed that most of the Pearson correlation coefficients were above 0.75, with the highest R values at 0.88. The Nash-Sutcliffe efficiency coefficients varied between 0.163 and 0.764 and the RMSE varied between 0.010 and 0.075. When the average values of the seven sites were considered to evaluate the effectiveness of the ATI-MODIS approach, the method performed the best for the SMC estimation at the 100 cm root zone depth. Examination of the potential effects of the mixed land cover types within the 1 km MODIS pixel suggested that the ATI-MODIS estimations were not influenced by the mixed pixel effects in forest dominated sites. The mixed agricultural land covers at two of the seven sites, however, might have accounted for the local SMC change due to irrigation water use. The study demonstrated the usefulness of using ATI-MODIS approach in root zone SMC estimation for a tropical mountainous catchment. The spatial and temporal resolutions and the spectrum information of the MODIS imagery enable large area SMC monitoring, thereby contributing to the understanding of hydrological and ecological processes in the tropics.
760
IEEE JOURNAL OF SELECTED TOPICS IN APPLIED EARTH OBSERVATIONS AND REMOTE SENSING, VOL. 5, NO. 3, JUNE 2012
REFERENCES
[1] A. Ohmura and E. Raschke, “Energy budget at the Earth’s surface,” in Observed Global Climate, M. Hantel, Ed. Berlin, Germany: Springer, 2005, vol. V6, Group 5 Geophysics, Landold-Börnstein. [2] Y.-A. Liou and A. W. England, “A land surface process radiobrightness model with coupled heat and moisture transport in soil,” IEEE Trans. Geosci. Remote Sens., vol. 36, pp. 273–286, 1998. [3] Y.-A. Liou, J. Galantowicz, and A. W. England, “A land surface process/radiobrightness with coupled heat and moisture transport for prairie grassland,” IEEE Trans. Geosci. Remote Sens., vol. 37, no. 4, pp. 1848–1859, 1999. [4] G. Van der Schrier and J. Barkmeijer, “North American 1818–1824 drought and 1825–1840 pluvial and their possible relation to the atmospheric circulation,” J. Geophys. Res., vol. 112, p. D13102, 2007. [5] F. J. Turk, G. V. Mostovoy, and V. G. Anantharaj, “Soil moisture sensitivity to NRL-blend high-resolution precipitation products: Analysis of simulations with two land surface models,” IEEE J. Sel. Topics Appl. Earth Observ. Remote Sens., vol. 3, pp. 32–48, 2010. [6] J. Song, M. L. Wesely, R. L. Coulter, and E. A. Brandes, “Estimating watershed evaportranspiration with PASS. Part I: Inferring root-zone moisture conditions using satellite data,” J. Hydrometeorol., vol. 1, pp. 447–460, 2000. [7] P. J. Starks and T. J. Jackson, “Remote sensing and estimation of root zone water content,” Remote Sensing and Hydrology 2000, IAHS Publ., no. 267, pp. 409–411, 2001. [8] T. Dunne and R. D. Black, “An experimental investigation of runoff production in permeable soils,” Water Resour. Res., vol. 6, pp. 478–490, 1970. [9] V. Y. Ivanov, S. Fatichi, G. D. Jenerette, J. F. Espeleta, P. A. Troch, and T. E. Huxman, “Hysteresis of soil moisture spatial heterogeneity and the “homogenizing” effect of vegetation,” Water Resour. Res., vol. 46, p. W09521, 2010. [10] D. A. Robinson, C. S. Campbell, J. W. Hopmans, B. K. Hornbuckle, S. B. Jones, R. Knight, F. Ogden, J. Selker, and O. Wendroth, “Soil moisture measurement for ecological and hydrological watershed-scale observatories: A review,” Vadose Zone J., vol. 7, pp. 358–389, 2008. [11] E. Van den Elsen, S. Eeman, J. Stolte, and C. Ritsema, “Measuring precipitation, infiltration and water discharge on a catchment scale for soil erosion modeling in the south pacific region,” in 13th Int. Soil Conservation Organisation Conf., ISCO 2004, Brisbane, Australia, Jul. 2004. [12] E. J. Kim, “Field data report for the third Radiobrightness Energy Balance Experiment (REBEX-3), Sep. 1994-Sep. 1995, wet acidic tundra on the Alaskan north slope,” Radiation Lab., Univ. Michigan, Ann Arbor, Tech. Rep. RL-918, Jul. 1996. [13] T. J. Jackson, D. M. Le Vine, F. R. Schiebe, and T. J. Schmugge, “Large area mapping of soil moisture using passive microwave radiometry in the Washita’92 experiment,” in Proc. IEEE IGARSS’93, Piscataway, NJ, 1993, pp. 1009–1012. [14] T. J. Jackson, D. M. Le Vine, A. Y. Hsu, A. Oldak, P. J. Starks, C. T. Swift, J. D. Isham, and M. Haken, “Soil moisture mapping at regional scales using microwave radiometry: The southern great plains hydrology experiment,” IEEE Trans. Geosci. Remote Sens., vol. 37, pp. 2136–2151, 1999. [15] T. J. Jackson and A. Y. Hsu, “Soil moisture and TRMM microwave imager relationships in the southern great plains 1999 (SGP99) experiment,” IEEE Trans. Geosci. Remote Sens., vol. 39, pp. 1632–1642, 2001. [16] T. J. Jackson, R. Bindlish, M. Klein, A. J. Gasiewski, and E. G. Njoku, “Soil moisture retrieval and AMSR-E validation using an airborne microwave radiometer in SMEX02,” in Proc. IEEE IGARSS’03, Piscataway, NJ, 2003, vol. 1, pp. 401–403. [17] T. J. Jackson, M. S. Moran, and P. E. O’Neill, “Introduction to soil moisture experiments 2004 (SMEX04),” Remote Sens. Environ., vol. 112, pp. 301–303, 2008. [18] T. Koike, “The coordinated enhanced observing period (CEOP): An initial step for integrated global water cycle observation,” WMO Bull., vol. 53, pp. 115–121, 2004. [19] R. Panciera, J. P. Walker, J. D. Kalma, E. J. Kim, J. M. Hacker, O. Merlin, M. Berger, and N. Skou, “The NAFE’05/CoSMOS data set: Toward SMOS soil moisture retrieval, downscaling, and assimilation,” IEEE Trans. Geosci. Remote Sens., vol. 46, no. 3, pp. 736–745, 2008. [20] O. Merlin, J. P. Walker, J. D. Kalma, E. J. Kim, J. Hacker, R. Panciera, R. Young, G. Summerell, J. Hornbuckle, M. Hafeez, and T. Jackson, “The NAFE’06 data set: Towards soil moisture retrieval at intermediate resolution,” Adv. Water Resour., vol. 31, pp. 1444–1455, 2008.
[21] G. R. Diak, R. M. Rabin, K. P. Gallo, and C. M. Neale, “Regional-scale comparisons of vegetation and soil wetness with surface energy budget properties from satellite and in situ observations,” Remote Sens. Rev., vol. 12, pp. 94–128, 1995. [22] E. F. Lambin and D. Ehrlich, “The surface temperature-vegetation index space for land cover and land-cover change analysis,” Int. J. Remote Sens., vol. 17, pp. 463–487, 1996. [23] W. G. M. Bastiaanssen, H. Pelgrum, P. Droogers, H. A. R. de Bruin, and M. Menenti, “Area-average estimates of evaporation, wetness indicators and top soil moisture during two golden days in EFEDA,” Agric. For. Meteorol., vol. 87, pp. 119–137, 1997. [24] G. Boni, D. Entekhabi, and F. Castelli, “Land data assimilation with satellite measurements for the estimation of surface energy balance components and surface control on evaporation,” Water Resour. Res., vol. 37, pp. 1713–1722, 2001. [25] F. T. Ulaby, P. C. Dubois, and J. Van Zyl, “Radar mapping of surface soil moisture,” J. Hydrol., vol. 184, pp. 57–84, 1996. [26] S.-F. Liu, Y.-A. Liou, W.-J. Wang, J.-P. Wigneron, and J.-B. Lee, “Retrieval of crop biomass and soil moisture from measured 1.4 and 10.65 GHz brightness temperatures,” IEEE Trans. Geosci. Remote Sens., vol. 40, pp. 1260–1268, 2002. [27] A. Merzouki, H. McNairn, and A. Pacheco, “Mapping soil moisture using RADARSAT-2 data and local autocorrelation statistics,” IEEE J. Sel. Topics Appl. Earth Observ. Remote Sens. (JSTARS), vol. 4, pp. 128–137, 2011. [28] X. Zhang, J. Zhao, Q. Sun, X. Wang, Y. Guo, and J. Li, “Soil moisture retrieval from AMSR-E data in Xinjiang (China): Models and validation,” IEEE J. Sel. Topics Appl. Earth Observ. Remote Sens. (JSTARS), vol. 4, pp. 117–127, 2011. [29] A. Balenzano, F. Mattia, G. Satalino, and M. W. J. Davidson, “Dense temporal series of C- and L-band SAR data for soil moisture retrieval over agricultural crops,” IEEE J. Sel. Topics Appl. Earth Observ. Remote Sens. (JSTARS), vol. 4, pp. 439–450, 2011. [30] J. Pulliainen, P. Hari, M. Hallikainen, N. Patrikainen, M. Peramaki, and P. Kolari, “Monitoring of soil moisture and vegetation water content variations in boreal forest from C-band SAR data,” in Proc. IEEE IGARSS’04, Piscataway, NJ, 2004, vol. 2, pp. 1013–1016. [31] L. L. Bourgeau-Chavez, E. S. Kasischke, K. Riordan, S. Brunzell, M. Nolani, E. Hyer, J. Slawski, M. Medvecz, T. Walters, and S. Ames, “Remote monitoring of spatial and temporal surface soil moisture in fire disturbed boreal forest ecosystems with ERS SAR imagery,” Int. J. Remote Sens., vol. 28, no. 10, pp. 2133–2162, 2007. [32] W. W. Verstraeten., F. Veroustraete, C. J. Van der Sande, I. Grootaers, and J. Feyen, “Soil moisture retrieval using thermal inertia, determined with visible and thermal spaceborne data, validated for European forests,” Remote Sens. Environ., vol. 101, pp. 299–314, 2006. [33] J. T. Pulliainen, T. Manninen, and M. Hallikainen, “Application of ERS-1 wind scatterometer data to soil frost and soil moisture monitoring in boreal forest zone,” IEEE Trans. Geosci. Remote Sens., vol. 36, no. 3, pp. 849–863, 1998. [34] A. Ceballos, K. Scipal, W. Wagner, and J. Martinez-Fernandez, “Validation of ERS scatterometer-derived soil moisture data in the central part of the Duero Basin, Spain,” Hydrol. Process., vol. 19, pp. 1549–1566, 2005. [35] L. Wang and J. J. Qu, “Satellite remote sensing applications for surface soil moisture monitoring: A review,” Frontiers of Earth Science, vol. 3, pp. 237–247, 2009. [36] J. Fox, J. Krummel, M. Ekasingh, S. Yarnasarn, and N. Podger, “Land-use and landscape dynamics in northern Thailand: Assessing change in three upland watersheds since 1954,” Ambio, vol. 24, pp. 328–334, 1995. [37] M. A. Giraldo, D. Bosch, M. Madden, L. Usery, and M. Finn, “Ground and surface temperature variability for remote sensing of soil moisture in a heterogeneous landscape,” J. Hydrol., vol. 368, pp. 214–223, 2009. [38] A. W. England, J. F. Galantowicz, and M. S. Schretter, “The Radiobrightness thermal inertia measure of soil moisture,” IEEE Trans. Geosci. Remote Sens., vol. 30, no. 1, pp. 132–139, 1992. [39] P. Cracknell and Y. Xue, “Thermal inertia determination from space-a tutorial review,” Int. J. Remote Sens., vol. 17, no. 3, pp. 431–461, 1996. [40] J. A. Sobrino and M. H. El. Kharraz, “Combining afternoon and morning NOAA satellites for thermal inertia estimation 1. Algorithm and its testing with hydrologic atmospheric pilot experiment-sahel data,” J. Geophys. Res., vol. 104(D8), pp. 9445–9453, 1999a. [41] J. A. Sobrino and M. H. El. Kharraz, “Combining afternoon and morning NOAA satellites for thermal inertia estimation 2. Methodology and application,” J. Geophys. Res., vol. 104(D8), pp. 9455–9465, 1999b.
CHANG et al.: ESTIMATION OF ROOT ZONE SOIL MOISTURE USING APPARENT THERMAL INERTIA WITH MODIS IMAGERY
[42] G. Cai, Y. Xue, Y. Hu, Y. Wang, J. Guo, Y. Luo, C. Wu, S. Zhong, and S. Qi, “Soil moisture retrieval from MODIS data in Northern China Plain using thermal inertia model,” Int. J. Remote Sens., vol. 28, no. 16, pp. 3567–3581, 2007. [43] J. C. Price, “Thermal inertia mapping: A new view of the Earth,” J. Geophys. Res., vol. 82, no. 18, pp. 2582–2590, 1977. [44] S. Liang, “Narrowband to broadband conversions of land surface albedo I algorithms,” Remote Sens. Environ., vol. 76, pp. 213–238, 2000. [45] Y.-C. Wang, C.-C. Feng, and H. Vu Duc, “Integrating multi-sensor remote sensing data for land use/cover mapping in a tropical mountainous area in northern Thailand,” Geogr. Res., DOI: 10.1111/j.1745-5871. 2011.00732.x, Accepted. [46] X. Chen, Z. Zhang, X. Chen, and P. Shi, “The impact of land use and land cover changes on soil moisture and hydraulic conductivity along the karst hillslopes of southwest China,” Env. Earth Sci., vol. 59, no. 4, pp. 811–820, 2009. [47] Land Development Department of Thailand, Soil of Thailand Mar. 27, 2011 [Online]. Available: http://www.ldd.go.th/thaisoils_museum/ INDEX.HTM
Tzu-Yin Chang (S’07–M’11) was born in Taipei, Taiwan. She received the B.S. and M.S. degrees in geography from the National Taiwan University, Taipei, Taiwan, and the Ph.D. degree in space science from the National Central University, Jhongli, Taiwan, in 2000, 2002, and 2010, respectively. She was a Research Fellow at the National University of Singapore, Singapore. She is currently an Assistant Research Fellow at the National Science and Technology Center for Disaster Reduction, Taiwan. Her research interests cover the hydrological remote sensing with optical and microwave sensors and natural hazards.
Yi-Chen Wang received the B.S. and M.S. degrees in geography from the National Taiwan University and the Ph.D. degree in geography from the University at Buffalo, The State University of New York, in 1997, 1999, and 2004, respectively. She is currently an Assistant Professor at the National University of Singapore. Her research interests include applications of GIS and remote sensing in land use/cover change, patterns and processes of vegetation dynamics, and vegetation reconstruction using historical survey records.
Chen-Chieh Feng received the B.S. and M.S. degrees in geography from National Taiwan University and Ph.D. degree in geography from University at Buffalo, The State University of New York, in 1994, 1996, and 2004, respectively. His research interests include the use of GIS and remote sensing for studying impacts of land use land cover changes on public health, remote sensing data accuracy, and spatial data mining and handling. He is currently an Assistant Professor at the Department of Geography, National University of Singapore.
761
Alan D. Ziegler was born in Kansas (USA) in 1965. He received the doctorate in geography from the University of Hawaii in 2000. He received the undergraduate and M.A. degrees from the University of Kansas in 1988 and 1991. He is currently an Associate Professor in the Geography Department at the National University of Singapore. His research addresses the interactions of physical, ecological, and human systems, with water resources serving as a common nexus. His main geographical area of focus is SE Asia.
Thomas Giambelluca received the B.S. and M.A. degrees from the University of Miami, FL, in 1974 and 1977, respectively, and the Ph.D. degree from the University of Hawai’i at Mānoa, in 1983. He joined the faculty of the Geography Department at the University of Hawai’i at Mānoa in 1986, where he is currently a Professor. His main areas of research interest are ecohydrology of natural and human-disturbed tropical ecosystems and climate variability and change in Hawai’i and other areas of the tropics.
Yuei-An Liou (S’91–M’96–SM’01) received the B.S. degree in electrical engineering from National Sun Yat-Sen University, Kaohsiung, Taiwan, the M.S.E. degree in electrical engineering (EE), the M.S. degree in atmospheric and space sciences, and the Ph.D. degree in EE and atmospheric, oceanic, and space sciences from the University of Michigan, Ann Arbor, in 1987, 1992, 1994, and 1996, respectively. His current research activities include GPS meteorology and ionosphere, remote sensing of the atmosphere, land surface, and polar ice, land surface processes modeling, and application of neural networks and fuzzy systems in inversion problems. He has over 100 referral papers and more than 200 international conference papers. Dr. Liou is a Member of the Editorial Advisory Board to GPS Solutions, and serves as Guest Editor for the June 2005 Special Issue of “GPS Radio Occultation (RO) Experiments” and for the January 2010 Special Issue of “Advancements in Atmospheric and Ionospheric Research, Meteorology, Climate Change, Weather Prediction, Oceanography, and Geodesy from GPS Radio Occultation Methods”. He serves as a leading guest editor for the IEEE TGRS special issue “Meteorology, Climate, Ionosphere, Geodesy, and Reflections from the Ocean surfaces: Studies by Radio Occultation Methods.” He serves as an Associate Editor, IEEE JSTARS from 2008; Editor, Journal of Aeronautics, Astronautics and Aviation from 2009; and Editor, International Journal of Navigation and Observation & Remote Sensing Technology and Application from 2011. He is now a distinguished professor of the Center for Space and Remote Sensing Research, National Central University, Taiwan. He was awarded Honorary Life Member of The Korean Society of Remote Sensing in 2007. He was elected Foreign Member, Russian Academy of Engineering Sciences; and awarded Outstanding Alumni Awards by University of Michigan Alumni Association in Taiwan and National Sun Yat-sen University in 2008. He was elected Academician, International Academy of Astronautics in 2009. He was honored Distinguished Professor, National Central University in 2010.