Nat. Hazards Earth Syst. Sci., 12, 2019–2037, 2012 www.nat-hazards-earth-syst-sci.net/12/2019/2012/ doi:10.5194/nhess-12-2019-2012 © Author(s) 2012. CC Attribution 3.0 License.
Natural Hazards and Earth System Sciences
Estimation of seismic ground motions using deterministic approach for major cities of Gujarat J. Shukla and D. Choudhury Department of Civil Engineering, Indian Institute of Technology Bombay, Powai, Mumbai, 400076, India Correspondence to: D. Choudhury (
[email protected]) Received: 10 January 2011 – Revised: 30 March 2011 – Accepted: 16 May 2011 – Published: 26 June 2012
Abstract. A deterministic seismic hazard analysis has been carried out for various sites of the major cities (Ahmedabad, Surat, Bhuj, Jamnagar and Junagadh) of the Gujarat region in India to compute the seismic hazard exceeding a certain level in terms of peak ground acceleration (PGA) and to estimate maximum possible PGA at each site at bed rock level. The seismic sources in Gujarat are very uncertain and recurrence intervals of regional large earthquakes are not well defined. Because the instrumental records of India specifically in the Gujarat region are far from being satisfactory for modeling the seismic hazard using the probabilistic approach, an attempt has been made in this study to accomplish it through the deterministic approach. In this regard, all small and large faults of the Gujarat region were evaluated to obtain major fault systems. The empirical relations suggested by earlier researchers for the estimation of maximum magnitude of earthquake motion with various properties of faults like length, surface area, slip rate, etc. have been applied to those faults to obtain the maximum earthquake magnitude. For the analysis, seven different ground motion attenuation relations (GMARs) of strong ground motion have been utilized to calculate the maximum horizontal ground accelerations for each major city of Gujarat. Epistemic uncertainties in the hazard computations are accounted for within a logic-tree framework by considering the controlling parameters like bvalue, maximum magnitude and ground motion attenuation relations (GMARs). The corresponding deterministic spectra have been prepared for each major city for the 50th and 84th percentiles of ground motion occurrence. These deterministic spectra are further compared with the specified spectra of Indian design code IS:1893-Part I (2002) to validate them for further practical use. Close examination of the developed spectra reveals that the expected ground motion values become high for the Kachchh region i.e. Bhuj city and moderate in the Mainland Gujarat, i.e. cities of Surat and Ahmedabad. The seismic ground motion level in the Saurashtra is moderate but marginally differs from that as presently specified in
IS:1893-Part I (2002). Based on the present study, the recommended PGA values for the cities studied are 0.13 g, 0.15 g, 0.64 g, 0.14 g and 0.2 g for Ahmedabad city, Surat City, Bhuj City, Jamnagar City and Junagadh city, respectively. The prepared spectra can be further used for seismic resistant design of structures within the above major city boundaries of Gujarat to quantify seismic loading on structures.
1
Introduction
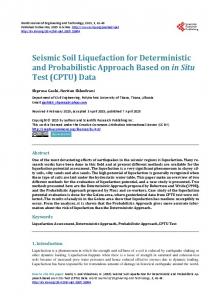
Proper determination of the peak horizontal ground acceleration for designing the earthquake-resistant structures in earthquake-prone regions is essential. In country like India with huge populations, the utmost care must be taken for such estimation of seismic ground motion for seismically active regions like the Himalayian belt, the Kachchh region, etc. The current practice in India for assigning the earthquake load for the design of structures is to utilize the seismic hazard zonation map given in the Indian standard design code IS:1893-Part I (2002), in which India is divided into four subclasses of seismic zones. The assigned peak ground acceleration (PGA) values on that map are 0.08 g, 0.16 g, 0.24 g and 0.32 g for Zones, II, III, IV and V respectively. The seismic zonation map for the Gujarat region is shown in Fig. 1. In the seismic zonation map, the transition from one seismic zone to the adjacent one is rather drastic; it is created by either dropping or increasing the ground acceleration by 0.08 g. Also, the estimation for seismic ground motions in various major cities of Gujarat is still not consistent with the tectonic framework for Gujarat. Hence, in this paper an attempt has been made to estimate the seismic ground motions for the entire region of Gujarat including some typical major cities representing all seismic zones. The Gujarat region is located within the tectonic plate of India, about 500 km from a transform plate boundary (Bendick et al., 2001) (Fig. 1). The region has also experienced
Published by Copernicus Publications on behalf of the European Geosciences Union.
2020
J. Shukla and D. Choudhury: Estimation of seismic ground motions using deterministic
several damaging moderate-sized earthquakes with moment magnitudes between 5 and 6 (Bendick et al., 2001, Petersen et al., 2004, Choudhury and Shukla, 2011). Nine of these moderate earthquakes have occurred during the past 155 yr in this region with an average of about one event every 17 yr. Large and moderate earthquakes are likely to repeat in the future and it is essential to assess the hazard in order to aid engineers and public officials in making decisions that will influence economic and life safety policies for the Gujarat region (Petersen et al., 2004). During the year 2008, 1842 shocks of moment magnitude of 0.5 to 4.4 were recorded in Gujarat. Figure 2 illustrates the locations of epicenters for various earthquakes recorded during 2008 through the Gujarat State Seismic Network (GS-Net), recently established by the Institute of Seismological Research (ISR), Gujarat. The present study aims to carry out deterministic seismic hazard analysis for a few major cities of Gujarat. Typical five major city locations viz. Ahmedabad, Surat, Jamnagar, Bhuj and Junagadh have been selected for the present study. The selection of these five sites is primarily based on the fact that all these sites represent all the three parts of the investigated area, i.e. Kachchh, Saurashtra and the Mainland region of Gujarat and within that particular area, they are also the hubs of commercial/administrative activities. Moreover, these locations also represent the different earthquake zonations given in IS: 1893 – Part I (2002) which will facilitate the comparison of the outcome of this study with provisions of the code. The outcome of the present study consists of deterministic response spectra of the horizontal component of ground motion for different natural periods of structures for the particular city for the reference 50 percentile (median) and 84 percentile of earthquake occurrence, respectively.
tion Relations (GMARs) within a probabilistic framework to identify the most probable deterministic ground motion values at a given site. The Epistemic uncertainty in the present analysis has been tackled within a logic-tree framework considering a few controlling parameters like region specific bvalue, maximum magnitude of earthquake, and ground motion attenuation relations (GMARs).
3
The collision process of the Indian plate with the Eurasian plate is still underway at a rate of 45 mm year−1 , inducing an anticlockwise rotation of the plate (Bilham, 2004). Apart from the active seismic sources at the plate boundary (i.e. Himalayan arc), most of Peninsular India (PI) has been considered as a low seismic zone until the occurrence of some surprising and damaging earthquakes in the recent past (e.g. Koyna, 1967; Latur, 1993; Jabalpur, 1997, and Bhuj, 2001). From the point of view of physiography, the Gujarat region of India is comprised of three distinct zones: Kachchh, Saurashtra, and Mainland Gujarat (Chopra et al., 2010). The region is a junction of three tectonic rifts: Kachchh, Cambay and Narmada with several active faults (Biswas 1987, 2005; Talwani and Gangopadhayay, 2001). The seismicity of the Gujarat state is characterized by a relatively high frequency of large earthquakes but a relatively low frequency of moderate earthquakes, particuarly in the Kachchh region. The seismic characteristics of the Gujarat state has been divided into three regions (e.g. Kachchh, Saurashtra and Mainland Gujarat) to study the seismicity within the regions. 3.1
2
Seismotectonic settings
Kachchh
Methodology
Following Yadav et al. (2008), in the present study, the entire Gujarat region is divided into three seismogenic regions on the basis of seismicity, tectonics and geomorphology, namely Saurashtra, Mainland Gujarat and Kachchh. Available seismotectonic and geological criteria are combined to prepare a possible fault map which is then put together with the available earthquake catalogue to obtain fault recurrence relations from regional earthquake recurrence relations. The maximum magnitude associated with fault can be determined either from the observed maximum earthquake in a nearby area from the earthquake catalogue data or can be calculated through empirical correlations between key fault parameters (fault rupture length, fault displacement and fault area) and magnitude. The available relationships given by different researchers, such as Bonilla et al. (1984), Nowroozi (1985), Slemmons et al. (1989), and Wells and Coppersmith (1994) have been used for the present study in order to decide the maximum magnitude for particular fault. These parameters are finally combined with seven Ground Motion AttenuaNat. Hazards Earth Syst. Sci., 12, 2019–2037, 2012
The Kachchh basin is a western margin pericratonic rift basin of India (Biswas 1987, 2005). The Kachchh region is considered to be bound between the two extensional faults, namely the south-dipping Nagar Parkar Fault (along the Pakistan border) in the North and the north-dipping Kathiawar Fault in the South (Rastogi, 2004). Several researchers has described the seismotectonic of Kachchh mainly, Biswas and Deshpande (1970), Biswas (1987, 2005), Sukhtankar et al. (1993), Malik et al. (1999), Rastogi et al. (2001), Thakur and Wesnousky (2002), Bodin and Horton (2004), Mandal et al. (2008), Chopra et al. (2010). The Kachchh region has a history of active seismicity with several large damaging earthquakes in the magnitude of 6 to 7 ranging over the last several hundred years (Quittmeyer and Jacob, 1979, Rajendran and Rajendran, 2001). The occurrence of the Mw = 7.6 Bhuj 2001earthquake less than two centuries after the M ≥ 7.8 Allah Bund 1819 earthquake has been considered by some investigators to represent a short recurrence interval for earthquakes in Peninsular India. The seismic moments for the past earthquakes yield a strain of 10−6 , www.nat-hazards-earth-syst-sci.net/12/2019/2012/
J. Shukla and D. Choudhury: Estimation of seismic ground motions using deterministic
2021
Fig. 1. Geographical location of the Gujarat region in India (highlighed in inset) and seismic zonation map for the Gujarat region (cities under consideration in present study highlighted by red enclosed region). (Ref figure from ISR web site-www.isr.gujarat.gov.in, last accessed on 10 October 2010.)
consistent with the return period of 180 yr in the region or 800 yr on individual faults (Rajendran et al., 2001; Rajendran and Rajendran, 2001). The major faults of the Kutch region are trending E–W that include Allah Bund Fault, Island Belt Fault, Kutch Mainland fault (KMF) and Katrol Hill fault. The north- dipping Allah Bund fault was associated with the 1819 earthquake. The Island Belt Fault, along which there are situated several uplifts seen as islands in the Great Rann of Kutch, is associated with some magnitude 5 earthquakes. The KMF extending for 125 km is a reverse fault and has a structural displacement of 2–3 km. The 2001 earthquake occurred along a hidden fault named the North Wagad fault (Rastogi, 2001), situated about 25 km north of KMF and alongside which the Banni Plains area is inferred to be uplifting. Petersen et al. (2004) tested the sensitivity of seismic hazard to three fault source models for the Kachchh region and observed the recurrence intervals of 266–533 yr on one of these faults. Yadav et al. (2008) and Tripathi (2006) worked out a probabilistic hazard assessment for this region
www.nat-hazards-earth-syst-sci.net/12/2019/2012/
based on the earthquake recurrence modeling using various probability distributions. 3.2
Saurashtra
The Saurashtra region of Gujarat forms a vital geodynamic part of the western continental margin of India. Several places in the Saurashtra region, for example, Junagadh, Dwarka, Rajkot, Paliyad, Ghogha and Bhavnagar have a history of recurring earthquake activity (Figs. 2 and 3) (Bhattacharya et al., 2004; ISR report 08-09). Apart from various studies on a regional scale, some researchers have attempted to look into the local structure and tectonics. Karanth and Sant (1995) gave a detailed account of post-trappean intrusive of plugs and dykes swarms as well as faults and other lineaments in the region. In the North of Bhavnagar, Bhattacharya et. al., 2004, had identified an E–W trending Shihor fault which offsets the N–S trending western Cambay rift fault (Fig. 3). The region is bounded on all four sides Nat. Hazards Earth Syst. Sci., 12, 2019–2037, 2012
2022
J. Shukla and D. Choudhury: Estimation of seismic ground motions using deterministic in another region have shown considerable seismicity in the Saurashtra region (Fig. 2), (Yadav et al., 2010). One strong earthquake Mw = 5.0 occurring in 1940 in Dwarka (intensity VI) was reported by several researchers (Tandon, 1959; Chandra, 1977; Guha and Basu, 1993). The Junagadh region experienced a shock of Mw = 4.3 on 3 September 1985 and recently Yadav et al. (2010) has described the recent activities in this region. An offshore earthquake with Mw = 5.0 was also reported on 24 August 1993 near Rajula. On 3 August 2000, the region of Girnar Hills near Una experienced an earthquake of Mw = 4.3, which was strongly felt up to Jamnagar. This earthquake activity was associated with two perpendicular faults passing through the epicentral region, namely, the West Cambay and the Shihor faults (Bhattacharya et al., 2004). 3.3
Fig. 2. Epicenters of earthquakes recorded by the ISR (Institute of Seismological Research) in the year 2008. (Reference from Annual report of ISR 08-09, available online on www.isr.gujarat.gov.in).
Fig. 3. Location of past earthquakes of magnitude 4 and above. (Note: Dotted areas are dyke zones of swarms. Faults are shown by dashed lines. 1, South Saurashtra fault; 2, Rajula fault; 3, Saverkundala fault; 4, South Junagadh fault; 5, North Junagadh fault; 6, Umrethi fault; 7, Shihor fault; 8, West Cambay basin fault; 9, Eastward offsetted West Cam- bay basin fault, and 10, Camay–Dabhoi fault.) (Bhattacharya et al., 2004).
by major faults namely, the North Kathiawar Fault (NKF) to the north, the extension of the Son–Narmada fault to the south, the WNW–ESE trending West Coast fault system to the west in the Arabian Sea, and the extension of the West Cambay fault to the east (Biswas, 1987, 2005). However, according to past history, only the West Cambay fault in the East near Bhavnagar accommodates moderate seismicity in the last 200 yr, while the other faults exhibit weak earthquake activity and were inactive until the recent earthquakes Nat. Hazards Earth Syst. Sci., 12, 2019–2037, 2012
Mainland Gujarat
Mainland Gujarat has experienced moderate seismicity covering two rift zones, namely the Narmada rift zone and the Cambay rift zone (Kaila et al., 1980; Biswas, 1987). Presently, the Narmada rift zone is more active than the Cambay rift zone. A total of nine earthquakes of Mw ≥ 5.0 have occurred in this region. The important earthquakes in this region are Mount Abu (1848, Mw = 6.0; 1969, Mw = 5.5), Surat (1856, Mw = 5.7; 1871, Mw = 5.0 and 1935, Mw = 5.7), Ahmedabad (1864, Mw = 5.0), Satpura (1938, Mw = 6.0) and Bharuch (1970, Mw = 5.4) (Yadav et al., 2008). The Broach Earthquake of March 23, 1970 was one of the major intraplate earthquake associated with paleorift zones in the stable continental region of Peninsular India (Chung, 1993). The valleys of the Narmada – Son (NSL) river in India are considered as a major tectonic boundary – a geofracture dividing the Indian shield into a southern peninsular block and a northern foreland block (Biswas, 1982). The NSL has experienced more than 30 earthquakes in the magnitude range of 3.0–6.5 on the Richter scale (Gupta et al., 1997).
4
Earthquake catalogue
Various researchers have prepared the earthquake catalogue for the Indian subcontinents (Oldham, 1983; Tandon and Srivastava, 1974; Chandra, 1977; Quittmeyer and Jacob, 1979; Guha and Basu, 1993; Iyengar et al., 1999, Malik et al., 1999, Jaiswal and Sinha, 2007, Yadav et al., 2008) by considering historical and modern earthquakes. The Institute of Seismological Research-Gujarat (ISR) has prepared a compiled earthquake catalogue of the Kachchh, Saurasthra and Mainland Gujarat, bounded by 20–25.5 N and 68–75 E from the earliest times to March 2008 for all magnitude ranges and has made this available on their web portal (Ref. www.isr.gujarat.gov.in). In the present study, the earthquake catalogue of magnitude Mw ≥ 4 available on the Institute of Seismological Research’s web portal was used in order to www.nat-hazards-earth-syst-sci.net/12/2019/2012/
J. Shukla and D. Choudhury: Estimation of seismic ground motions using deterministic
2023
Table 1. Earthquakes recorded in the year 2008 in the three regions of Gujarat by GS-Net (Ref. Annual Report ISR-Gujarat, 08-09, available online www.isr.gujarat.gov.in). Region Kachchh Saurashtra Mainland Total
Fig. 4. Catalogue completeness by Cumulative Visual (CUVI) method for Gujarat by using the earthquake catalogue (Mw ≥ 4) available on ISR-Gujarat web site (www.isr.gujarat.gov.in)
find out three parameters: the activity rate, the b-value of the Gutenberg-Richter (G-R) relationship, and the observed maximum magnitude of earthquake near the fault. The catalogue was further analyzed for declustering using the static windowing technique (constant spatiotemporal window of 30 days and 30 km). After analyzing the earthquake catalogue for declustering, an earthquake catalogue spanning a time period of 1820–2008 for earthquake magnitude M ≥ 4 was prepared for use in the present study. As seismic instrumentation has been just been initialized in the Gujarat by GS-Net under the umbrella of the Institute of Seismological Research, most of the catalogue events in the prepared catalogue have been taken from historic records only. Historical earthquake records are usually more complete for larger earthquakes than for smaller ones. In the present analysis, the minimum threshold magnitude is assumed as Mw = 4, and generally events with Mw ≥ 4 may not remain unnoticed as far as historic data is concerned. Based on this argument, it is reasonable to assume that the earthquake catalogue prepared for Mw ≥ 4 is complete for its further use for preliminary seismic hazard computations. For checking the completeness correctly, a sufficient number of samples should be available at all possible magnitudes. In the present study, the availability of the data in the Gujarat region is low (after removing the clustered events only ,95 events of Mw ≥ 4 were available). However, the Cumulative Visual (CUVI) method (Tinti and Mulargia, 1985) was used to check the completeness of the catalogue with these limited data. The CUVI method is based on the visual method for assessing catalogue completeness, based on the plot of the cumulative number of events, which is very easy to apply efficiently for limited event data. Figure 4 represents the cumulative earthquake occurrence in time and space for checking the catalogue completeness. As per Fig. 4, the seismicity rate is uniform from www.nat-hazards-earth-syst-sci.net/12/2019/2012/
Mw ≥ 4
Mw (3 to 3.9)
Mw (2 to 2.9)
Mw (1 to 3.9)
Total
5 2 – 7
52 12 3 67
343 221 17 581
493 424 26 943
893 659 46 1598
1820 to 1960 but from 1961 to 2008, the seismicity rate increased. However, the seismicity rate for larger earthquakes in the present study is assumed to be uniform and catalogue is assumed to be complete during the period 1820 to 2008. This is also justified for historic earthquakes where the recorded seismicity differs from the true seismicity. Furthermore, historic earthquake records are usually more complete for larger earthquakes than for smaller ones, which further suggests that the catalogue can be assumed to be complete for Mw ≥ 4. The earthquake activities are significant in Gujarat for the recent years and these may be attributed to recent activity along Bhavnagar swarms (2000), Bhuj Earthquake sequence (2001–2008), Jamnagar swarms (2006–2008) and Talala earthquakes (2006–2010) (Table 1). After 2001, seismicity has occurred at several new places in the Saurashtra region, specially in Jamnagar, Surendranagar, and the Talala area of Junagadh which has remained stable within the Saurashtra region. In the present study, five cities were selected as the target and considering the city as centre, a control region with a radius of 250 km around the city is taken into account for further seismic hazard computations. From the seismotectonic study and published literature, a possible fault map of this entire Gujarat region has been prepared. Since earthquakes occurring at epicentral distances (i.e. distance between the city and epicenter of earthquake) greater than 250 km do not generally cause structural damage, the faults located at a maximum distance of 250 km from a particular site have been not considered as the tectonic features in the present study. A total of 40 major faults, along with major earthquake events which influence seismic hazard at Gujarat, habe been considered in the present study (Fig. 5). A list of these faults is given in Table 2, describing the length of the faults and the controlling region assigned to them for seismic hazard computations.
5
Maximum magnitude determination
Once the seismic sources were determined for an area considered for seismic hazard modeling, the next step was the determination of the maximum earthquake magnitude for Nat. Hazards Earth Syst. Sci., 12, 2019–2037, 2012
2024
J. Shukla and D. Choudhury: Estimation of seismic ground motions using deterministic
Table 2. Fault characteristics, weighting functions and maximum magnitude for faults used in Seismic Hazard Calculations. Sr. No.
Name of fault
Length in km
αi
xi
N i (m)0
β
Rupture Length = L/3
Bonilla (1984)
Nowroozi (1984)
Slemmons (1982)
W&C (1994)
Max magnitude
Controlling region
1 2 3 4 5 6 7 8 9
F18 F15 F12 F13 F25 F14 F19 F17 F21
137.34 26.77 126.36 69.07 59.55 156.56 131.38 160.76 40.87
0.151 0.029 0.139 0.076 0.066 0.172 0.145 0.177 0.045
0.217 0.022 0.087 0.022 0.022 0.217 0.130 0.152 0.130
0.063 0.009 0.039 0.017 0.015 0.066 0.047 0.056 0.030
0.960 0.960 0.960 0.960 0.960 0.960 0.960 0.960 0.960
45.78 8.92 42.12 23.02 19.85 52.19 43.79 53.59 13.62
7.76 7.26 7.74 7.55 7.51 7.80 7.75 7.81 7.39
7.06 6.17 7.01 6.69 6.61 7.13 7.03 7.14 6.40
7.03 6.23 6.99 6.70 6.62 7.09 7.01 7.11 6.44
7.01 6.18 6.96 6.66 6.59 7.07 6.98 7.09 6.40
7.01 6.17 6.96 6.66 6.59 7.07 6.98 7.09 6.40
Kachcha Kachcha Kachcha Kachcha Kachcha Kachcha Kachcha Kachcha Kachcha
10 11 12 13 14 15 16 17 18 19 20 21 22 23 24 25 26
F31 F23 F24 F33 F34 F32 F35 F41 F37 F38 F46 F43 F26 F48 F49 F45 F42
42.32 128.57 157.30 252.93 287.60 37.35 175.32 27.61 96.48 59.15 104.27 41.82 59.37 60.41 46.27 25.21 37.51
0.025 0.077 0.094 0.151 0.171 0.022 0.104 0.016 0.057 0.035 0.062 0.025 0.035 0.036 0.028 0.015 0.022
0.063 0.031 0.125 0.031 0.125 0.031 0.063 0.031 0.031 0.031 0.063 0.031 0.063 0.031 0.031 0.125 0.063
0.010 0.013 0.026 0.021 0.035 0.006 0.020 0.006 0.010 0.008 0.015 0.007 0.012 0.008 0.007 0.017 0.010
1.431 1.431 1.431 1.431 1.431 1.431 1.431 1.431 1.431 1.431 1.431 1.431 1.431 1.431 1.431 1.431 1.431
14.11 42.86 52.43 84.31 95.87 12.45 58.44 9.20 32.16 19.72 34.76 13.94 19.79 20.14 15.42 8.40 12.50
7.40 7.74 7.80 7.95 7.99 7.37 7.84 7.27 7.65 7.51 7.68 7.40 7.51 7.51 7.43 7.25 7.37
6.42 7.02 7.13 7.39 7.46 6.35 7.19 6.19 6.87 6.60 6.91 6.41 6.60 6.61 6.47 6.14 6.36
6.46 7.00 7.10 7.33 7.39 6.40 7.15 6.25 6.86 6.62 6.90 6.45 6.62 6.63 6.50 6.21 6.40
6.41 6.97 7.07 7.31 7.38 6.35 7.13 6.20 6.83 6.58 6.87 6.41 6.58 6.59 6.46 6.15 6.35
6.41 6.97 7.07 7.31 7.38 6.35 7.13 6.19 6.83 6.58 6.87 6.41 6.58 6.59 6.46 6.14 6.35
Mainland Mainland Mainland Mainland Mainland Mainland Mainland Mainland Mainland Mainland Mainland Mainland Mainland Mainland Mainland Mainland Mainland
27 28 29 30 31 32 33 34 35 36 37 38 39 40
F2 F10 F7 F8 F9 F28 F30 F5 F11 F1 F3 F29 F4 F6
201.45 218.77 138.75 142.65 154.00 23.19 15.58 287.42 169.44 58.52 118.89 54.22 92.34 56.39
0.116 0.126 0.080 0.082 0.089 0.013 0.009 0.166 0.098 0.034 0.069 0.031 0.053 0.033
0.087 0.043 0.043 0.087 0.043 0.174 0.087 0.043 0.087 0.043 0.087 0.087 0.043 0.043
0.016 0.013 0.009 0.013 0.010 0.014 0.007 0.016 0.014 0.006 0.012 0.009 0.007 0.006
1.478 1.478 1.478 1.478 1.478 1.478 1.478 1.478 1.478 1.478 1.478 1.478 1.478 1.478
67.15 72.92 46.25 47.55 51.33 7.73 5.19 95.81 56.48 19.51 39.63 18.07 30.78 18.80
7.88 7.90 7.76 7.77 7.80 7.22 7.10 7.99 7.83 7.50 7.72 7.48 7.64 7.49
7.26 7.31 7.06 7.08 7.12 6.10 5.88 7.46 7.17 6.60 6.98 6.55 6.84 6.58
7.22 7.26 7.03 7.05 7.09 6.16 5.97 7.39 7.13 6.62 6.96 6.58 6.84 6.60
7.20 7.24 7.01 7.03 7.06 6.11 5.91 7.38 7.11 6.58 6.93 6.54 6.81 6.56
7.20 7.24 7.01 7.03 7.06 6.10 5.88 7.38 7.11 6.58 6.93 6.54 6.81 6.56
Saurashtra Saurashtra Saurashtra Saurashtra Saurashtra Saurashtra Saurashtra Saurashtra Saurashtra Saurashtra Saurashtra Saurashtra Saurashtra Saurashtra
Abbreviation: Wells and Coppersmith (1994) – W&C (1994).
each seismic zone. In this regard, there are two alternatives to choose from. One is the maximum historical earthquake procedure. In the standard rule-of-thumb practice, the maximum historical earthquake is increased by half a magnitude unit or, through a recurrence relationship, is taken to yield the maximum magnitude (Nuttli, 1979). Nevertheless, this alternative is not applicable to all seismic source zones determined in this study for the reasons: (a) all the faults mapped or determined as “active” in present study did not show any predominant activity during the past history; (b) those showing the seismic activity are very poorly known and far away from providing a reliable maximum magnitude earthquake determination because of uncertainties attributed to both instrumental and historical records; (c) the accurate amount of Nat. Hazards Earth Syst. Sci., 12, 2019–2037, 2012
slip and slip rate or the fault rupture could not be obtained due to lack of historic instrumentations. The second methodology for the determination of maximum magnitude earthquake for a seismic source zone is from the empirical correlations between key fault parameters (Fault Rupture length, fault displacement and fault area). In this regard, the most common feature is the fault rupture length and it is presently used in the determination of maximum magnitude associated with a particular fault. There are different opinions on the rupture length of faults to yield the maximum magnitude earthquake. The general assumption based on worldwide data, is that 1/3 to 1/2 of the total length of the fault may rupture (Mark, 1977). The maximum magnitude is calculated using 1/3 of the total fault length as www.nat-hazards-earth-syst-sci.net/12/2019/2012/
J. Shukla and D. Choudhury: Estimation of seismic ground motions using deterministic
Fig. 5. The Fault map used in the present study.
2025
b-value reported by various researchers for peninsular India and the Gujarat region. It is very difficult to achieve agreement on one single value for the study. Tectonic earthquakes are characterized by the b-value from 0.5 to 1.5 and are more frequently around 1.0. In the present study, earthquakes less than Mw = 4 are not included. Eliminating the big class of the small earthquakes while fitting the Gutenberg-Richter (G-R) line may tend to flatten the line. As a result, the actual mean rate of small earthquakes will be underestimated and the mean rate of large earthquakes will be overestimated. A lower b-value for Kachchh region may be due to the predominance of a few big earthquakes in the region and a higher b-value for other region may be due to lack of significant numbers of big earthquakes. The uncertainty in the b-value is dealt with in the present study using the logic tree approach with the selection of corresponding b-value and its weightage. In the present analysis, two b-values are selected, i.e. one corresponds to the study area obtained using the present study and the second one using the regional b-value as reported by Jaiswal and Sinha (2007). Furthermore, the occurrence of an earthquake in a seismic source is assumed to follow a Poisson’s distribution. The probability of the ground motion parameter (horizontal component of peak ground acceleration in present study) at a given site, Z to exceed a specified level, z, during a specified time, T , is represented by the expression: P (Z > z) = 1 − e−v(z)T ≤ v(z)T
Fig. 6. Gutenberg-Richter frequency magnitude recurrence relationship for Kachchh, Saurashtra, Mainland regions and the entire region of Gujarat.
rupture length and using the relationship given by Bonilla et al. (1984), Nowroozi (1985), Slemmons et al. (1989) and Wells and Coppersmith (1984); the results are presented in Table 2. The minimum out of the estimated maximum magnitude is finally assigned to the particular fault as the maximum magnitude for seismic hazard calculations. 6
Recurrence relations
Using the prepared earthquake catalogue, the estimated Gutenberg-Richter (G-R) magnitude-frequency recurrence relationship for the three study areas is plotted in Fig. 6. In comparison to other studies on the seismic hazard for the Indian Peninsular shield (Table 3), the estimated b-value is low in the present study. There are large variations in the www.nat-hazards-earth-syst-sci.net/12/2019/2012/
(1)
Where, v(z) is the mean annual rate of exceedance of ground motion parameter, Z with respect to z. Assuming that the Ni (m0 ) is the frequency of an earthquake on seismic source i, having a magnitude higher than a minimum magnitude of m0 (in present study it is taken as 4.0). The recurrence relation for each seismic source capable of producing an earthquake magnitude in the range of m0 (minimum magnitude) to mmax (maximum magnitude assigned) was calculated using the truncated exponential recurrence model (McGuire and Arabaz, 1990), given by the following expression −β(m−m )
−β(mmax −m0 )
0 −e N (m0 ) = e 1−e−β(mmax −m0 ) f orm0 ≤ m ≤ mmax
π
(2)
Where β= Log10 (b-value) (b-value is Gutenberg–Ritcher parameter, see Table 3). 6.1
Fault recurrence relations
The recurrence relation derived above (Eq. 2) is valid for the entire region and is not specific to any particular faults assumed in the study. Fault-level recurrence is necessary to discriminate nearby sources from far-off sources and to differentiate the activity rate among faults. In Gujarat, fault studies are not available presently and historical data are not sufficient to establish fault recurrence relations. In addition, PI (Peninsular India) earthquakes are associated with poor Nat. Hazards Earth Syst. Sci., 12, 2019–2037, 2012
2026
J. Shukla and D. Choudhury: Estimation of seismic ground motions using deterministic
Table 3. Comparison of b-value for the Gujarat region to values reported by various researchers. Study number
Application area
1 2 3 4 5 6 7 8 9 10 11 12 13 14
b-value
Reference
Periods for study taken
Kachchh Saurashtra Mainland Entire Gujarat
0.417 0.64 0.62 0.51
Present study
(1820–2008) (1872–2008) (1872–2008) (1820–2008)
Kachchh Gujarat Peninsular India (PI)
0.43 0.72 0.47
Ashara et al. (2006) Tripathi et al. (2005) Gupta & Rastogi (1976)
– – –
0.81 0.7 0.85 0.92 0.86 1.13 0.86
Avadh Ram and Rathor (1970) Kaila et al. (1972) Rao and Rao (1984) Jaiswal and Sinha (2007) Raghu Kanth and Iyengar (2006) Menon et al. (2010) Anbazhagan et al. (2009)
70 yr (1954–1967) (1800–1983) (1842–2002) (1802–2002) (1507–2008) (1800–2004)
Mumbai Southern PI Bangalore
Note: PI – Peninsular India
surface expression of faults and hence, reliable estimation of slip rates in order to model earthquake recurrence alternatively has also not been possible. In such situations, the bvalue to the particular fault is empirically fixed considering the conservation of seismic activity in that particular region. Followed by Iyengar and Ghosh (2004), Raghu Kanth and Iyengar (2006), Anbazhagan et al. (2009) and Vipin et al. (2009), the regional recurrence relations are scaled down to fault recurrence relations by introducing a weighting factor as given below: Ni (m0 ) = Fi (m0 )π e f orm0 ≤ m ≤ mmax
−β(m−m0 ) −e−β(mmax −m0 ) 1−e−β(mmax −m0 )
(3)
In which Fi (m0 ) is the weighting factor as given below: Fi (m0 ) = 0.5(αi + xi )
(4)
Where αi and xi are the weighting factors for length and earthquake event, respectively, which are given as below. Considering the fact that a longer fault can produce a greater number of small events of magnitude m0 than a shorter fault, fault recurrence may be taken as being proportional to the length of the fault, leading to a simple weight factor αi as given below: Li αi = 6Li
(5)
Where Li is the length of the fault i and 6Li is the total fault length within the region under consideration. Further, the regional seismicity measured in terms of the number of earthquakes per year with m ≥ m0 , should be equal to the sum of such events the sum of such events occurring on individual faults for particular area under consideration. It is also Nat. Hazards Earth Syst. Sci., 12, 2019–2037, 2012
obvious that future activity will continue at seismic sources, at least in the short run, similar to past activity. Hence, irrespective of its length, seismic activity of a fault should be related to the number of past events associated with it in the catalogue and it is given by xi =
Number of earthquakes close to the fault Total number of earthquakes in the region
(6)
Since the Gujarat region is divided into three control regions, it would be appropriate to use the control region specific bvalue for individual faults. The above argument provides a basis for decomposing the regional hazard into fault recurrence relations. The weight factors and obtained fault recurrence relation Ni (m0 ) are presented in Table 2. Based on the calculated parameters from Table 2, Fig. 6 and above discussion, the fault recurrence relations using b-value calculated in present study and b-value reported by Jaiswal and Sinha (2007), are calculated and graphically presented in Fig. 7.
7
Ground Motion Attenuation Relations (GMARs)
Once the maximum magnitudes that each fault zone can generate are determined through the empirical relationship (Table 2), the next step is the selection of appropriate Ground Motion Attenuation Relation (GMAR) to estimate ground motion parameters at site. Raghu Kanth and Iyengar (2007) proposed an empirical GMAR for Peninsular India based on the stochastic seismological model and its comparison with instrumented data from the Koyna (1967) and Bhuj (2001) earthquakes. In order to try different forms of attenuation www.nat-hazards-earth-syst-sci.net/12/2019/2012/
12
2
3 3 4 45
5 6 6 7 7
(a) using region speific b-value
2027
F11 F12 F13 F15 F14 F17 F1 F18 F10 F19 F11 F2 F12 F21 F13 F15 F23 F24 F14 F17 F25A F26 F18 F19 F28 F29 F2 F21 F3 F30 F23 F24 F31 F26 F32 F25A F28 F33 F29 F34 F3 F35 F30 F37 F31 F38 F32 F4 F33 F41 F34 F42 F35 F43 F37 F45 F38 F46 F4 F48 F41 F49F42 F43 F45 F46 F48 F49
sidering the following controlling parameters: (1) assigning region specific the b-value based on the present study and based on reported by researchers, (2) the maximum cut0.01 off magnitude in hazard computations, and (3) the GMARs. Within the hazard analysis, assigned b-value maximum cut1E-3 off magnitudes and GMARs have been assigned different weights, which are presented in logic tree form in Fig. 8. 1E-3 The b-value assigned in hazard computation is selected 1E-4 based on the present study and the value reported by Jaiswal and Sinha (2007) with equal weightage. Owing to the recent 1E-4 study made and the time period used in the study carried out, 1E-5 b-value = 0.92 given by Jaiswal and Sinha (2007) has been 4 5 6 7 8 9 10 selected for the hazard computations. There are significant Magnitude (Mw) 1E-5 4 5 6 7 8 9 10 variations in reported b-value (Table 3) and it is very difficult Magnitude (Mw) to assign different weightage for one over the other. Hence, equal weightage has been assigned to both the hazard com0.1 putation framework, i.e. b-value calculated in present study (b) comparison with using b-value 0.92 0.1 reported by Jaiswal and Sinha (2007) and b-value = 0.92. It may be noted that the variation in b(b) comparison with using b-value 0.92 value obtained in the present study based on the study area reported by Jaiswal and Sinha (2007) 0.01 of the Gujarat region only is due to the difference in study 0.01 area as b-value reported by Jaiswal and Sinha (2007) was for the whole of Peninsular India. 1E-3 In the present study, the maximum cutoff magnitude is calculated based on empirical correlation using key fault param1E-3 eters (Fault length). As an alternative, each fault is assigned as the observed magnitude based on the past historic event 1E-4 F4 ( region specific b-value, Present Study) F34 (region specific b-value, Present Study) within the nearby area. Equal weights have been assigned 1E-4 F4F14 ( region specific b-value, Present Study) (region specific b-value, Present Study) F34 Present Study) F4(region (using specific b=0.92, b-value, Jaiswal and Sinha (2007)) to the two different maximum magnitudes, as there is clearly F14 Study) F34(region (usingspecific b=0.92,b-value, Jaiswal Present and Sinha (2007)) no ground for choosing one alternative over the other. This F4F14 (using b=0.92, Jaiswal andand Sinha (2007)) (using b=0.92, Jaiswal Sinha (2007)) 1E-5 F34 (using b=0.92, Jaiswal and Sinha (2007)) is also in agreement that the present study is based on the 4 6 7 F14 (using b=0.92, Jaiswal and5Sinha (2007)) 1E-5 fault map prepared, from which some of the faults may not 4 5 Magnitude (Mw) 6 7 Deleted: level Magnitude (Mw) be active and the maximum observed magnitude may give a Figure 7. Fault recurrence relations (a) using b-value calculated in present study (b) Deleted: level reasonable idea about the current seismic activity in the reFig. 7. Fault recurrence relations (a) using b-value calculated in Fault recurrence relations (a) using b-value and calculated (2007) in present studyselected (b) Figure 7. with comparison 0.92 reported Jaiswal forby some present using study b-value (b) comparison withbyusing b-valueSinha 0.92 reported gion. comparison with using b-value 0.92 reported by Jaiswal and Sinha (2007) for some selected faults. Jaiswal and Sinha (2007) for some selected faults. In order to compute the maximum horizontal ground acfaults. celeration for a given point assuming a hard rock site, various GMARs have been selected as shown in Fig. 8. Raghu relationships, several other approaches were also employed Kanth to have a chance for comparison. For shallow crustal earth41 and Iyengar (2004, 2007) have studied the attenuation 41 of PGA and Spectral acceleration in Peninsular India quakes, GMAR proposed by Abrahamson and Silva (1997) from the considerations of engineering seismology and obis applicable and used in the present study. The comparison tained the coefficients for attenuation equations from extenmade by Petersen et al. (2004) has revealed that the crustal sive seismological modeling and simulation. As this domesintraplate relation of Frankel et al. (1996) yields ground motic GMAR given by Raghu Kanth and Iyengar (2007), is retions similar to the strong ground motion data recorded from lated specifically to Peninsular India, slightly higher weight the 2001 earthquake at large distances (Cramer and Wheeler, (0.2) is assigned to it compared to other imported GMARs. 2001). In the present study, we have also included the crustal However, it is notable that this relation is only valid for intraplate GMARs given by Toro et al. (1997) and Frankel bedrock sites with a shear wave velocity of 3.6 km s. Other et al. (1996). The equations by Boore-Joyner-Fumal (1997), GMARs used are for comparison and owing to the fact that Campbell (1997) and Sadigh et al. (1997) representing the it is difficult to assign a higher weight to one equation over GMAR were also selected for comparison. the other, equal weights (0.133) have been chosen for all imported GMARs. To avoid confusion associated with different magnitude scales, all magnitudes have been assumed to be 8 Uncertainty in Seismic Hazard moment magnitude Mw in entire study. Epistemic uncertainties in the hazard computations have been accounted for within a logic-tree framework by conAnnualAnnual Rate ofRate Events Mw=4> Mw=4 of > Events
0.01
(a) using region speific b-value
Annual Rate of Events > Mw=4 Annual Rate of Events > Mw=4
1
J. Shukla and D. Choudhury: Estimation of seismic ground motions using deterministic F1 F10
www.nat-hazards-earth-syst-sci.net/12/2019/2012/
Nat. Hazards Earth Syst. Sci., 12, 2019–2037, 2012
2028
J. Shukla and D. Choudhury: Estimation of seismic ground motions using deterministic
Fig. 8. Logic Tree used in seismic hazard computations (figures in the bracket show the weightage assigned in seismic hazard computations) (Abbreviations: Raghu Kanth and Iyengar (2007) – RI07, Abrahamson and Silva (1997)– AS97, Frankel (1996) – F96, Toro et al. (1997) – T97, Boore-Joyner and Fumel (1997) – BJF97, Campbell (1997) – C97, Sadigh et al. (1997)– S97).
9
Deterministic seismic hazard computation
Seismic hazard analysis has been carried out using a deterministic approach. In the present deterministic hazard calculation, the seismic activity of seismic sources (fault sources) is specified by a recurrence relationship calculated, defining the cumulative number of events per year versus their magnitude. The distribution of earthquakes is assumed to be uniform within the source zone and independent of time (Cornell, 1968). Each Fault source is characterized by the seismicity parameters in terms of minimum and maximum magnitude and G-R earthquake recurrence rates as calculated in previous sections. Deterministic seismic hazard assessments carried out to identify maximum credible earthquake (MCE) and safe shutdown earthquake (SSE) that will affect a site. The shortest distance from vulnerable sources identified (Table 2) for the cities under consideration has been measured from the seismotectonic map. With these distances, maximum moment magnitude assigned and uncertainty as per the logic tree, using GMARs, the horizontal component of peak ground acceleration has been calculated at bed rock level by assuming a focal depth of the earthquake of about 10 km from the surface.
Nat. Hazards Earth Syst. Sci., 12, 2019–2037, 2012
Assuming the maximum credible earthquake (MCE) is the earthquake which imposes the most severe kind of loading the structure ever likely experience (design life of structure i.e. 50 yr), the probability of this level of earthquake at the site is low. The deterministic analysis pertaining to the 50th percentile ground motion is thought to represent MCE in the present study. The Safe Shutdown Earthquake, on the other hand, is thought to represent the severest earthquake in terms of magnitude at the site. An earthquake of this magnitude may not have occurred in the past, but this value is arrived at after investigation of past earthquakes, local geology (fault structure, distance from the fault etc.), and local underlying soil characteristics. The 84th percentile deterministic ground motion calculated represents the SSE in the present study.
10 10.1
Results and discussions Deterministic scenarios and hazard computations
Seed (1982) defined Maximum Credible Earthquake (MCE) as the largest conceivable event that could occur in the tectonic environment in which the site is located. Krinitzsky (2002) has pointed out that although Maximum www.nat-hazards-earth-syst-sci.net/12/2019/2012/
J. Shukla and D. Choudhury: Estimation of seismic ground motions using deterministic 10
Spectral Response @ 5% Damping - Average Horizontal Component
Total Hazard F12 F13 F14 F17 F18 F19 F21 F23 F24 F26 F28 F31 F32 F33 F34 F35 F49 All Other Sources
Annual Frequency of Exceedence
1 0.1 0.01 1E-3 1E-4 1E-5 1E-6 1E-7 1E-8 1E-9 1E-10 1E-11 1E-12 1E-13 1E-4
Period = PGA
1E-3
1
0.01
0.1
1
10
Peak Ground Acceleration (g)
100
2 3 4
Figure9.9. Total for Ahmedabad from contribution of fault sources. Fig. Totalhazard hazard for the city cityobtained of Ahmedabad obtained from the contribution of fault sources.
5 1 6
1
7
9 10 11 12 13
Annual Frequency of Exceedence
8
Period = PGA, Ahmedabad
0.1 0.01 1E-3 1E-4 1E-5 1E-6 1E-7 1E-8 1E-9 1E-10 1E-11 1E-12 1E-13
Total of mean hazard for each source Sources using Abra.-Silva (1997) Rock Sources using Boore-Joyner-Fumal (1997) Sources using Campbell (1997) Sources using Sadigh (1997) Rock Sources using Frankel (1996) Sources using Toro (1997) Sources using Raghu Kanth & Iyengar (2007)
1E-3 2
0.01
0.1
Peak Ground Acceleration (g)
43
1
10
3 4 5
Fig. 10. Comparison of ground motion attenuation relations Figure 10. Comparison of ground motion attenuation relations (GMARs) computed using (GMARs) computed using various models for total hazard for the various models for total hazard for Ahmedabad city city of Ahmedabad.
6 7 8 9 10 11 12 13 14
Credible Earthquake (MCE) is the largest earthquake that can be reasonably expected to occur with in the design life of a structure (based on geological evidence and earthquake history), this does not necessarily imply that it would also be the worst. The maximum earthquake magnitude calculated and assigned earthquake to the faults as observed in the past history are also mentioned in Table 1. From Table 4 it is easy to pick the MCE and SSE for each site considering the nearest fault producing the largest ground motions.44 From the deterministic analysis it is found that for the cities of Surat, Ahmedabad, Bhuj, Jamnagar and Junagadh, fault numbers F34, F24, F12, F5 and F7 are the controlling faults, www.nat-hazards-earth-syst-sci.net/12/2019/2012/
2029
respectively, owing to the shortest distance criteria. However in practice, structures are designed for ground motions, not earthquakes, so obtained deterministic scenario earthquakes should be obtained in the form of worst-case ground motion and not just a maximum magnitude-distance pair. In order to estimate reliable ground motions, a probabilistic framework is further used to compute the hazard contribution exceeding a certain level offered by each fault due to all possible future activities on the faults as visualized by the typical hazard scenario presented for Ahmedabad city in Fig. 9. From Fig. 9, it is clear that hazard contributions from fault numbers F26, F24 and F13 are maximum compared to the other faults for Ahmedabad city. In order to compare all the GMARs used in estimating the ground motions at site, a typical comparison for the city of Ahmedabad is presented in Fig. 10. From Fig. 10 it can be observed that the GMAR given by Campbell (1997) gives the highest hazard for Ahmedabad compared to all other GMARs used. However, all the GMARs are comparable and no significant variations in the estimated hazard have been observed as shown in Fig. 10. The total hazard obtained from all the sources for a particular site is typically presented in Fig. 11. It is quite clear that out of the five cities studied, Bhuj has the highest hazard compared to all the others. Surat has higher hazard compared to Ahmedabad, being very close to the Narmada Son Lineaments. Although the hazard for the cities of Jamnagar and Junagadh are more or less the same, Jamnagar city has the lowest seismic hazard compared to all other cities. The finally-computed deterministic seismic scenarios for the cities are presented in terms of magnitude and distance pairs in Table 5. It is notable that these deterministic scenarios are not fact or do not belong to any particular fault, but ground motion computed using these scenarios can produce the same level of ground motion which can be expected at a given site. 10.2
Development of deterministic hazard spectra
As expressed earlier, in practice design engineers are generally more interested in specifying the ground motions in terms of PGA or in terms of spectra as specified by provisions made by code. In deterministic analysis for a given probability of exceedance, the probability distribution for the hazard value can be determined from which the specified fractiles (usually 50th percentile i.e. median and 84th percentile) are computed. However, the deterministic ground motions should not just be called the median and 84th percentile ground motions but rather they should be called the ground motions with 50 % chance and 84 % chance of not being exceeded for the design earthquake (the 84th percentile deterministic ground motion has a 16 % chance of being exceeded if the scenario earthquake occurs). In the present analysis, 50th percentile (representing MCE) and 84th percentile (representing SSE) deterministic spectra for spectral response for 5 % damping at the bed rock level, have been developed varying b-value as given in logic tree. The 5 % Nat. Hazards Earth Syst. Sci., 12, 2019–2037, 2012
2030
J. Shukla and D. Choudhury: Estimation of seismic ground motions using deterministic
Table 4. Deterministic scenarios for various cities under consideration in the present study. Name of fault
Maximum Magnitude (Calculated)
Maximum Magnitude (Observed)
Surat City
Ahmedabad City
Bhuj City
Jamnagar City
Junagadh City
Hypocentral Distance (km), h =10 km F1 F10 F11 F12 F13 F14 F15 F17 F18 F19 F2 F21 F23 F24 F25A F26 F28 F29 F3 F30 F31 F32 F33 F34 F35 F37 F38 F4 F41 F42 F43 F45 F46 F48 F49 F5 F6 F7 F8 F9
6.58 7.24 7.11 6.96 6.66 7.07 6.17 7.09 7.01 6.98 7.2 6.4 6.97 7.07 6.59 6.58 6.1 6.54 6.93 5.88 6.41 6.35 7.31 7.38 7.13 6.83 6.58 6.81 6.19 6.35 6.41 6.14 6.87 6.59 6.46 7.38 6.56 7.01 7.03 7.06
5.5 5.5 5 6.66 6.96 7.07 6.17 7.09 7.01 6.98 5.5 6.4 5.5 5.5 6.59 5.5 6 5.5 5.5 5.5 5.5 5.5 5.7 5.7 5.5 5.5 5.5 5.5 5.5 5.5 5.5 5.5 5.5 5.5 5.5 5 5.5 5.5 5 5
315.63 93.67 118.57 357.46 336.68 342.65 407.04 359.46 416.47 450.28 248.25 328.27 142.3 81.57 336.68 149.1 125.43 101.47 227.14 77.37 118.08 84.22 61.57 11.59 72.36 39.99 118.57 235.63 221.3 189.26 47.87 73.4 128.97 340.68 286.96 280.64 188.44 120.31 92.55 64.74
damping is specifically selected to compare the results of the present study with the provisions made in IS:1893- Part I (2002). The comparison of the obtained spectra for bvalue obtained from the present study and b-value reported by Jaiswal and Sinha (2007), are presented in Fig. 12. The comparisons confirm that the higher ground motions are produced for the b-value = 0.92 whereas spectra corresponds to the b-value from the present study gives comparatively lesser ground motions. The difference is very less for Bhuj city and Nat. Hazards Earth Syst. Sci., 12, 2019–2037, 2012
381.32 238.18 279.47 249.08 245.07 225.42 286.03 189.8 264.78 286.78 337 184.95 63.02 14.11 245.07 22.42 96.05 138.83 306.38 142.09 91.33 93.7 145.22 213.35 157.9 235.66 262.32 236.49 249.15 296.67 232.04 282.56 330.03 145.66 85.79 115.91 212.61 200.5 203.69 210.5
231.23 231.23 320.36 6.22 35.56 23.37 45.51 86.8 98.43 137 144.18 73.96 206.85 279.7 35.56 270.99 219.95 242.29 153.06 275.58 284.48 321.18 340.64 369.19 380.96 409.59 487.65 162.32 522.38 544.85 364.41 439.96 504.45 196.41 223.6 49.68 203.94 206.86 271.84 298.37
169.01 225.62 239.02 84.05 48.23 89.93 126.3 164 173.81 216.08 110.97 115.21 198.34 274.83 48.23 228.35 177.66 176.47 88.82 214.54 235.29 274.8 282.66 296.41 326.48 338.23 427.58 79.07 480.08 489.96 292.05 367.59 432.64 222.02 227.49 33.97 120.55 123.33 188.16 214.71
107.63 231.23 133.93 191.24 158.72 194.18 236.5 267.69 280.67 322.31 62.91 213.84 195.09 272.97 158.72 217.82 160.79 131.87 32.75 170.89 212.1 250.49 236 216.51 282.18 259.25 366.92 31.15 447.11 436 213.45 285.13 349.31 294.46 278.52 143.98 15.52 13.6 77.68 104.4
observed to be highest for Ahmedabad city compared to all other cities studied. A significant difference is observed in the PGA value obtained by both the b-value approach. The calculated ground motions in terms of the horizontal component for spectral response at 5 % damping for the few periods are tabulated in Table 6. The cities of Junagadh and Jamnagar belong to the same tectonic control region, i.e. Saurashtra but the expected seismic ground motion for both of them is different, i.e. for www.nat-hazards-earth-syst-sci.net/12/2019/2012/
J. Shukla and D. Choudhury: Estimation of seismic ground motions using deterministic
2031
1
1
Spectral response @ 5% dampingaverage horizontal component
Annual Frequency of Exceedence
0.1 0.01 1E-3 1E-4 1E-5 1E-6 1E-7 1E-4 2
Ahmedabad Surat Bhuj Jamnagar Junagadh
1E-3
0.01
0.1
Peak Ground Acceleration (g)
1
10
3 4
Fig. 11. Total Hazard calculated for various cities at zero spectral period i.e. PGA.
Figure 11. Total Hazard calculated for various cities at zero spectral period i.e. PGA
5 6 7 8 9 10 11 12 13 14
Junagadh being higher than Jamnagar. This is also consistent with recent activities as described by Yadav et al. (2010) in the Talala region very close to Junagadh. In the same way, Surat and Ahmedabad cities are sharing same tectonic control region as per the present study, but the calculated PGA for Surat city is slightly higher than for Ahmedabad. This is possibly due to the proximity of Surat city to the Narmada Son lineaments, considered to be a controlling fault for the city of Surat. It is interesting to note that for the Bhuj region, the estimated PGA are in order of 0.64 to 1.04 g corresponding to45 b-value studied. Parvez et al. (2003) and Hough et al. (2002) has predicted near field ground motion of approximately 0.8 g for the Kachchh areas for the Bhuj 2001 earthquake which compared well with our present results. During the recent excavations at Bet Dwarka, in the Gulf of Kachchh, Rajendran et al. (2003) identified a seismically generated sand blow that has disrupted an ancient cultural horizon. The age data suggested that the causative earthquake may have occurred about 2000 years ago. While the source of this earthquake remains constrained, its timing seems to be singular; studies elsewhere in Kachchh have not disclosed any feature of a comparable age as yet. Their study opens the possibility for another surprise source, and may be adding a new dimension to the seismic hazard of the entire Gujarat region. 10.3
Comparison with IS: 1893 – Part I (2002) spectra
Several researchers had carried out studies on seismic zoning of India even before the publication of the first zoning map by the Bureau of Indian Standards in 1962. The early seismic maps were qualitative in nature and demarcated the areas of severe, moderate, light etc. damages (Krishna, 1959). The later studies quantified the seismic zones on the basis of www.nat-hazards-earth-syst-sci.net/12/2019/2012/
Modified Mercalli Intensity levels, similar to the IS code zoning (Guha, 1962). Updating has been marginally done only after the occurrence of large and damaging earthquakes (e.g., Mw = 6.3 Koyna; Mw = 7.7 Bhuj, 2001). It is observed that the zoning prescribes a lower hazard for the regions without significant records of historical earthquakes and revisiting after the occurrence of damaging earthquakes. In addition, this map does not portray the seismic hazard at different locations and suffers from the weakness of assessing the return periods of postulated design seismic coefficients for various zones. Large magnitude earthquake may be expected in the region where not many earthquakes have occurred and seismic hazard at a site is controlled by all earthquakes expected to occur (including future) during the life of a structure in the area surrounding the site, and not only by the largest magnitude earthquake. In this paper, a comparison has been made between the compared spectra obtained in the present study with the IS: 1893-Part I (2002)-specified spectra for the cities studied. The PGA specified by IS:1893-Part I (2002) is compared with the obtained PGA value for the 50th percentile and 84th percentile as shown in Fig. 13. The estimated PGAs for the cities of Ahmedabad and Surat are in agreement with that specified by IS:1893-Part I (2002) i.e. for Ahmedabad and Surat 0.13 g and 0.15 g respectively whereas the specified PGA is 0.16 g. Though the estimated PGAs are at bed rock level, site specific corrections are required to be done for exact comparison. For Bhuj city, the estimated PGA (0.64g) are high compared to 0.36 g specified by IS:1893-Part I (2002). As expressed earlier by Parvez et al. (2003) and Hough et al. (2002), the predicted near- field ground motion of approximately 0.8 g for the Kachchh areas for the Bhuj 2001 earthquake also shows that the estimated PGAs are higher than the IS:1893-Part I (2002). Being in zone III, IS:1893-Part I (2002), specifies that the expected PGA for Jamnagar city is in order of 0.24 g whereas the observed PGA as per the present study is around 0.16 g. The PGA around Jamnagar city is also observed in the order of 0.18 to 0.2 g as per the seismic hazard map compiled by the Jaiswal and Sinha (2007). This shows that presently, the specified hazard is higher (30 % approximately) than the required as per the present study. Similarly, for the city of Junagadh, the specified PGA is of the 0.16 g level whereas in the present study it is observed of the order of 0.2 g, higher than that specified by the IS:1893-Part I (2002) code. Jaiswal and Sinha (2007) have also shown that the seismic hazard in the region around Junagadh city is of the order of 0.12 to 0.18 g for the return period of 475 yr. The recent earthquake activities around Talala as described by Yadav et al. (2010) also indicate that the Junagadh region presently has a higher seismic hazard and when estimating future earthquakes, the level of PGA may be higher than that specified by code and should be increased without waiting for a big event to occur via a surprising source.
Nat. Hazards Earth Syst. Sci., 12, 2019–2037, 2012
2032
J. Shukla and D. Choudhury: Estimation of seismic ground motions using deterministic
Table 5. Deterministic magnitude-distance pair for hazard-producing ground motion exceeding 0.2 g.
City
Model
Hazard (producing ground motion exceeding 0.2 g)
Mean magnitude (Mw )
Distance (km)
Ahmedabad
b-value (present study) b-value = 0.92
0.00164 0.00152
5.11 5.29
15.88 15.70
Surat
b-value (present study) b-value = 0.92
0.00356 0.00293
5.05 5.04
11.81 12.45
Bhuj
b-value (present study) b-value = 0.92
0.02230 0.01240
5.52 4.81
12.56 8.33
Jamnagar
b-value (present study) b-value = 0.92
0.00069 0.000173
6.57 6.17
69.27 51.83
Junagadh
b-value (present study) b-value = 0.92
0.00075 0.00088
5.04 5.33
22.87 18.89
Table 6. Deterministic seismic 1 spectral ordinates for few reference periods.
Junagadh
Jamnagar
Bhuj
Surat
Ahmedabad
Location
b-value
Deterministic Percentile
Period (s) PGA
0.20
0.50
1.00
0.62* 0.92#
(50-percentile)
0.13 0.48
0.22 0.86
0.09 0.58
0.04 0.36
0.62* 0.92 0.62* 0.92
(84-percentile)
0.23 0.78 0.15 0.35
0.39 1.41 0.26 0.61
0.17 0.96 0.11 0.35
0.07 0.58 0.04 0.18
0.62* 0.92
(84-percentile)
0.26 0.57
0.45 1.02
0.20 0.59
0.08 0.31
0.417* 0.92
(50-percentile)
0.64 0.75
1.09 1.46
0.61 1.02
0.31 0.61
0.417* 0.92
(84-percentile)
1.08 1.26
1.85 2.44
1.04 1.69
0.54 1.00
0.64* 0.92
(50-percentile)
0.14 0.27
0.26 0.52
0.18 0.40
0.11 0.28
0.64* 0.92
(84-percentile)
0.24 0.45
0.45 0.88
0.31 0.66
0.19 0.46
0.64* 0.92
(50-percentile)
0.20 0.45
0.34 0.81
0.17 0.54
0.08 0.33
0.64* 0.92
(84-percentile)
0.34 0.73
0.59 1.32
0.30 0.89
0.14 0.53
(50-percentile)
Note: ∗ present study, # adopted from Jaiswal and Sinha (2007).
Nat. Hazards Earth Syst. Sci., 12, 2019–2037, 2012
www.nat-hazards-earth-syst-sci.net/12/2019/2012/
J. Shukla and D. Choudhury: Estimation of seismic ground motions using deterministic
Ahmedabad
1
Surat
1
0.1
0.1
0.01 10
10
Sepectral Acceleration (g)
Sepectral Acceleration (g)
10
Spectral response @ 5% damping
0.01 10
Spectral response @ 5% damping
Junagadh Sepectral Acceleration (g)
Sepectral Acceleration (g)
Bhuj
1
0.1
Sepectral Acceleration (g)
0.01 10
2033
1
0.1
Spectral response @ 5% damping
0.01
Jamnagar
Spectral response @ 5% damping
Period (s) (50-percentile) -b-value present study (84-percentile) -b-value present study (50-percentile) -b-value=0.92 (84-percentile) -b-value=0.92
1
0.1
Spectral response @ 5% damping
0.01 0.01
1
0.1
Period (s)
1
10
2 Fig. 12. Deterministic spectra obtained for various cities with different b-values. The ground accelerations are plotted in unit of 5 % damped acceleration response spectrum as a function of period for different b-values at particular site location. 3
Figure 12. Deterministic spectra obtained for various cities with different b-values. Plotted
4 are the ground accelerations in unit of 5% damped acceleration response spectrum as a Conclusions istic seismic hazard analysis is carried out using maximum 5 function of period for different b-values at particular site location. magnitude earthquake associated with 40 faults. For each city, the hazard associated with each source is calculated usIn order to 6 be consistent with the other seismic codes worlding the classical Cornell approach, using the seven different wide and to cater to performance based seismic design GMARs including the domestic relations of India given by approaches, 7 it is necessary to develop regional seismic hazRaghu Kanth and Iyengar (2007). The deterministic spectra ard maps/scenarios consistent with the local seismotectonic obtained using the 50th percentile (representing MCE) and setting. The 8 present study is the first step towards developing 84th percentile (representing SSE) have been developed usa state-of-the-art seismic hazard map for one of the most acing the probabilistic framework and logic tree approach and tive regions of Peninsular India and forms a sound basis for 46 compared with the IS:1893-Part I (2002) specified spectra. future extension of the site-specific studies of the controlThe seismic hazard in the Gujarat region is quite scattered. ling regions. To estimate seismic ground motions for the few It is much higher for the Kachchh region (i.e. Bhuj city) and commercial hubs of the state of Gujarat, India, the determin11
www.nat-hazards-earth-syst-sci.net/12/2019/2012/
Nat. Hazards Earth Syst. Sci., 12, 2019–2037, 2012
2034
J. Shukla and D. Choudhury: Estimation of seismic ground motions using deterministic
1
1
0.1
0.01 10
10
Ahmedabad
Sepectral Acceleration (g)
Sepectral Acceleration (g)
10
Spectral response @ 5% damping
Surat
1
0.1
0.01 10
Spectral response @ 5% damping
Jamnagar
1
Sepectral Acceleration (g)
Sepectral Acceleration (g)
Bhuj
0.1
0.01 10
Spectral response @ 5% damping
Sepectral Acceleration (g)
Junagadh
2
1
0.1
Spectral response @ 5% damping 0.01 0.01 0.1 1
Period (s)
10
(50-percentile) (84-percentile) IS:1893 (2002)
1
0.1
Spectral response @ 5% damping 0.01 0.01 0.1 1
Period (s)
10
Fig. 13.3 50th percentile deterministic hazard spectra for five cities in Gujarat, India. The ground accelerations are plotted in unit of 5 % damped acceleration response spectrum as a function of period and its comparison with IS:1893-Part I (2002) specified spectra for seismic Figureat 13. 50th site 4 structures percentile design of particular location. deterministic hazard spectra for five cities in Gujarat, India. Plotted
5
are the ground accelerations in unit of 5% damped acceleration response spectrum as a
comparatively lower for Saurashtra Mainland regions performance-based designs. spectra Close examination function of the period and itsand comparison with IS:1893-Part I (2002) specified 6 for seismicof the deof Gujarat State. The most vulnerable site is Bhuj city as it is veloped spectra has revealed that the expected ground mo7 todesign of active structures location. very close the most faultsatinparticular the state ofsite Gujarat. It tion values become high for the Kachchh region i.e. Bhuj has also been observed that the calculated hazard is sensitive city and moderate in the Mainland Gujarat, i.e. the cities of 8 to the b-value. The variation in hazard computed with respect Surat and Ahmedabad. The seismic ground motion level in to b-value is highest for Ahmedabad city and lowest for Bhuj Saurashtra is moderate but differs only marginally from that city. Based on the present study, the recommended PGA valpresently specified in IS:1893-Part I (2002), i.e. for the city ues for the cities studied are 0.13 g, 0.15 g, 0.64 g, 0.14 g and of Jamnagar the hazard presently specified is overestimated 0.2 g for Ahmedabad city, Surat city, Bhuj city, Jamnagar whereas it is underestimated for Junagadh city by IS:1893city and Junagadh city, respectively. Deterministic spectra Part I (2002). The present provisions in code IS:1893-Part 47 have been prepared for each major city for the 50th and 84th I (2002) are intensity based observations and do not address percentiles of ground motion occurrence in order to aid the the probabilistic estimation of seismic hazard. Nat. Hazards Earth Syst. Sci., 12, 2019–2037, 2012
www.nat-hazards-earth-syst-sci.net/12/2019/2012/
J. Shukla and D. Choudhury: Estimation of seismic ground motions using deterministic The proposed spectra for the various major cities offer practical value to the engineers for seismic design of structures. The users of the proposed spectra should be cautious that the spectra presented in the present study are for the bedrock level. It is necessary to carry out site response analysis for the sites underlain by soil to compute the maximum horizontal ground acceleration required for the design of earthquake- resistant structures. It is also noteworthy that earthquake return periods are not presently addressed in this study and that the fault recurrence relations are obtained empirically from the regional recurrence further calculated from the earthquake catalogue for Mw ≥ 4. Furthermore, it is planned to develop probabilistic seismic hazard maps for the Gujarat region and site-specific spectra for a few critical locations to help safe and economical planning. Acknowledgements. Authors are grateful to two anonymous reviewers for the constructive comments that enhanced the quality of the paper. Edited by: M. E. Contadakis Reviewed by: two anonymous referees
References Abrahamson N. A. and Silva W. J.: Empirical Response Spectral Attenuation Relations for Shallow Crustal Earthquakes, Seismol. Res. Lett., 68, 1, 94–127, 1997. Anbazhagan P., Vinod, J. S., and Sitharam, T. G.: Probabilistic seismic hazard analysis for Bangalore, Nat. Hazards, 48, 2, 145–166, 2009. Ashara L. V., Patel J. N., Abdul Hamid, Srivastava, S., and Kumar, S.: Broadband seismic network for Gujarat, Proc. of 13th Symposium on Earthquake Engineering, IIT Roorkee, 1, 52–57, 2006. Avadh Ram and Rathor, H. S.: On Frequency Magnitude and Energy of Significant Indian Earthquakes, Pure Appl. Geophys., 79, 26–32, 1970. Bapat, A., Deshpande N. V., Das P. B., and Bhavnarayana, V.:Preimpoundment seismicity studies around Sardar Sarovar Site, CBIP 55, R&D Session, 1989. Bendick, R., Bilham, R., Fielding, E., Gaur, V.K., Hough, S.E.,Kier, G., Kulkarni, M.N., Martin, S., Mueller, K., and Mukul, M.: The January 26, 2001 Republic Day Earthquake, India, Seismol. Res. Lett., 72, 328–335, 2001. Bhatia, S. C., Kumar, R., and Gupta, H. K.: A probabilistic seismic hazard map of India and adjoining regions, Ann. Geofis., 42, 1153–1164, 1999. Bhattacharya, S. N., Karanth, R. V., Dattatryam, R. S., and Sohoni, P. S.: Earthquake sequence in and around Bhavnagar, Saurashtra, western India during August-December 2000 and associated tectonic features, Curr. Sci. India, 86, 25, 2004. Bilham R., Gaur V. K., and Molnar, P.: Himalayan seismic risk, Science, 293, 1442–1444, 2001. Bilham, R.: Earthquakes in India and the Himalaya: tectonics, geodesy and history, Ann. Geophys., 47, 2/3, 2004, http://www.ann-geophys.net/47/2/2004/.
www.nat-hazards-earth-syst-sci.net/12/2019/2012/
2035
Biswas, S. K. and Deshpande, S. V. :Geological and tectonic maps of Kutch, ONGC Bull., 1970, 7, 115–116, 1970. Biswas, S. K.: Rift basins in western margin of India and their hydrocarbon prospects with special reference to Kutch basin, Am. Assoc. Petr. Geol. B., 66, 1, 497–1,513, 1982. Biswas S. K.: Regional tectonic framework, structure and evolution of the western marginal basins of India, Tectonophysics, 135, 307–327, 1987. Biswas, S. K.: A review of structure and tectonics of Kutch basin, western India, with special reference to earthquakes, Current Since, 88, 10 1592–1600, 2005. Bonilla, M. G., Mark, R. K., and Lienkaemper, J. J.: Statistical relations among earthquake magnitude, surface rupture length and surface fault displacement, Bull. Seism. Soc. Am, 74, 2379– 2411, 1984. Boore, D. M., Joyner, W. B. and Fumal, T. E.: Equations from estimating horizontal response spectra and peak acceleration from Western North American earthquakes: a summary of recent work, Seismol. Res. Lett., 68, 128–153, 1997. Campbell, K. W.: Empirical Near-Source Attenuation Relationships for Horizontal and Vertical Components of Peak Ground Acceleration, Peak Ground Velocity, and Pseudo-Absolute Acceleration Response Spectra, Seismol. Res. Lett., 68, 1, 154–179, 1997. Cramer, C. H. and Wheeler, R. L.: The 2001 Gujarat, India earthquake and seismic hazard in Central and Eastern North America, Abstr. Seismol. Res. Lett., 72, 396, 2001. Chandra, U.: Earthquakes of peninsular India-A seismotectonic study, Bull. Seismol. Soc. Am., 67, 1387–1413, 1977. Chopra Sumer, Dinesh Kumar., and Rastogi, B. K. : Estimation of strong ground motions for 2001 Bhuj (Mw = 7.6), India earthquake, Pure Appl. Geophys. Earth and Env. Sci., 167, 1317– 1330, 2010. Choudhury, D. and Shukla, J.: Probability of occurrence and study of earthquake recurrence models for Gujarat state in India, Dis. Adv., 4, 47–59, 2011. Chung, W. Y.: Source parameters of two rif-associated intraplate earthquakes in peninsular India: the Bhadrachalam earthuake of April 13, 1969 and the Broach earthquake of March 23, 1970, Tectonophysics, 225, 219–230, 1993. Chung, W. Y. and Gao, H.: Source parameter of the Anjar earthquake of July 21, 1956, India, and its seismotectonic implications for the Kutch rift basin, Tectonophysics, 242, 281–292, 1995. Cornell, C. A.: Engineering Seismic Risk Analysis, Bull. Seism. Soc. Am., 58, 5, 1583–1606, 1968. Frankel, A., Mueller, C., Barnhard, T., Perkins, D., Leyendecker, E. V., Dickman, N., Hanson, S., Hopper, M., :National seismic hazard maps: documentation June 1996,. Open-File Report (United States Geological Survey), 96-532, 41, 1996. Gaur, V. K. and Chauhan, R. K. S.: Quantitative measures of seismicity applied to Indian regions, Bull Indian, Soc. Earth. Tech., 5, 63–78, 1968. Guha S. K. and Basu, P. C.: Catalogue of earthquake (M>3) in Peninsular India, Atomic Energy Regaulatory Board, Tech Document No. TD/CES-1, 1–70, 1993. Gupta, H. K. and Rastogi, B. K.: Dams and Earthquakes, Elsevier, Amsterdam, 229, 1976. Gupta, I. D.: The of the art in seismic hazard analysis, ISET Journal of Earthquake Technology, 39, 331–346, 2002.
Nat. Hazards Earth Syst. Sci., 12, 2019–2037, 2012
2036
J. Shukla and D. Choudhury: Estimation of seismic ground motions using deterministic
Gutenberg B. and Richter, C. F.: Frequency of earthquakes in California, Bull. Seism. Soc. Am., 34, 185–188, 1944. GSI: Seismotectonic Atlas of India and its Environs, Geological Survey of India, Spec. Publ. No., 59, Kolkatta, 2000. Hough, S. E., Martin, S., Bilham, R., and Atkinson, G. M.: The 26 January 2001, M 7.6 Bhuj, India, earthquake: observed and predicted ground motions, Bull. Seism. Soc. Am., 92, 2061–2079, 2002. IS:1893-Part-I, Criteria for Earthquake Resistant Design of Structures, Bureau of Indian Standard, New Delhi, India, 2002. Iyengar, R. N., Sharma, D., and Siddiqui, J. M.: Earthquake history of India in medieval times, Indian J. Hist. Sci., 3, 181–237, 1999. Iyengar, R. N. and Ghosh, S.: Microzonation of earthquake hazard in greater Delhi area, Current Sci. India, 87, 1193–1202, 2004. Iyengar, R. N. and Rghu Kanth, S. T. G.:Attenuation of ground motion in Peninsular India, Seismol. Res. Lett., 79, 67–81, 2004. Jaiswal, K. and Sinha, R.: Probabilistic seismic-hazard estimation for peninsular India, Bull. Seismol. Soc. Am., 1, 318–330, 2007. Johnston, A. C. and Kanter, L. R.: Earthquakes in stable continental crust, Sci. Am., 262, 69–75, 1990. Johnston, A. C.: Compression tectonics in failed continental rifts: the India Republic Day and 7 February 1812 New Madrid earthquakes, Abstr. Seismol. Res. Lett., 72, 398, 2001. Kaila, K. L., Gaur, V. K., and Hari Narain: Quantitative seismicity maps of India, B. Seismol. Soc. Am., 62(5), 1119–1132, 1972. Kaila, K. L., Krishna V. G., and Mall, D. M.:Crustal structures along Mehmadabad – Billimora profile in the Cambay basin, India, from deep seismic soundings, Tectonophysics, 76, 99–130, 1980. Karanth ,R. V. and Sant, D. A.: Lineaments and dyke swarms of lower Narmada Valley and southern Saurashtra, western India, J. Geol. Soc. India, 33, 425–434, 1995. Khattri, K. N., Rogers, A. M., Perkins, D. M., and Algermissen, S. T.: A Seismic Hazard Map of India and Adjacent Areas, Tectoniphysics, 108, 93–134, 1984. Krinitzsky, E. L.: How to obtain earthquake ground motions for engineering design, Engrg. Geol., 65, 1–16, 2002. Krinitzsky, E. L.: Deterministic versus probabilistic seismic hazard analysis for critical structures, Internat. J. Eng. Geol., 40, 1–7, 1995. Lettis, W. R. and Hengesh, J. V.: Preliminary observation on the origin and effects of the January 26, 2001 Republic Day earthquake, India 2001, Seismol. Res. Lett. 72, 396, 2001. Malik, J. N., Sohoni, P. S., Karanth, R. V., and Merh, S. S.:Modern and Historic Seismicity of KachchhPeninsula, Western India, J. Geol. Soc. India, 54 545–550, 1999. Mark, R. K.: Application of linear statistical model of earthquake magnitude versus fault length in estimating maximum expectable earthquakes, Geology, 5, 464–466, 1977. Menon, A., Ornthammarath, T., Corigliano, M., and Lai, C. G. : Probabilistic seismic hazard macrozonation of Tamil Nadu in Southern India,BSSA, 100, 3, 1320–1341, 2010. Nowroozi, A. A.: Emperical relations between magnitudes and fault parameters for earthquakes in Iran,Bull. Seism. Soc. Amer., 75, 1327–1338, 1985. Nuttli, O. W.: Seismicity of the central United States, Geological Society of America, Rev. Eng. Geol., 4, 67–93, 1979. Oldham, T. :A catalogue of Indian earthquakes from the earliest time to the end of A.D. 1869, Mem Geol. Surv. India 19, 53,
Nat. Hazards Earth Syst. Sci., 12, 2019–2037, 2012
1883. Parvez, A. I., Franco Vaccari, and Panza, G. F.: A deterministic seismic hazard map of India and adjacent areas, Geophys. J. Internat., 155, 489–508, 2003. Petersen, M. D., Rastogi, B. K., Schweig, G. E.S., Harmsen, S. C., and Gomberg, J. S.: Sensitivity analysis of seismic hazard for the northwestern portion of the state of Gujarat, India, Tectonophysics, 390, 105–115, 2004. Quittmeyer, R. C. and Jacob, K. H.: Historical and modern seismicity of Pakistan, Afghanistan, northwestern India, and southeastern Iran, Bull. Seismol. Soc. Am. 69 (3), 773–823, 1979. Rajendran, C. P. and Rajendran, K.: Characteristics of deformation and past seismicity associated with the 1819 Kutch earthquake, Northwestern India, Bull. Seismol. Soc. Am., 91, 407– 426, 2001. Rajendran, K., Rajendran, C. P., Thakkar, M., and Tuttle, M.: The 2001 Kutch (Bhuj) earthquake: Coseis- mic surface features and their significance, Curr. Sci. India, 80, 1397–1405, 2001. Rajendran, C. P., Rajendran, K., Vora, K. H., and Gaur, A. S.: The odds of a seismic source near Dwarka, NW Gujarat: An evaluation based on proxies, Current Sci. India, 84, 5, 695–701, 2003. Rao, B. R. and Rao, P. S.: Historical seismicity of peninsular India, B. Seismol. Soc. Am., 74, 2519–2533, 1984. Rastogi, B. K.: Ground deformation study of Mw 7.7 Bhuj earthquake of 2001, Episode, 24 (3), 160–165, 2001. Rastogi, B. K.: Damage due to the Mw 7.7 Kutch, India earthquake of 2001, Tectonophysics, 390, 85–103, 2004. Raghu Kanth, S. T. G., and Iyengar, R. N.: Seismic hazard estimation for Mumbai city, Curr. Sci. India, 11, 1486–1494, 2006. Raghu Kanth, S. T. G. and Iyengar, R. N.: Estimation of seismic spectral acceleration in peninsular India, J. Earth Sys. Sci., 3, 199–214, 2007. Rao, Buddha Ramalineswara: Historical seismicity and deformation rates in the Indian Peninsular Shild, J. Seismology, 4, 247– 258, 2000. Ravi Kumar, M. and Bhatia, S. C.: A new seismic hazard map for the Indian plate region under the global seismic hazard assessment programme, Current Sci. India, 77 (3), 447–453, 1999. Schweig, III, E., Gomberg, J., Petersen, M., Ellis, M., Bodin, P., Mayrose, L., and Rastogi, B. K.: The M 7.7 Bhuj earthquake: global lessons for earthquake hazard in intra-plate regions, J. Geol. Soc. India, 61, 277–282, 2003. Sadigh, K., Chang, C. Y., Egan, J. A., Makdisi, F., and Youngs, R. R.: Attenuation relations for shallow crustal earthquakes based on California strong motion data, Sesmol. Res. Lett. I(68), 180– 189, 1997. Seed, H. B.: The selection of design earthquake for critical structures, Bull. Seism. Soc. Am., 72, 74–89, 1982. Sitharam, T. G. and Anbazhagan, P.: Seismic Hazard Analysis for the Bangalore Region, Nat. Hazards, 40, 261–278, 2007. Slemmon, D. B.: Determination of earthquake size from surface faulting events, Proc. Inter. Seminar on Seismic Zoning, China, 1989. Sukhtankar, R. K., Pandian, R. S., and Guha, S. K.: Seismotectonic studies of coastal areas of Inida, Pakistan, Bangladesh and Burma, Nat. Hazards, 7, 201–210, 1993. Talwani, P. and Abhijit Gangopadhyay: Tectonic Framework of the Kachchh Earthquake of 26 January 2001, Seism. Res. Lett., 72, 336–345, 2001.
www.nat-hazards-earth-syst-sci.net/12/2019/2012/
J. Shukla and D. Choudhury: Estimation of seismic ground motions using deterministic Tandon, A. N. and Srivasta, H. N.: Earthquake occurrences in India, Earthquake Engineering, Jai Krishna Volume, Sarita Prakashan (publ.), 1–48, 1974. Tandon, A. N.: The rann of Kutch earthquake of 21st July 1956, Indian J. Met. Geophys., 10, 137–146, 1959. Thakur, V. C. and Wesnousky, S. G.: Seismotectonics of 26 January 2001 Bhuj earthquake affected region, Current Sci. India, 82, 4, 396–399, 2002. Tripathi, J. N.: Probabilistic assessment of earthquake recurrence in the January 26, 2001 earthquake region of Gujarat, India, J. Seismol., 10, 119–130, 2006. Toro, G. R. Abrahamson, N. A., and Schneider, J. F.: Model of strong ground motions from earthquakes in central and eastern North America: best estimates and uncertainties, Seismol. Res. Lett., 68, 41–58, 1997. Tinti, S. and Mulargia, F.: Completeness analysis of a seismic catalog, Ann. Geophys., 407–414, 1985.
www.nat-hazards-earth-syst-sci.net/12/2019/2012/
2037
Vipin, K. S., Anbazhagan, P., and Sitharam, T. G.: Estimation of peak ground acceleration and spectral acceleration for South India with local site effects: probabilistic approach, Nat. Hazards Earth Syst. Sci., 9, 865–878, 2009, http://www.nat-hazards-earth-syst-sci.net/9/865/2009/. Yadav, R. B. S., Tripathi, J. N., Rastogi, B. K., and Chopra, S.: Probabilistic Assessment of Earthquake Hazard in Gujarat and Adjoining Regions of India, Pure Appl. Geophys., 165, 1813– 1833, 2008. Yadav, R. B. S., Papadimitriou, E. E., Karakostas, V. G., Shanker, D., Rastogi, B. K., Chopra, S., Singh, A. P., and Kumar, Santosh: The 2007 Talala, Saurashtra, western India earthquake sequence: Tectonic implications and seismicity triggering”, J. Asian Earth Sci., 2010. Wells, D. L. and Coppersmith, K. J.: Updated empirical relationships among magnitude, rupture length, rupture area and surface displacement”, B. Seism. Soc. Am., 84, 4–43, http://www.isr. gujarat.gov.in, 1994.
Nat. Hazards Earth Syst. Sci., 12, 2019–2037, 2012