Estimation of solid waste generation and recycling potential on commercial and institutional sectors in Hue city, Vietnam ○Trang D.T.T, Thanh N.P, Matsui Y, Graduate School of Environmental and Life Science – Okayama University 1. Introduction The rapid economic growth and expanding urbanization in cities in Vietnam have caused the increase of the waste generation and the diversification of waste composition. Commercial and institutional solid waste accounted for high proportion of total MSW, especially in tourism cities. In this paper, the authors intended to estimate the waste generation amount on the commercial and institutional sectors in a tourism cityHue city, located in the central of Vietnam. 2. Methodology The major components of commercial and institutional sectors in this study were presented in table 1. This table also presented the total number of each category in Hue city, sample size in this study. Table 1: Target categories of commercial and institutional sectors in Hue city
A waste generation survey of various commercial and institutional sectors including hotels, restaurants, traditional markets/supermarkets, schools, medical institutions, offices, households with business activities were conducted in rainy season in Hue city from September to December, 2011. The target samples kept their waste into 4 categories separately; “General waste,” “Recyclables,” “Food residues,” and “Garden waste,” and the daily waste generation amount was measured for 7 consecutive days. Commercial and institutional waste are classified into 10 physical categories and 54 detail sub-categories. A questionnaire survey was also conducted on relevant factors influencing waste generation such as business scale indicators, and the current status of recycling activities. To calculate the total waste generation (kg/day) of commercial, institutional, and residential sectors, the following equation was applied: Total waste generation (kg/day) = ΣXi * Ni Xi: Waste generation rate (kg/ business scale indicator /day) of business category i Ni: Total number of business scale indicator of business category i i: Business category (business scale indicator): School (No. classes, No. students, No. classroom), Healthcare service (No. patients, No. workers, No. beds), Office (No. rooms, No. workers, area (m2), Hotel (No. rooms, No. beds, No. guests), Restaurant (No. workers, No. chairs, No. tables), Household with business (No. workers), Household (population) For each the waste generation rate of categories and sub-categories of commercial, institutional, and residential sectors by different business scale indicators, a different calculation model was developed, so as the model which showed the narrow range of 95% confidence interval was selected for calculate total waste generation in Hue city. As a validation for the unit waste generation rates, the author estimated the 95% confidence interval of total waste discharge amount in Hue city by a Monte Carlo Simulation based on the means and standard errors. 3. Results and discussion 3.1. Relevant factors influencing waste generation The authors analyzed the correlations between the generation rates and the relevant factors such as business scale indicators, household size, and net-sales and net-sales by correlation analysis using Pearson correlation. The analyses were implemented by 4 waste types and total: general waste, recyclable waste, food residues, garden waste, and total waste. 3.2. Estimation of waste generation in Hue city The total waste generation (tons/day) from commercial, institutional, and residential sectors in Hue city was calculated and the total number of each business scale indicator in Hue city. Unfortunately, Market and supermarket sectors were not involved in this calculation because of missing information and database. Table 2 presented the estimation results of total waste generated from commercial, institutional, and residential sectors by four waste types, General waste, Recyclable waste, Food residues, and Garden waste. The distributions of waste Corresponding author:
[email protected] . 3-1-1 Tsushima-naka, Kita-ku, Okayama 700-8530, Japan . Tel/Fax: 086-251-8991
Keywords: commercial and institutional waste, recycling potential, estimation of waste generation rate
generation both amount (tons/day) and percentage (%)) among sub-categories of commercial, institutional, and residential sectors (categories) as well as among waste types in total wastes were calculated. Among 4 waste types, General waste accounted for the highest part (78.55%), followed by Food residues (14.83%), Recyclable (5.43%), and Garden waste (1.19%). Among sub-categories of commercial, institutional, and residential sectors, Residential waste (household without business) accounted for the largest proportion (44.11%), followed by Household with business (25.72%), Restaurant (21.42%), School (3.77%), Hotel (3.32%), Hospital (1.16%), and office (0.49%). This table also presented the business scale indicator used for estimating total waste generation of each subcategory. Based on this calculation, it was assumed that waste collection efficiency was 90% by population, the daily waste collection amounts by HEPCO was 118.83 tons/day (including general waste and garden waste); recycling rates of Recyclables which were stored and sold to junk-buyers by owners and Food residues which were stored and given to pig farms were 8.99 tons/day and 24.55 tons/day, respectively. Table2. Estimation of waste generation from commercial, institutional, and residential sectors Business scale indicator HOTEL No. bed COMMERCIAL RESTAURANT No. staff HH with business No. facilities No. students** INSTITUTIONAL School Hospital No. facilities* Office No. facilities HH without business Population RESIDENTIAL TOTAL Percentage (%) among major components CATEGORY
SUB-CATEGORY
General waste tons/day % 3.32 2.55 16.62 12.78 33.07 25.43 2.43 1.87 1.15 0.89 0.44 0.34 73.03 56.15 130.06 100 78.55
* General Hospital was calculated by No. beds
Recyclable waste tons/day % 0.34 3.78 1.39 15.42 6.80 75.67 0.08 0.84 0.17 1.85 0.22 2.43 8.99
100 5.43
Food residues tons/day % 1.70 6.93 17.07 69.53 2.72 11.07 2.72 11.08 0.34 1.39 24.55
100 14.83
Garden waste tons/day % 0.13 6.82 0.39 19.80 1.02 51.65 0.27 13.58 0.16 8.15 1.97
** Other educations were calculated by No. facilities
100 1.19
Total tons/day % 5.49 3.32 35.47 21.42 42.59 25.72 6.24 3.77 1.93 1.16 0.82 0.49 73.03 44.11 165.57 100.00 100
HH: Household
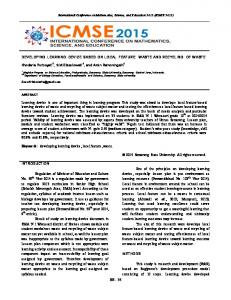
As a validation for the unit waste generation rates and this estimation approach, the author estimated the 95% confidence interval of Total waste discharge amount by a Monte Carlo Simulation based on the means and standard errors. Figure 1 presented the waste generation amount (tons/day) by 95% confidence interval (95% CI) for commercial, institutional, and residential sectors in Hue city. The results showed that the wide range of 95% CI was found for sub-categories: Household with business, Restaurant, and household without business. These were significant signals for bad results of estimation; therefore, the 95% CI of total waste in Hue was very wide (144.77 – 190.92 tons/day). To improve the estimation results, a sensitive analysis for subcategories of commercial, institutional, and residential sectors which had wide-range of 95%CI for finding the impact factors influencing final estimation results was calculated. These components will be concentrated and improved for next surveys. 3.3. Recyclable potential
Figure 1: Preliminary calculation of waste generation flow in Hue city
The results showed that compostable wastes accounted for large percentage (50.25%) of total waste generation, of which more than 94% generated from food waste and remaining part from garden waste. Food residues for livestock feeding accounted for 15% of total waste generation recycled by pig farmers. Recyclable materials also accounted for high percentage (13%) of total waste generation; of which recycled materials which had kept and recycled by discharger owner took 41.97% and the remaining (58.03%) was high potential recyclables which may be recycled by waste pickers, waste collectors, junk-buyers, scavengers, etc. Disposal waste part accounted 21% of total waste generation; however, 43.22% of this part was the existing potential materials for recycling, which have theoretical recyclable potential, depend on recycling market (e.g., shopping plastic bags, glass bottle, and plastic tray). 4. Conclusion This is the first step for developing predictive models and total estimation of waste flow for a given city. Further studies are necessary in consideration of a deep and wide analysis of relevant factors and levels as well as abilities to practical applications. Through these studies, it would be possible to develop predictive models on commercial and institutional waste generation.