Feb. 29, 1972; accepted. Mar. 13, 1972. constant and about. 5:1 in normal subjects. (1, 4) and in patients with all types of hyperlipoprotein- emia, except the rare ...
Estimationof the Concentrationof Low-Density LipoproteinCholesterolin Plasma,Without Useof the PreparativeUltracentrifuge William T. Friedewald,
Robert I. Levy, and Donald S. Fredrickson
A method for estimating the cholesterol content of the serum low-density lipoprotein fraction (Sf0.20) is presented. The method involves measurements of fasting plasma total cholesterol, triglyceride, and high-density lipoprotein cholesterol concentrations, none of which requires the use of the preparative ultracentrifuge. Corn parison of this suggested procedure with the more direct procedure, in which the ultracentrifuge is used, yielded correlation coefficients of .94 to .99, depending on the patient population compared. Additional
Keyph rases hyperlipoproteinemia
cation #{149} determination glyceride, high-density lipo proteins
of plasma lipoprotein
classifitotal cholesterol, tricholesterol #{149} beta
An important requirement for classification of hyperlipidemia into the different types of hyperlipoproteinemia (1, 2) is the estimation of the concentration of plasma LDL1 (Sf 0-20; the beta lipo-
proteins). This quantity is necessary for the assignment of the Type II pattern (1-3), which is defined as an increase rn LDL concentration above some arbitrarily selected cut-off limit. An indirect method is presented here for estimating the plasma LDL concentration in terms of the cholesterol contained in this lipoprotein (C LD L). The method requires measurement of the concentrations of plasma total cholesterol, triglycerides, and CHDL. This information can be obtained without ultracentrifugation and requires only routine lipid analyses in addition to a rapid precipitation of all plasma lipoproteins other than HDL. Two observations are used in the calculation. One is that
the
ratio
of cholesterol
of the mass of triglyceride in VLDL is apparently
to that of relatively
From the Biometrics Research Branch (W.T.F.) and the Molecular Disease Branch (R.I.L. and D.S.F.), National Heart and Lung Institute, 9000 Rockville Pike, Bethesda, Md. 20014. ‘Nonstandard abbreviations used: HDL, high-density lipoprotein; LDL, low-density lipoprotein; VLDL, very low-density lipoprotein; ro, plasma triglycerides; cholesterol concentration (mg/l00 ml of plasma) in the fraction identified by the subscript; EDTA, ethylenediaminetetraacetic acid. Received Feb. 29, 1972; accepted Mar. 13, 1972.
constant and and in patients
about
5:1
in normal
subjects
(1,
4)
with all types of hyperlipoproteinemia, except the rare Type III (1,2). The other is that when chylomicrons are not detectable, most of the triglyceride in plasma is contained in the VLDL. Thus, in the vast majority of plasma samples in which chylomicrons are not present, the cholesterol in plasma attributable to VLDL can be approximated by dividing the plasma triglyceride concentration by five. The justification of this method for estimation of CLDL is the subject of this paper. Methods Data were obtained from lipid and lipoprotein analyses performed by the Molecular Disease Branch of the National Heart and Lung Institute, on samples from patients with hyperlipidemia and from normal subjects. The results of the laboratory analyses are in the process of transfer to magnetic tapes for rapid retrieval and analysis. At the time of this study, complete lipoprotein analyses from
448 subjects classified as either normal, Type II, or Type IV primary hyperlipoproteinemia had been transferred to tapes and the data from all were used. The data reflect the research interests of the Branch, with most of the data coming from patients with familial hyperlipoproteinemia or their relatives, and as such do not represent an unbiased sample of the general population. The specimen
from each patient chosen for analysis in this paper was the first sample on magnetic tape on which a complete
lipoprotein
analysis
had been
performed
at the National Heart and Lung Institute. The subjects were receiving no dietary or drug treatment for hyperlipoproteinemia at the time of this sampling, except for two patients who were on caloric restriction but who classified as Type IV. The original plasma samples
were had
subsequently been
obtained
12 to 14 h after the last meal, mixed with EDTA (1 mg/ml), and immediately stored at 4#{176}C until analyzed. Total plasma cholesterol (6) and triglycerides (6) were measured, and data on CHDL, CLDL, and CVLDL obtained by a combination of ultracentrifugation and precipitation procedures (7). In samples free of chylomicrons the CVLDL was CLINICAL CHEMISTRY, Vol. 18, No. 6, 1972 499
measured in two ways: (a) directly, by measuring the cholesterol content of the supernatant fraction after ultracentrifugation of plasma at D.1006 for 16 h at 100,000 X g in a Spinco 40.3 rotor, and (b) indirectly, by subtracting the cholesterol content of the infranatant fraction (the sum of the CHDL and CLDL)
from
the total
plasma
cholesterol.
280
NORMALS
were
classified
hyperlipoproteinemia to criteria previously
/
g200.
/
A method-
ologic error was presumed and the plasma reanalyzed if there was a large disparity between the results of the two methods. Subjects
/
240
as normal
20 S -J
0
z -J 0 -J
or as having
Type I through described (1, 2).
.98
40
V according
/ 40
80
120
ISO
LDLE-CHOLESTEROL
Resu Its The results
of lipid and ultracentrifuge lipoprotein determinations in 232 men and 216 women96 normal, 204 with Type II, and 148 with Type IV-were analyzed. Various statistics derived from these data are presented in Table 1. CLDL was also calculated for each person according to the following formula:
200
(m/I00
240
280
ml>
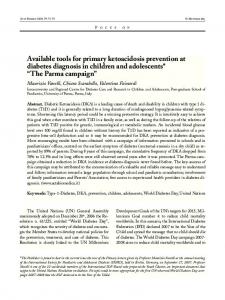
Fig. 1. Comparison of the plasma low-density lipoprotein cholesterol concentration in normal individuals as calculated by the estimation method (LELE) with that obtained by the ultracentrifuge method (LDLU)
::
TYPE
/
760 720
C
LDL
=
Cpa,ma
-
CHDL
TG/5
Plots of each individual’s CLDL as calculated by this method vs. that obtained after preparative ultracentrifugation (7) are presented in Figures 1 to 3. For normal people and Type II patients the spread of points about the line of equality for the two methods does not appear excessive, as reflected in the high correlation coefficients, .98 and .99, respectively (8). However, in Type IV patients there are many outlying values and the correlation is somewhat lower, namely, .85. Closer scrutiny of these outliers revealed that most such patients had very high plasma triglyceride concentrations, and thus a plot was made of only those Type IV patients with plasma triglycerides less than 400 mg/100 ml (111 of the original 148 people). The spread of values is much smaller after these are Table 1. Mean, Standard
Deviation,
and Range of
Plasma Lipids and Lipoproteins Normal
(%)
Type mg/io
Total plasma cholesterol Total plasma triglyceride
HDL cholesterol LDL cholesterol VLDL cholesterol
189 ± 33 (166-270) 73 ± 7 (20-184) 53 ± 13 (29-77) 122 ± 28 (62-185) 14 ± 9 (0-40)
II (2O4)
359 ± 100 (217488) 126 ± 16 (25-656) 45 ± 13 (18-82) 291 ± 99
241 57 (138-436) 347 ± 61 (90-2502) 38 ± 11
(173-840)
(28-231)
24 ± 19 (0-78)
(6-356)
No. of patients.
_________________________________________ 500
Type IV (14$)a
ml
CLINICAL CHEMISTRY, Vol. 18, No. 6, 1972
(15-74)
135 ± 38 68
±
55
FE
./
!4e 1
LDLcCHOLESTEROL
lmg/lOOmil
Fig. 2. Comparison of the plasma low.density lipoprotein cholesterol concentration in Type II patients as calculated by the estimation method (LDLE) with that obtained by the ultracentrifuge method (LDLu) excluded (Figure 4), the correlation coefficient then being .94. Further quantitative expressions for the disagreement between the C LD L obtained by the two methods are presented in Table 2. Because each of the confidence intervals (9) contains zero, there is no compelling reason based on these data to believe that the estimate of CLDL will be biased. The tolerance intervals (10) give the range of values that with probability .95 will include 95% of the differences between the two methods of measurement. The per cent error assumes that the CLDL measured by the ultracentrifuge method is the standard
with
which
the
CLDL
estimate
obtained
by calculation is being compared. The distribution of values by each method was examined for each of the groups, by use of normal probability graph
TYPE
280
280
TYPE (with TO a400)
(No SIICIUSIO8I) 200
240 6
8200 E
-
>60
>60 -J
-J
0 S
120
O
20
80 -844-
-J -
40 116+
/
S -J
-.4/-. “.7. / I 40
80 LDLE
-
0
80 -J 0 -J
40
r85 I 120
I 240
#{149} I
160
CHOLESTEROL
200
-7
t#{149}
#{149}
I
280
“
(m9 /lOOml)
40
#{149} .94 I
I
I
120
ISO
200
#{149}
80
LOL6-CHOLESTEROL
I
240
280
(mg/lOOmI)
Fig.
3. Comparison of the plasma low-density lipoprotein cholesterol concentration in Type IV patients as calculated by the estimation method (LIThE) with that obtained by the ultracentrifuge method (lJrmu); no exclusions
Fig. 4. Comparison of the plasma low.density lipoprotein cholesterol concentration in Type IV patients as calculated by the estimation method (LDLE) with that obtained by the ultracentrifuge method (LDLU), excluding individuals with serum triglycerides 400 mg/100 ml
paper. The values were reasonably normally distributed. Only in the Type IV patients was there evidence of skewness; this was only minimal, and in the negative direction. We did not attempt to calculate the overall average error or to estimate the probability of misclassification by this estimation procedure because of the unusually large number of Type II and Type IV patients relative to normal people in the sample. A subsample of 46 Type II patients was randomly chosen, a linear least-squares (11) fit of TG to CVLDL was performed, and the equation so obtained was used in a separate subset of 55 Type II patients to estimate their CVLDL. Analysis revealed that simple division of TG by five provided as accurate an estimate of CvLDL as did this more complicated regression estimate.
Discussion The method presented here for estimating plasma LDL concentrations provides a reasonable approximation that is useful for many purposes. There are, however, three important restrictions on its use. First, it is not applicable to plasma samples containing chylomicrons. However, such samples are characterized by a “cream” layer on top of plasma that has been stored at 4#{176}C for 18 h or more. Chylomicrons are characteristic of lipoprotein patterns classified as Types I and V, in which the CLDL concentration is not abnormally increased. Particles having similar appearance are also sometimes seen in Type III. Second, the technique for estimating CLDL gives erroneously high results in the rare patient with Type III hyperlipoproteinemia. In this disorder,
Table 2. Statistics on the Measurement of vs. the Estimation
CLOL
Utilizing the Ultracentrifuge
Procedure ILDLu-LDLg’
(LDLV-LDLE)6 No. of values, (n)
Normals Type II Type IV
96
204 lila
-
Mean,
.3 1.3 .4
CX)
Standard deviation, (SD)
95% confidence int.rvald
5.9 11.9 12.9
[-.9, 1.4] [-.4, 2.9] [-2.0, 2.9)
95% tolerance
int.rval
[-13.0, 13.5) [-24.3, 26.8] [-27.6, 28.61
Mean
4.8 8.8 9.8
%
errorf
4% 3% 7%
Only people with plasma triglycerides less than 400 mg/100 ml are included. LDLu = CLDL calculated with the preparative ultracentrifuge (see text). LDLE = CLDL calculated by the estimation procedure (see text). ‘I1DLu - LDLEI=the absolute value of (LDLE,-LDLE). d ± [t.value (.025, n-i)) SD/n. ‘ ± [tolerance-value (.95, .95, n)) SD. [mean of LDLU-LDLEIJ x 100 #{176} error (mean of LDL#{252}) a
CLINICAL CHEMISTRY, Vol. 18, No. 6, 1972 501
the VLDL are of two kinds (12). One is the normal variety having the usual triglyceride-to-cholesterol ratio of about five. The other form is unique in having beta mobility on electrophoresis and an abnormally high content of cholesterol relative to triglyceride. Division of the total plasma triglyceride concentration by the factor five yields a falsely low value for the “VLDL” and falsely high value for the “LDL” contribution to the total plasma cholesterol. Thus, when this formula is used, a Type III patient may be falsely classified as a Type II. The anomalous lipoproteins in Type III are detectable with certainty only by ultracentrifugal isolation of VLDL and determination of either its electrophoretic mobility or cholesterol and triglyceride content (1-3). Third, CLDL cannot always be accurately estimated when the plasma triglyceride concentration exceeds 400 mg/100 ml. It is noteworthy, however, that only two of the 204 Type II patients in this series had triglyceride concentrations of 400 mg/ 100 ml or greater. This suggests that few errors in classification would occur if patients with plasma triglycerides exceeding 400 mg/100 ml, in the absence of chylomicrons, were directly classified as Type IV. The frequency of this misclassification will no doubt depend in part on the cut-off limits used in defining an abnormal LDL concentration. It is noteworthy that despite the good agreement between the estimation and actual measurement of CLDL, simple division of the plasma triglyceride by five does not give a very accurate estimate of the VLDL cholesterol alone, even in normals or patients with Type II or Type IV. In normals and patients with Type II the average VLDL cholesterol concentration is low (see Table 1), and thus even small absolute errors yield large percentage errors. In Type IV the average VLDL cholesterol concentration is higher, but large percentage errors still result. However, when the estimate of CVLDL is used to calculate CLDL the percentage error does decrease to an acceptable level because the absolute error in CVLDL estimation is small relative to the concentration of CLDL. Of some concern is the number of Type IV patients with relatively large values for ILDLU-
502 CLINICAL CHEMISTRY, Vol. 18, No. 6, 1972
(see Table 2 and Figure 3), which of course greatly influences the per cent error of the whole group. To examine this problem more closely, we identified all Type IV patients with an ILDLULDLEI value greater than 20 mg/100 ml and their entire laboratory profile on tape was reevaluated. Of the 16 people so examined, 13 had evidence of an undetected methodological error identified by a large disparity between the actual indirect and direct measurements of CVLDL (see Methods). This suggests the possibility that the larger percentage error seen in the Type IV patients may be due in part to laboratory errors in the ultracentrifuge calculation of LDL cholesterol rather than greater inaccuracy of the estimation procedure. LDLEJ
References 1. Fredrickson, D. S., Levy, R. I., and Lees, R. S., Fat trans.port in lipoproteins-an integrated approach to mechanisms and disorders. New Engi. J. Med. 276, 32, 94, 148, 215, 273 (1967). 2. Fredrickson, D. S., and Levy, R. I., Familial hyperlipoproteinemia. Chap. 28 in The Metabolic Basis of Inherited Disease, 3rd ed., McGraw-Hill, New York, N. Y. 1972, p 531. 3. Beaumont, J. L., Carlson, L. A., Cooper, G. R., Fejfar, Z., Fredrickson, D. S., and Strasser, T., Classification of hyperlipidaemias and hyperlypoproteinemias. Bull. WHO 43, 891 (1970). 4. Hatch, lipoprotein 5. Total Technicon
F. T., and Lees, R. S., Practical methods analysis. Advan. Lipid Res. 6, 1 (1968). cholesterol procedure N-24b. Auto-Analyzer
for plasma
Manual, Instruments Corp., Tarrytown, N. Y., 1964. 6. Kessler, G., and Lederer, H., Fluorometric measurement of triglycerides. In Automation in Analytical Chemistry, Technicon Symposic 1965, L. T. Skeggs, Jr., et al., Eds. Mediad, New York, 1966, p 341. 7. Fredrickson, D. S., Levy, parison of heritable abnormal two different techniques. J.
R. I., and lipoprotein Clin. Invest.
Lindgren, patterns 47, 2446
F. T., A comas defined by (1968).
8. Draper, N. R., and Smith, H., Applied Regression Analysis, John Wiley and Sons, Inc., New York, N. Y., 1966, p 33. W. J., and Massey, F. J., Jr., Introduction to Statistical Analysis, McGraw-Hill, New York, N. Y., 1957, p 127. 10. Dixon, W. J., and Massey, F. J., Jr., Introduction to Sta9. Dixon,
tistical
Analysis,
11. Draper, John Wiley
McGraw-Hill,
New
York,
N. Y., 1957,
p 130.
N. R., and Smith, H., Applied Regression Analysis, and Sons, Inc., New York, N. Y., 1966, p 7.
12. Quarfordt, S., Levy, R. I., and Fredrickson, D. S., On the lipoprotein abnormality in Type III hyperlipoproteinemia. J. Clin. Invest. 50, 754 (1971).