PHARMACODYNAMICS OF IV CITALOPRAM USING FUNCTIONAL MRI
by Kristin L. Bigos Bachelor of Science, Pennsylvania State University, 2001
Submitted to the Graduate Faculty of the School of Pharmacy in partial fulfillment of the requirements for the degree of Doctor of Philosophy
University of Pittsburgh 2007
UNIVERSITY OF PITTSBURGH SCHOOL OF PHARMACY
This dissertation was presented by Kristin L. Bigos
It was defended on March 14, 2007 and approved by Robert R. Bies, PharmD, PhD Major Advisor Bruce G. Pollock, MD, PhD Co-Advisor Howard J. Aizenstein, MD, PhD Ahmad R. Hariri, PhD Randall B. Smith, PhD Wen Xie, MD, PhD
ii
Copyright © by Kristin L. Bigos 2007
iii
ACKNOWLEDGMENTS
I would like to acknowledge the support of many people who made this project a success. First I would like to thank my advisor, Robert R. Bies, PharmD, PhD, for his guidance and friendship, and for always standing beside me no matter what happened. I would like to thank my coadvisor Bruce G. Pollock, MD, PhD, for always believing in me and for teaching me that “if you do research in a careful and systematic way, you always learn something valuable.” I would also like to thank my committee members for their support:
Howard J. Aizenstein, MD, PhD
(especially for being there for every scan), Ahmad R. Hariri, PhD (for helping me keep it all in perspective), Randall B. Smith, PhD (for getting me into this in the first place), and Wen Xie, MD, PhD (for always being positive). I would also like to thank Robert E. Ferrell, PhD, for his expertise in human genetics as well as his friendship (F&F).
I would like to thank my colleagues at the School of Pharmacy for the friendship and time we have shared together, especially Patricia D. Kroboth, PhD, Maggie Folan, PhD, and Tanya J. Fabian, PharmD, PhD, Samuel M. Poloyac, PharmD, PhD, Sharon Corey, PhD, Susan Price, Barb Belardi, and Lori Schmotzer.
Special appreciation goes to the following people for their support of this project: Joan M. Lakoski, PhD, Sarah Brown, Jeffrey James, Laura Mazurkewicz, Raghu R. Tadikamalla, MD (for reading many, many ECGs), Denise Sorisio (for analyzing the citalopram samples), Mary Ann Hall (for patience and understanding), and Maggie Kirshner (for technical expertise). To Patrick Fisher, who has taught me pretty much everything I know about analyzing fMRI data,
iv
but what I value most is our friendship. I would like to thank the staff of the General Clinical Research Center, especially Brenda, Carol, Jackie, Jill, Rich, and Jeanie. I would like to thank the staff of the Magnetic Resonance Research Center, especially, Lee, Joyce, Tom, Amy, and Denise. I would like to thank the research subjects who volunteered their time to be a part of this study.
My sincere appreciation goes to the following graduate students for their support and friendship: Marci L. Chew, Michael A. Tortorici, Yan Feng, and Julie A. Miedlar. To my undergraduate classmates, Kimberly Perozzi, Suzanne Neve, Jade Eckenrode, and a special thanks to Monika Wyganowska (courage ♦ wisdom ♦ honesty ♦ strength ♦), and Drs. Vu Ho and Megan M. Merrill (we did it!). To my shipmates Meegan LeMott, Martine Etschmaier, Mary Gerut, and Jonelle Horn (the best group of girlfriends in the whole WORLD). To the blue girls, Tracy Pelkowski, Lisa Lenore, Sally Sherman, and Amanda Schneider, for keeping me balanced. To my physician Raquel A. Buranosky, MD, MPH, for teaching me the art of healing through caring for my body and mind. To my friends, Kristin L. Wagner (who has been like a sister to me for almost 25 years), Shelby L. Corman (the best writer I know, thank you for your help in writing this and my first grant), Beth A. Labriola (thank you for being a friend), John D. Prendergast (my best friend at Pitt, it wouldn’t have been the same without you), Karen D. Prendergast (for her enthusiasm for life), Allison M. Murray (my friend since before birth, you still have more degrees than me!), Nancy Januszewski (my angel), and Patricia V. Symonds (the best teacher I’ve ever had). To Gina M. Desko (my wonder twin), for holding my hand and reminding me to just keep swimming, I will always be grateful.
v
Thank you to my family for always being there for me. To my father, William D. Bigos, PhD, and step-mother Linda J. Bigos, DEd, for making me believe this was possible. To my grandparents, Ruth and Leonard Zemaitis, and Geno and Lydia Coll, for being such a good example. To my nieces and nephews, Katie, Michael, Sam, and Rebecca, for always reminding me what is really important in life, and of course to their parents David, Staci, Mark and Bethany. To my brother Michael Bigos, for always providing me with comic relief. To my mom, Ginny Zemaitis, who is my biggest fan. I couldn’t be luckier than to have you for my mom, and my best friend. Thank you. To Michael A. Zemaitis, PhD, not many children are lucky enough to have their dad in an office right down the hall. I could never thank you enough. We did this one together! To Maya and Benny, for their companionship. To God, for putting all of these wonderful people in my life and for giving me the ability to do this work. I dedicate this work to my grandmothers, Caroline Gallagher and Elizabeth Bigos, who taught me most of the really valuable lessons in life.
vi
“Discovery consists of seeing what everybody has seen and thinking what nobody has thought.” Albert Szent-Györgyi, MD
vii
PHARMACODYNAMICS OF IV CITALOPRAM USING FUNCTIONAL MRI Kristin L. Bigos, PhD University of Pittsburgh, 2007
Although much is known about the role of serotonin (5-HT) in the pathophysiology of depression, little is known about the temporal and regional brain alterations in 5-HT as they relate to the treatment of depression and anxiety. This study aimed to evaluate the acute effects of the selective serotonin reuptake inhibitor (SSRI), citalopram, on neuronal activation elicited during an emotional task using functional MRI (fMRI) in healthy subjects. Eight healthy men completed the double-blind placebo-controlled crossover study of citalopram (20 mg infused over 30 min) and normal saline.
Subjects performed the emotional task once before
drug/placebo infusion (Faces 1) and twice during drug/placebo infusion, once early in the infusion (Faces 2) and once at the end of infusion (Faces 3).
A main effect of task was found in the L and R amygdala. A cluster in the right amygdala had increased activation for the Faces 2 task during the citalopram infusion, compared to the baseline Faces 1 task. An even greater bilateral amygdala response to citalopram was found at the end of infusion (Faces 3), when the citalopram concentrations approach their maxima, compared to the baseline Faces 1 task.
This suggests that acute citalopram administration potentiates the
amygdala response to emotional stimuli. An exploratory analysis was done using serotonin transporter genotype as a covariate. S allele carriers (2 s/s and 3 s/l) had a greater baseline
viii
amygdala response than l/l (n=3) homozygotes. However l/l homozygotes had a greater response to citalopram, comparing the Faces 3 to the Faces 1 task.
This study generated the first in vivo human data regarding the regional effects of acute intravenous SSRI administration on affective task-related neuronal activation. An understanding of the regional effects of SSRIs may aid in understanding the mechanism by which these agents produce their therapeutic effects. By including 5-HTTLPR genotype in the analyses, we may account for some of the variability in response to citalopram and other SSRIs. These efforts contribute to the identification of biological mechanisms and pathways that mediate response to SSRIs, and contribute to our understanding of individual differences in complex behaviors and vulnerability to psychiatric illnesses.
ix
TABLE OF CONTENTS ACKNOWLEDGMENTS ............................................................................................................. iv PREFACE ..................................................................................................................................... xv 1. Pharmacokinetics and Pharmacodynamics of Psychotropics ................................................. 1 1.1. Introduction..................................................................................................................... 2 1.2. Pharmacodynamics ......................................................................................................... 2 1.3. Pharmacokinetics ............................................................................................................ 3 1.4. Sex Differences in the Pharmacokinetics and Pharmacodynamics of Psychotropics..... 5 1.4.1. Methods................................................................................................................... 6 1.4.2. Antidepressants ....................................................................................................... 6 1.4.2.1. Sex-related Differences in Clinical Characteristics of Depression................. 6 1.4.2.2. Pharmacokinetics of Antidepressants ............................................................. 7 1.4.2.3. Pharmacodynamics of Antidepressants ........................................................ 12 1.4.3. Antipsychotics....................................................................................................... 18 1.4.3.1. Sex-related Differences in Clinical Characteristics of Psychotic Disorders. 18 1.4.3.2. Pharmacokinetics of Antipsychotics............................................................. 19 1.4.3.3. Pharmacodynamics of Antipsychotics.......................................................... 21 1.4.4. Anxiolytics............................................................................................................ 24 1.4.4.1. Sex-related Differences in Clinical Characteristics of Anxiety Disorders ... 24 1.4.4.2. Pharmacokinetics of Anxiolytics .................................................................. 25 1.4.4.3. Pharmacodynamics of Anxiolytics ............................................................... 26 1.4.5. Antimania Medications......................................................................................... 29 1.4.5.1. Sex-related Differences in Clinical Characteristics of Mania and Bipolar... 29 Disorders ........................................................................................................................... 29 1.4.5.2. Pharmacokinetics and Pharmacodynamics of Antimania Agents ................ 30 1.4.6. Summary ............................................................................................................... 30 1.5. Population Pharmacokinetics in Geriatric Psychiatry................................................... 32 1.5.1. Classical Pharmacokinetic Modeling.................................................................... 33 1.5.2. Population Pharmacokinetic Modeling................................................................. 35 1.5.3. Examples of Population Pharmacokinetic Studies ............................................... 40 1.5.3.1. Pharmacokinetic Characterization and Covariate Analysis.......................... 40 1.5.3.2. Identification of Drug Interactions................................................................ 41 1.5.3.3. Therapeutic Drug Monitoring ....................................................................... 42 1.5.3.4. Determining Consistency of Drug Exposure ................................................ 43 1.5.4. Population Pharmacokinetic Examples in Geriatric Psychiatry ........................... 44 1.5.4.1. Pharmacokinetic Characterization and Covariate Analysis.......................... 44 1.5.4.2. Identification of Drug Interactions................................................................ 49 1.5.4.3. Determining Consistency of Exposure and Clinical Trial Simulation.......... 49 1.5.5. Summary ............................................................................................................... 51 1.6. Population Pharmacokinetics of Olanzapine ................................................................ 53 x
1.6.1. Introduction........................................................................................................... 53 1.6.2. Methods................................................................................................................. 55 1.6.2.1. Participants and Interventions....................................................................... 55 1.6.2.2. Analytical Procedures ................................................................................... 55 1.6.2.3. Population Pharmacokinetic Analysis .......................................................... 56 1.6.2.4. Statistical Analyses ....................................................................................... 57 1.6.3. Results................................................................................................................... 58 1.6.4. Discussion ............................................................................................................. 63 1.7. Summary ....................................................................................................................... 66 2. Introduction to Citalopram Pharmacodynamics ................................................................... 67 2.1. The Serotonergic System .............................................................................................. 68 2.2. Selective Serotonin Reuptake Inhibitors....................................................................... 68 2.3. Citalopram..................................................................................................................... 69 2.4. Functional Magnetic Resonance Imaging..................................................................... 71 2.5. Serotonin Transporter Genetics .................................................................................... 73 2.6. Summary ....................................................................................................................... 75 3. Methods................................................................................................................................. 77 3.1. Specific Aims................................................................................................................ 78 3.2. Drug Information .......................................................................................................... 79 3.3. Design and Overview.................................................................................................... 79 3.4. Screening Visit.............................................................................................................. 80 3.5. Study Visits................................................................................................................... 82 3.6. fMRI Tasks ................................................................................................................... 83 3.7. Scanning Procedures..................................................................................................... 86 3.8. Analytical Procedures ................................................................................................... 87 3.9. Genotyping.................................................................................................................... 87 3.10. Functional Magnetic Resonance Image Analysis ..................................................... 88 3.10.1. Data Preprocessing................................................................................................ 88 3.10.2. Region of Interest Analysis................................................................................... 88 3.11. Pharmacokinetic Analysis......................................................................................... 89 4. The Effects of Citalopram on Neuronal Activity.................................................................. 91 4.1. Demographics ............................................................................................................... 92 4.2. Adverse Effects............................................................................................................. 93 4.3. Main Effects of Task..................................................................................................... 95 4.4. Effects of Citalopram on Task-related Neuronal Activity............................................ 99 4.5. Serotonin Transporter Polymorphic Modulation of Citalopram Response ................ 104 4.5.1. Effect of 5-HTT Genotype on Baseline Amygdala Reactivity........................... 104 4.5.2. Effect of 5-HTT Genotype on Citalopram Modulation of Amygdala Reactivity107 4.6. Discussion ................................................................................................................... 109 5. Pharmacokinetic/Pharmacodynamic Modeling of Citalopram........................................... 111 5.1. Citalopram Pharmacokinetics ..................................................................................... 112 5.2. Correlation Between Citalopram Concentration and Amygdala Activity .................. 116 5.3. Discussion ................................................................................................................... 118 6. Conclusions......................................................................................................................... 119 APPENDIX A............................................................................................................................. 123 APPENDIX B ............................................................................................................................. 127 xi
APPENDIX C ............................................................................................................................. 161 APPENDIX D............................................................................................................................. 163 APPENDIX E ............................................................................................................................. 165 REFERENCES ........................................................................................................................... 169
xii
LIST OF TABLES Table 1.1. Sex differences in the pharmacokinetics of antidepressants ........................................ 8 Table 1.2. Sex differences in the pharmacodynamics of antidepressants ................................... 12 Table 1.3. Sex differences in the pharmacokinetics of antipsychotics........................................ 20 Table 1.4. Sex differences in the pharmacodynamics of antipsychotics..................................... 21 Table 1.5. Sex differences in the pharmacokinetics of anxiolytics............................................. 25 Table 1.6. Sex differences in the pharmacodynamics of anxiolytics .......................................... 26 Table 1.7. Advantages and disadvantages of classical vs. population pharmacokinetic modeling ............................................................................................................................................... 36 Table 1.8. CATIE patient demographics..................................................................................... 58 Table 1.9. Olanzapine pharmacokinetic parameters ................................................................... 59 Table 1.10. Olanzapine clearance by population ........................................................................ 59 Table 1.11. Olanzapine clearance by race................................................................................... 60 Table 3.1. Treatment randomization ........................................................................................... 80 Table 4.1. Citalopram symptoms during study visit ................................................................... 93 Table 4.2. Citalopram symptoms one-week after study visit...................................................... 94 Table 4.3. Main effect of task in the amygdala (faces > shapes) ................................................ 96 Table 4.4. Main effect of task in BA11 (faces > shapes) ............................................................ 96 Table 4.5. Main effect of task in BA47 (faces > shapes) ............................................................ 97 Table 4.6. Main effect of task in BA25 (faces > shapes) ............................................................ 98 Table 4.7. Acute citalopram increases R amygdala activation (Faces 2 > Faces 1) ................. 100 Table 4.8. Acute citalopram increases bilateral amygdala activation (Faces 3 > Faces 1)....... 101 Table 4.9. L amygdala activation decreases during early placebo condition (Faces 2 < Faces 1) ............................................................................................................................................. 102 Table 4.10. R amygdala activation increases during late placebo condition (Faces 3 > Faces 1) ............................................................................................................................................. 103 Table 4.11. S allele carriers have a greater baseline amygdala response compared to l/l homozygotes ....................................................................................................................... 105 Table 4.12. Citalopram effect on amygdala reactivity (Faces 3 > Faces 1) in l/l homozygotes108 Table 4.13. Citalopram effect on amygdala reactivity (Faces 3 > Faces 1) in s allele carriers. 109 Table 5.1. Citalopram pharmacokinetic parameters.................................................................. 113 Table 5.2. Right amygdala activation correlates with citalopram concentration statistics ....... 116
xiii
LIST OF FIGURES Figure 1.1. Sources of variability in general patient populations ................................................. 4 Figure 1.2. Estrogen and antidepresssants .................................................................................. 15 Figure 1.3. Classical and population pharmacokinetic methods................................................. 38 Figure 1.4. Olanzapine clearance by smoking status .................................................................. 61 Figure 1.5. Olanzapine clearance by sex..................................................................................... 61 Figure 1.6. Olanzapine clearance by race ................................................................................... 62 Figure 1.7. Combined effect of smoking, sex, and race on olanzapine clearance ...................... 62 Figure 3.1. Study design ............................................................................................................. 82 Figure 3.2. Emotional stimuli ..................................................................................................... 84 Figure 3.3. Sensorimotor stimuli................................................................................................. 85 Figure 4.1. Group map of main effect of task in R and L amygdala (faces > shapes)................ 95 Figure 4.2. Group map of main effect of task in BA11 (faces > shapes) ................................... 96 Figure 4.3. Group map of main effect of task in L and R BA47 (faces > shapes)...................... 97 Figure 4.4. Group map of main effect of task in BA25 (faces > shapes) ................................... 98 Figure 4.5. Acute citalopram increases R amygdala activation (Faces 2 > Faces 1)................ 100 Figure 4.6. Acute citalopram increases bilateral amygdala activation (Faces 3 > Faces 1) ..... 101 Figure 4.7. L amygdala activation decreases during early placebo condition (Faces 2 < Faces 1) ............................................................................................................................................. 102 Figure 4.8. R amygdala activation increases during late placebo condition (Faces 3 > Faces 1) ............................................................................................................................................. 103 Figure 4.9. S allele carriers have an increased baseline amygdala response compared to l/l homozygotes ....................................................................................................................... 105 Figure 4.10. Baseline L amygdala activity by genotype........................................................... 106 Figure 4.11. Baseline R amygdala activity by genotype........................................................... 106 Figure 4.12. Citalopram effect on amygdala reactivity (Faces 3 > Faces 1) in l/l homozygotes ............................................................................................................................................. 107 Figure 4.13. Citalopram effect on amygdala reactivity (Faces 3 > Faces 1) in s allele carriers108 Figure 5.1. Citalopram pharmacokinetics ................................................................................. 114 Figure 5.2. Individual pharmacokinetic profiles....................................................................... 115 Figure 5.3. Right amygdala activation correlates with citalopram concentration .................... 116 Figure 5.4. Linear regression of right amygdala activation (local maximum) with citalopram concentration....................................................................................................................... 117 Figure 5.5. Linear regression of right amygdala activation (cluster average) with citalopram concentration....................................................................................................................... 118
xiv
PREFACE
This research study was supported by a National Institute of Mental Health (NIMH) National Research Service Award (F31MH076420). This research was also supported by a NIMH senior career development award (K24MH065416) awarded to Dr. Bruce Pollock.
Other support
included NIH grants K23MH064678, K01MH072837, P41EB001975, and a grant from NARSAD. The General Clinical Research Center of the University of Pittsburgh Medical Center supported this research through a NIH National Center for Research Resources Grant (MO1RR000056). Twenty hours of scan time were allocated for this study by the University of Pittsburgh Magnetic Resonance Research Center as part of the Pilot Imaging Program. The American Foundation for Pharmaceutical Education provided training support through predoctoral fellowships.
Development of the MacBrain Face Stimulus Set was overseen by Nim Tottenham and supported by the John D. and Catherine T. MacArthur Foundation Research Network on Early Experience and Brain Development. Please contact Nim Tottenham at
[email protected] for more information concerning the stimulus set.
xv
1. Pharmacokinetics and Pharmacodynamics of Psychotropics
1
1.1.
Introduction
Currently available treatments for psychiatric illnesses are derivatives in one way or another of a serendipitous discovery, rather than the result of incorporating principles of pharmacology with fundamental knowledge of disease.12
Many of the current biological theories about the
pathophysiology of psychiatric illnesses have developed from pharmacological studies of the mechanisms of action of available psychiatric medications.
Because of this, the neuronal
pathways through which these treatments alter mood or behavior are poorly understood. This body of work aims to begin to determine the way in which psychiatric medications modify brain circuitries related to mood and behavior.
Specifically, this dissertation focuses on the
pharmacodynamics of psychotropics, with an emphasis on the neuronal effects of the selective serotonin reuptake inhibitor, citalopram.
1.2. Pharmacodynamics
There is considerable individual variability in response to drugs. A goal of pharmacodynamics, the study of the processes that occur between the administration of a drug and the pharmacological response,13 is to understand and explain some of the this variability. Several mathematical models have been used to describe the relationship between drug concentration and response.
2
The most common model is known as the Emax model:13
E = (Emax * C) / (EC50 + C)
where: E is the intensity of the pharmacological effect, Emax is the maximal pharmacological intensity, C is the concentration of the drug at the time of the effect, and EC50 is the concentration at which the effect is 50% of the Emax. Most of the models described in the following chapters have been developed using more sophisticated mathematical modeling, which is often necessary in order to describe complicated biological systems. The following section describes the use of pharmacokinetics, which is defined as the mathematical description of the concentration time profile, can be a useful link to understanding response and/or toxicity.
1.3. Pharmacokinetics
Pharmacokinetics involves the processes of absorption, distribution, metabolism, and excretion of drugs, and can be expressed mathematically to relate time and drug dose to the drug concentration. Therefore pharmacokinetics is important in the selection and administration of a drug, as well as its dose and dosage form.
Pharmacokinetic parameters include drug
concentration (typically measured in plasma or serum), volume of distribution, and clearance. Volume of distribution (Vd) is a measure of the apparent space in the body into which the drug distributes, thus it relates the amount of drug in the body to the concentration of the drug in the blood or plasma. Clearance (Cl) reflects the rate of elimination of the drug from the body. The rate of elimination of a drug from the body is often characterized by its half-life (t½), which is a
3
derived parameter that depends on both the clearance and volume of distribution of the drug. Half-life describes the time required to eliminate half of the drug in the body. These descriptors of drug exposure can be determined by modeling drug concentration measurements.
Pharmacokinetics and pharmacodynamics are used to study factors that contribute to variability in drug response. Two well-known variables, sex and age, are discussed in the following sections. Other covariates, secondary variables that can affect the relationship between the dependent and independent variables of primary interest, include race, genetic polymorphisms, comorbid illness, and concomitant medications. Figure 1.1 highlights the sources of variability in the general patient population.
The following section highlights the differences in
pharmacokinetics and pharmacodynamics due to sex.
Figure 1.1. Sources of variability in general patient populations.
By: Katie Rose Zemaitis© 2007
4
1.4. Sex Differences in the Pharmacokinetics and Pharmacodynamics of Psychotropics
Historically, women of childbearing age have been excluded from pharmacokinetic and pharmacodynamic studies; therefore, psychotropics and most other medications have been developed without regard for potential sex differences.14-18 Women are clearly different from men in their clinical characteristics of psychiatric illness and their response to treatment. Depressive disorders are 2 to 3 times more common in women,19 and more often present with atypical symptoms.20 Schizophrenic women have a later disease onset and a better response to antipsychotics than schizophrenic men.17, 21-26 Nearly twice as many women as men suffer from anxiety disorders, and anxiolytics are prescribed almost twice as often for women.27 Women with bipolar disorder are more likely to present with features that may predict poor prognosis, including depression and rapid cycling.28,
29
Physiological factors can also affect the
pharmacokinetics of psychotropics between women and men including differences in body weight and composition, metabolizing enzymes, and hormone concentrations. Ignoring these sex differences during drug development may lead to increased adverse reactions or an inadequate response in women or men.14,
30, 31
This section addresses known sex differences in the
pharmacokinetics and pharmacodynamics of psychotropics (antidepressants, antipsychotics, antianxiety agents, and antimania agents), as well as specific issues that face women with psychiatric illness. This review reflects the paucity of data and highlights the need for more research in this area.
5
1.4.1.
Methods
A literature search was performed using several sources including: MEDLINE® searches (1966 through week 3 of March 2003) using the keywords: sex, gender, antidepressants, antipsychotics, anxiolytics, antimania and mood-stabilizing agents in various combinations; and a search of the 57th edition of the Physicians Desk Reference (2003)32 for each psychotropic. Although the data are limited, sex differences in pharmacokinetics have been shown for several antidepressants (Table 1.1), antipsychotics (Table 1.3), and anxiolytics (Table 1.5). There is also evidence for sex related pharmacodynamic differences, including response rates and adverse effects, for antidepressants (Table 1.2), antipsychotics (Table 1.4), and anxiolytics (Table 1.6). Data on the pharmacokinetic and pharmacodynamic sex differences in antimania agents are limited. These data are outlined in the text below.
1.4.2.
1.4.2.1.
Antidepressants
Sex-related Differences in Clinical Characteristics of Depression
There are marked sex differences in the epidemiology of depression between men and women. Women suffer from major depressive disorder (MDD) at least twice as often as men,33 and exhibit more atypical symptoms of depression, with greater somatization, increased suicide attempts, and comorbid anxiety.34, 35 Men however tend to have more comorbid alcohol or drug abuse and completed suicides than women.34, 35 Between 20 and 30% of women report elevated levels of depressive symptomatology during pregnancy and in the postpartum, and the
6
prevalence of depression is approximately 10% prepartum and 7% postpartum.36 Cyclic changes in mood, as evidenced by premenstrual dysphoric disorder (PMDD) and premenstrual syndrome (PMS), suggest that mood can fluctuate as hormone levels cycle.37,
38
Serotonin (5-
hydroxytryptophan; 5-HT) levels parallel changes in estrogen, which may provide a rationale for pulse dosing of antidepressants6, 39-42 or may actually exacerbate side effects in PMDD.43
1.4.2.2.
Pharmacokinetics of Antidepressants
Physiological differences that may affect pharmacokinetics include average body weight, body water distribution, and the affinity and/or capacity of metabolizing enzymes for the administered drug.
Concomitant medications may also affect the metabolizing pathways for various
hormones. The resulting changes in hormone concentrations could contribute to attenuated responses, the occurrence of an adverse event, or have a neuroprotective effect.44-48 Nonmetabolic factors that affect drug disposition include absorption, distribution (including protein binding) and elimination. This section reviews the sex differences in these pharmacokinetic parameters and their potential impact on antidepressant drug disposition, which are summarized in Table 1.1.
7
Table 1.1. Sex differences in the pharmacokinetics of antidepressants ANTIDEPRESSANT TCAs Clomipramine Desipramine Nortriptyline SSRIs Citalopram
Fluvoxamine
Sertraline
SEX DIFFERENCES Tricyclic Antidepressants Women have higher concentrations of desmethylclomipramine (DMC) and lower hydroxylation rates of clomipramine. Women have higher DMC levels and DMC/8-HDMC at 8 h.49 No effect of sex on desipramine clearance in adolescents50 Women have higher steady state nortriptyline levels, and different nortriptyline to hydroxynortriptyline ratios than men51 Selective Serotonin Reuptake Inhibitors Three studies (n=32) showed 1.5 to 2 times higher AUC for women compared to men32 Dose-corrected concentrations are higher in female adolescents compared to males52 Girls (6 to 11 years) have 3 times higher AUC and Cmax than boys. Sex difference does not persist in adolescence.32 Men have more pronounced concentration increase with dose doubling after 14 weeks of treatment than women (4.6 vs. 2.4 fold)53 Men have 40% to 50% lower plasma drug concentrations54 Desmethylsertraline clearance decreases in older men but not in older women32 Young women, elderly men, and elderly women have similar terminal elimination (t½ 32-37 h), which are greater than those in young men (22 h)55
Others Bupropion
Adolescent women have higher AUC, Cmax, Vd, t½ of parent, and AUC of metabolite, but no difference in apparent clearance (Cl/F)56 Elderly women have a longer t½, larger Vd, and lower Cl than young men57 Mirtazapine Women have a longer t½ (37 hours vs. 26 hours)32 Men have 50% lower plasma concentrations than women58, 59 Nefazodone Women have higher Cmax and AUC after first dose, but differences are not found with multiple dosing32 Nefazodone and hydroxynefazodone levels 50% higher in elderly women compared to elderly men, young men, and young women.60 Doses may need to be increased in the 2nd and 3rd trimesters of pregnancy61 Trazodone Elderly women have a longer t½ (7.6 h) compared to young women (5.9 h), secondary to increased Vd62 Venlafaxine No sex differences reported32 *Table legend: area under the curve (AUC), maximum concentration (Cmax), half-life (t½), volume of distribution (Vd), clearance (Cl), bioavailability (F)
8
Most antidepressants are weak bases and therefore are more effectively absorbed under basic conditions. Women secrete less gastric acid resulting in a more basic environment, which could potentially lead to an enhanced absorption of antidepressants in the stomach.63 Women have a slower rate of gastric emptying than men thus increasing antidepressant absorption time.64 This increase persists even after menopause and is accentuated by exogenous estrogen and progesterone.64,
65
Colonic transit times are also prolonged in women, giving the compounds
more time to be absorbed in an environment where the pH favors absorption of weak bases. In spite of these differences, bioavailability has not been shown to be greater in women, although a larger area under the curve has been found for bupropion,56 citalopram,32 and fluvoxamine.32
The volume of distribution affects the amount of drug exposure at the receptor. There are substantial differences in body composition between men and women that can affect the volume of distribution. In young women, adipose tissue comprises 33% of body weight, compared to 18% in young men.66, 67 In elderly women, 48% of bodyweight is adipose tissue, compared to 36% in old men. 66, 67 Thus for lipophilic drugs, there is a much larger volume of distribution in women, which can result in a prolonged half-life and lower plasma concentrations.
Both
trazodone62 and bupropion57 have a larger volume of distribution in women because of greater body fat, which is further exaggerated in elderly women. An increase in the half-life of a drug could be due primarily to an increase in the volume of distribution as found for trazodone62 or bupropion,57 and/or a change in the clearance of the drug from the body. Sweet illustrated how the change in half-life of bupropion between elderly women and young men could be due to a combination of changes in both the volume of distribution and clearance.57
9
Additionally,
Kristensen found that women (30 to 39 years of age) had significantly lower protein binding of imipramine than men the same age and women of other age groups.68
Drugs used to treat depression are metabolized by, inhibit, and/or induce a wide range of the cytochrome P450 (CYP) enzymes.69
Sex differences in CYP isozyme function that affect
antidepressant clearance have been reported for CYP 3A4 (nefazodone, sertraline, mirtazipine) and CYP 1A2 (fluvoxamine). These differences may be confounded when a drug has a high clearance and/or is a co-substrate for both CYP 3A and the p-glycoprotein multi-drug resistance pump1 (MDR1).70 High clearance (or flow-limited clearance) drugs depend on the rate of blood flow into the eliminating organ (i.e. liver, kidney) and thus indirectly liver size. Women have a smaller liver and a lower liver blood flow rate compared to men, therefore observed sex differences may not be due to metabolic differences, but rather due to differences in blood flow. Similarly, the MDR1 pump provides cytosolic access for the compound to metabolizing enzymes. Thus if one is administered a drug which is a co-substrate for both the CYP 3A4 enzyme and MDR1 pump, an increase in the activity in the MDR1 pump could be mistaken for a decreased CYP 3A metabolizing capacity, and conversely a decrease in MDR1 activity could be mistaken for an increased CYP 3A metabolizing capacity.70 Women have only 30% to 50% of the hepatic expression of p-glycoprotein compared to men,70,
71
and differences have been
reported for the 3A4 metabolized drugs nefazodone,60 sertraline,55 and citalopram.52 Ronfeld reported that the half-life of sertraline is shorter in young men than in young women.55 Reis and colleagues showed that adolescent men had a higher citalopram clearance compared to adolescent women, which is consistent with the possibility of the contribution of liver size (i.e., enzymatic capacity) and/or hepatic blood flow.52 In addition, sex differences in the disposition
10
of the predominately CYP 1A2 metabolized drug, fluvoxamine, have been demonstrated. In these studies, men had lower plasma levels of fluvoxamine than women,54 and the doubling of the fluvoxamine dose while at steady state resulted in a much more dramatic increase in fluvoxamine concentrations in women compared to men.53 Mirtazipine (CYP 3A4, 1A2 and 2D6 metabolized) was reported to have a longer half-life in women compared to men,32 and men had half the mirtazipine concentrations of similarly treated women.58, 59 Another study reported higher concentrations of desmethylclomipramine and lower hydroxylation rates of clomipramine in women compared to men.49 Women have also been found to have higher steady state nortriptyline levels, as well as different nortriptyline to hydroxynortriptyline ratios than men.51
Furthermore antidepressants that inhibit CYP 3A may shift the metabolism of estrogen from CYP 3A to CYP 1A resulting in a decreased production of the highly genotoxic 16-αhydroxyestrone form, possibly resulting in a protective effect.45 Estrogen is a substrate for both CYP 3A4 and CYP 1A2, as well as an inhibitor of CYP 1A2, thus higher levels of endogenous or exogenous estrogens may impact antidepressant metabolism.72
The concomitant
administration of CYP 1A2 metabolized antidepressants could result in higher plasma levels of either the antidepressant or estrogen and therefore a greater risk of adverse events.20, 73, 74 CYP 1A2 activity is decreased during the late luteal phase of the menstrual cycle, which could possibly affect fluvoxamine clearance.75, 76 Lower CYP 1A2 activities have been reported during pregnancy, evidenced by the increase in the half-life of caffeine.77 During pregnancy, higher estrogen and progesterone levels and may affect either CYP 3A4 (induction by progesterone) and CYP 1A2 (inhibition). These changes could affect the clearance of the CYP 3A4 (sertraline, citalopram, trazodone, and fluoxetine) and CYP 1A2 (fluvoxamine, amitriptyline, clomipramine
11
and imipramine) metabolized medications. Total body volume and protein binding are increased during pregnancy, as well as changes in clearance. One study suggests that nortriptyline doses may need to be increased during the 2nd or 3rd trimester.61
1.4.2.3.
Pharmacodynamics of Antidepressants
Sex differences in responses to various classes of antidepressants are summarized in Table 1.2.
Table 1.2. Sex differences in the pharmacodynamics of antidepressants ANTIDEPRESSANT TCAs Amitriptyline Clomipramine Imipramine
SSRIs Citalopram Fluoxetine Paroxetine Sertraline
SEX EFFECTS Tricyclic antidepressants Men respond better than women to TCAs78 Women show more pronounced anti-obsessional effect in response to intravenous administration79 Women have a longer time to response20 Women are more likely to withdraw from therapy on imipramine than on sertraline20 Selective Serotonin Reuptake Inhibitors Response for treatment of alcohol dependence was greater in men (44% decrease) than in women (26% decrease)80 Women of reproductive age (40 years) had a similar response to imipramine, however young men (45 years) are women.107 One study of late paraphrenic patients demonstrated a high female to male ratio (42:5),108 which may be due to the decline in circulating estrogen and relative excess of dopamine receptors.23 It has also been suggested that psychosocial factors may delay the onset of schizophrenic symptoms in women, including better coping behavior strategies and social support.108 The disorganized subtype is the only group where female schizophrenics that have an earlier onset of illness compared to men.109 Neuroleptic-refractory chronic schizophrenic women are thought to be a severely ill subgroup of female schizophrenics with distinct onset of illness, course and treatment response characteristics. One study reported that these women had a similar age of onset to the men and longer duration of illness prior to clozapine initiation.21 Unlike most schizophrenic women,
18
these women did not have a better therapeutic response than men, and had similar pharmacologic indices including prolactin levels and homovanillic acid. Tardive dyskinesia, a manifestation of supersensitive dopamine receptors in the nigrostriatum, is more common in women (26.6%) than men (21.6%),110 and may be a consequence of estrogen withdrawal at menopause.17 Despite the aforementioned differences, symptoms of schizophrenia during acute psychotic episodes do not differ between men and women, either in type or severity.111
NEUROCOGNITION
Several studies have reported differences in neurocognition between male and female schizophrenics. In a study of patients with psychotic disorders, there were sex differences on multiple cognitive indices suggesting that men had a better level of cognitive functioning than women.112 There were no significant sex differences on the estimates of premorbid IQ, however the women showed a significantly greater estimated deterioration in full-scale, verbal, and performance IQ than did the men after a period of untreated psychosis.112 Women also tend to have a greater impairment on measures of conceptualization and attention.113
1.4.3.2.
Pharmacokinetics of Antipsychotics
Sex differences in CYP P450 isozyme function that affect antipsychotic clearance have been reported for CYP 3A4 (clozapine, pimozide, quetiapine, and ziprasidone) and CYP 1A2 (clozapine, olanzapine, pimozide, and ziprasidone). Other antipsychotics are metabolized by CYP 2D6 (clozapine, haloperidol, olanzapine, perphenazine, risperidone, and thioridazine). During pregnancy, the induction of CYP 3A4 and the inhibition of CYP 1A2 may also result in 19
changes in clearance of these drugs. Additionally CYP 1A2 activity is decreased during the late luteal phase of the menstrual cycle and could result in changes in clearance.76 A recent study showed that men required a higher olanzapine dose, 15.8 mg/day to reach the therapeutic concentration of 23.2 ng/mL, than women, who required only 8.6 mg/day;114 however, it is possible that this sex-dose difference could have been due to a disproportionate number of men who smoked, and therefore had greater CYP1A2 metabolism. It has recently been shown that elderly, nonsmoking women have a 60% higher concentration of olanzapine compared to young smoking men.115 Perry and colleagues developed a dosing nomogram for clozapine that included sex and dose-sex interaction as predictors of steady-state clozapine concentration, as shown in Table 1.3.116
Table 1.3. Sex differences in the pharmacokinetics of antipsychotics ANTIPSYCHOTIC Phenothiazines Miscellaneous Clozapine
Olanzapine
SEX DIFFERENCES Sex differences were not addressed in the PDR for chlorpromazine, mesoridazine, prochlorperazine, or trifluoperazine32 Sex differences were not addressed in the PDR for clozapine, haloperidol, loxapine, molindone, perphenazine, pimozide, thoiridazine, thiothixene, or ziprasidone32 These equations were derived to predict clozapine steady-state plasma concentrations to serve as a clozapine-dosing guide for clinicians:116 Men: clozapine (ng/mL) = 111 (smoke) + 0.464 (dose) + 145 Women: clozapine (ng/mL) = 111 (smoke) + 1.590 (dose) – 149 Clearance of olanzapine is approximately 30% lower in women than in men32 Men require a higher olanzapine dose, 15.8 mg/day to reach the therapeutic concentration of 23.2 ng/mL, than women, who require only 8.6 mg/day114
Quetiapine Risperidone
Elderly, nonsmoking women have 60% higher concentrations compared to young smoking men115 No known sex differences32 Population PK analysis did not identify important differences in the disposition of risperidone due to sex32 20
1.4.3.3.
Pharmacodynamics of Antipsychotics
Sex-related effects on the pharmacodynamics of antipsychotics are summarized in Table 1.4.
Table 1.4. Sex differences in the pharmacodynamics of antipsychotics ANTIPSYCHOTICS SEX DIFFERENCES Sex differences were not addressed in the PDR for chlorpromazine, Phenothiazines mesoridazine, prochlorperazine, quetiapine, or trifluoperazine32 Sex differences were not addressed in the PDR for clozapine, haloperidol, Miscellaneous loxapine, molindone, pimozide, thioridazine, or thiothixene32 Clozapine Schizophrenic women responded better than men at 100mg/day of clozapine, but there were no sex differences at doses of 300 or 600mg/day117 Differences in leptin levels were not seen in either the group treated with olanzapine or the group treated with clozapine, which could be due to an increase of leptin in the men that resulted in similar leptin levels118 Olanzapine Weight gain associated with olanzapine or risperidone treatment is positively correlated for male gender119 No apparent differences in effectiveness and adverse effects32 Perphenazine Women treated with conventional antipsychotics (i.e. perphenazine or zuclopenthixol) have significantly higher leptin levels than men in the conventional antipsychotic group118 Risperidone Weight gain associated with olanzapine or risperidone treatment is positively correlated for male gender119 Ziprasidone No known sex differences32
In general, schizophrenic women have a better response to neuroleptics than men. Treatment response occurs sooner (12.1 vs. 42.1 weeks), the dose of neuroleptic required for treatment is lower, and the frequency of nonremission is lower (2% vs. 18%) in schizophrenic women compared to men.111, 120, 121 In one study schizophrenic women responded better than men at 100 mg/day of clozapine, but there were no sex differences at doses of 300 or 600 mg/day.117 Another complication is that patients with schizophrenia smoke more than the general population and more than other psychiatric patients. Medicated schizophrenics who smoke present more 21
symptoms of schizophrenia than non-smokers. In one study, male smokers were more impaired at baseline and up to 2 weeks following antipsychotic withdrawal than nonsmokers, while there were no differences in the female group.122
ANTIPSYCHOTIC-INDUCED WEIGHT GAIN
Weight gain is often an undesired effect of antipsychotic treatment, which often leads to noncompliance and the potential for morbidity. The newer agents, including clozapine and olanzapine, have the greatest potential to induce weight gain.123 The prevalence of obesity is higher in women who are treated with atypical antipsychotics compared to men, as reviewed by Russell and Mackell.124 In addition, women usually have higher levels of the hormone leptin, which is involved in the regulation of body weight.
A study evaluating the effects of
antipsychotics on leptin levels reported that women treated with conventional antipsychotics (i.e. perphenazine or zuclopenthixol) had significantly higher leptin levels than men in the conventional antipsychotic group.118 These differences were not seen in either the group treated with olanzapine or the group treated with clozapine, which could be due to an increase of leptin in the men that resulted in similar levels. One study of weight gain associated with olanzapine or risperidone treatment was positively correlated with male gender.119
HYPERPROLACTINEMIA
The inhibition of prolactin release by dopamine is blocked by some antipsychotics, which can lead to hyperprolactinemia resulting in menstrual disturbances and impotence. A study reported that antipsychotic-induced hyperprolactinemia was more frequent and occurred at a lower daily 22
dose of antipsychotics in women, suggesting a sex-related difference in the sensitivity of the hypothalamic-pituitary system to antipsychotics.125 Another study evaluating the neuroendocrine response to antipsychotics evaluated the influence of drug type and sex on thyrotropin-releasing hormone (TRH) stimulated secretion of prolactin and thyroid-stimulating hormone (TSH).126 Prolactin plasma levels were markedly elevated in both amisulpride and flupenthixol treatment groups, and this elevation was significantly more pronounced with amisulpride compared to flupenthixol in women but not in men.
Additionally, the prolactin response to TRH was
significantly blunted only in the male patients.
23
1.4.4.
1.4.4.1.
Anxiolytics
Sex-related Differences in Clinical Characteristics of Anxiety Disorders
Benzodiazepines are the most widely prescribed psychotropic drugs in the world. Benzodiazepines are indicated for their anxiolytic (alprazolam, clonazepam, clorazepate, cloradiazepoxide, diazepam, lorazepam, and oxazepam) and hypnotic (flurazepam, temazepam, and triazolam) properties by the Food and Drug Administration (FDA). Benzodiazepines are commonly used to treat anxiety disorders which include generalized anxiety disorder, panic disorder, social anxiety disorder, posttraumatic stress disorder, obsessive compulsive disorder (OCD), and severe phobias.127 It is estimated that women are prescribed benzodiazepines almost twice as often as men, which is consistent with the data showing that women have twice the prevalence of anxiety disorders.27 Specifically anxiolytic benzodiazepine users are significantly more often women than men, whereas hypnotic users are more likely to be male.27 Selective serotonin reuptake inhibitors (SSRIs), which are effective antidepressants, are also powerful antianxiety agents and therefore often used to treat some anxiety disorders. Sex differences in SSRIs are detailed earlier in the section on antidepressants, and therefore, are not covered here.
Menstrual cycle, pregnancy, or childbirth can be a precipitating or exacerbating factors in anxiety disorders, especially OCD.128 One study found that 42% of women with OCD had a premenstrual worsening of their symptoms, 21% described premenstrual dysphoria, and 29% reported postpartum exacerbation of OCD symptoms.129 Additionally, women with OCD may
24
be at increased risk for postpartum depression, which merits further evaluation to reduce maternal and infant morbidity.
1.4.4.2.
Pharmacokinetics of Anxiolytics
Sex differences in the pharmacokinetics of anxiolytics are summarized in Table 1.5.
Table 1.5. Sex differences in the pharmacokinetics of anxiolytics ANXIOLYTIC Benzodiazepines Alprazolam Diazepam Oxazepam Triazolam
Temazepam
Other Buspirone
SEX DIFFERENCES Sex differences were not addressed in the PDR for the pharmacokinetics or pharmacodynamics of alprazolam, diazepam, clorazepate, midazolam, triazolam32 Most studies have not found differences,130 although one study reported differences in t½ and Cl between women and men131 Women have a larger Vd and a higher intrinsic Cl compared to men130 Men have a higher Cl reflecting a higher activity of UDPGT66 Older women (63 to 78 years) have a shorter t½ (2.41 h) compared to older men (3.38 h)18 Women tend to have higher Cl (8.7 vs. 5.5 mL/kg/min) but no difference in t½132 Older women have a longer t½ (18.4 h) compared to older men (9.9 h), and older women have a reduced Cl (0.74 mL/kg/min) compared to older men (1.41 mL/kg/min)18 Men have a higher Cl reflecting a higher activity of UDPGT133 No significant sex differences have been reported134, 135
Many benzodiazepines (alprazolam, clonazepam, diazepam, midazolam, and triazolam) are metabolized by CYP 3A, which has known sex differences and therefore could affect the clearance of these drugs. Additionally CYP3A4 is induced during pregnancy, which could result in an increased clearance for benzodiazepines, though this has not been reported. A study of the pharmacokinetics of triazolam and temazepam found that older women (63 to 78 years) had a 25
shorter half-life for triazolam (2.41 h) compared to older men (3.38 h).18 Older women had a longer half-life for temazepam (18.4 h) compared to older men (9.9 h), and older women had a reduced clearance (0.74 mL/kg/min) compared to older men (1.41 mL/kg/min).18 The higher clearance of temazepam and oxazepam in men may reflect a higher rate of glucuronidation or a higher level of activity of the uridyl diphosphate glucuronyl transferase (UDPGT) enzyme system, which may result in higher concentrations in women.66, 133 Greenblatt and colleagues have shown that women have a larger volume of distribution for diazepam and a higher intrinsic clearance compared to men.130
1.4.4.3.
Pharmacodynamics of Anxiolytics
Sex-related differences in the pharmacodynamics of anxiolytics are summarized in Table 1.6.
Table 1.6. Sex differences in the pharmacodynamics of anxiolytics ANXIOLYTIC Clonazepam Triazolam
SEX DIFFERENCES No known sex differences32 No evidence for sex differences in pharmacodynamic effects or in the kinetic-dynamic relationship120
Although women are prescribed anxiolytics more often than men and there are observed pharmacokinetic differences, most studies report that response rates are similar between men and women. Despite similar response rates, there are special considerations that need to be addressed when prescribing benzodiazepines to women of childbearing age.
26
EFFECTS IN PREGNANCY
Benzodiazepines may cause fetal malformations when taken during the first trimester of pregnancy. Administration of a benzodiazepine within the last weeks of pregnancy has resulted in central nervous system (CNS) depression in the newborn (Prod Info Halcion®, 1997), and children may be at risk for withdrawal symptoms during the neonatal period.
Most
benzodiazepines (alprazolam, diazepam, clonazepam, chlorazepate, lorazepam, and oxazepam) are considered pregnancy category D, which means that positive evidence of human fetal risk exists, but benefits in certain situations (i.e. life-threatening situations or serious diseases for which safer drugs cannot be used or are ineffective) may make use of the drug acceptable despite its risks. Other benzodiazepines (triazolam and temazepam) are considered pregnancy category X, in which studies in animals or humans have demonstrated fetal abnormalities or there is evidence of fetal risk based on human experience, or both, and the risk clearly outweighs any possible benefit.
LONG-TERM USE AND DEPENDENCE
Long-term use of benzodiazepines may be qualitatively different in women and men. Romach and colleagues studied the clinical characteristics of persistent users of alprazolam or lorazepam who wished to discontinue their medications.136 Male subjects were more numerous in this study, and differed from women in several aspects. These men had histories of alcohol and drug abuse/dependence more often than women, and were consuming more alcohol at the time of assessment. Most of the men had used other benzodiazepines for control of symptoms in the
27
past, used their drug for a shorter length of time, and had made more attempts to stop the use of the medication.
Additionally men experienced symptoms including agitation, tension, and
restlessness, upon discontinuation more frequently than women.
28
1.4.5.
1.4.5.1.
Antimania Medications
Sex-related Differences in Clinical Characteristics of Mania and Bipolar Disorders
Mania is characterized by excessive elation typically accompanied by dysphoria and/or psychotic features, and has symptoms of irritability, severe insomnia, hyperactivity, uncontrollable speech and activity, impaired judgment, and risky behaviors. Mania and bipolar disorder, the mixture of mania and depression, are treated with antipsychotics, anticonvulsants, and/or sedatives. Sex differences in antipsychotics and sedative-antianxiety agents are detailed in earlier sections and therefore will not be covered here.
This section focuses on mood-stabilizing medications
including lithium salts and certain anticonvulsants with mood-stabilizing properties.127
Although men and women have similar lifetime prevalence rates of bipolar disorders, sex differences exist in the phenomenology and course of illness. Women have higher rates of bipolar depression and type II bipolar disorder (depression with hypomania), a greater likelihood of having depression precede mania or hypomania, are more often hospitalized for mania, and have a rapid-cycling course more often than men.28, 29 Because women with bipolar disorder reportedly have more features that may predict a poor prognosis, including depression and rapid cycling, it is particularly important to study response to therapy with regard to sex.
29
1.4.5.2.
Pharmacokinetics and Pharmacodynamics of Antimania Agents
Lithium is a first-line agent for both acute mania and maintenance therapy, despite inducing adverse effects in 35 to 93% of patients who take it.137 During pregnancy, a 30 to 50% increase in renal clearance of lithium has been reported.138 Antiepileptic drugs (phenytoin, phenobarbital, carbamazepine) also appear to be cleared faster during pregnancy.139 Viguera and colleagues studied the response to lithium maintenance therapy, and found that women had a similar response despite significantly lower serum concentrations of lithium.127 Other studies have also reported similar response rates in women and men.140 Despite similar treatment outcomes, women experience different side effects of lithium treatment. Women are more likely to gain weight during the first year of treatment (47% vs. 18%) and are subsequently more likely to develop clinical hypothyroidism (37% vs. 9%), whereas men are more likely to develop tremors (54% vs. 26%).137 Studies have shown that bipolar women are at high risk to have an affective episode during pregnancy and in the postpartum period.29 Both lithium and anticonvulsant mood stabilizers, including valproic acid, are associated with teratogenic risk.
These drugs are
considered pregnancy category D and should be used with great caution in pregnant women.
1.4.6.
Summary
Women are clearly different from men in clinical characteristics of psychiatric illness and their response to treatment. Despite these differences, there has been little research done on the pharmacokinetics and pharmacodynamics of psychotropics in women.14 As a result, funding agencies including the National Institutes of Health have expanded their opportunities for research on women’s health. Population (mixed effects) pharmacokinetic modeling techniques 30
may be useful in evaluating sex differences when concentration data are collected and dosing history and sample timings are known.
Additional information on the teratogenicity of
psychotropics is needed and could be collected using birth registries and long-term follow up as has been done for fluoxetine. As more data become available, clinicians should consider these pharmacokinetic and pharmacodynamic differences between women and men in prescribing psychotropics and evaluating their response.
Acknowledgments:
Parts of this section were previously published: Bies RR, Bigos KL, Pollock BG. Gender Differences in the Pharmacokinetics and Pharmacodynamics of Antidepressants. The Journal of Gender-Specific Medicine. 2003;6(3):12-20,69 and Gender and Antidepressants. In: Legato MJ, ed. Principles of Gender-Specific Medicine. Vol 2. New York: Elsevier Academic Press; 2004:860-868.95 This work was supported by NIH grants MH64173, MH65416, MH52247, MH30915, MH65376, and RR-12609.
31
1.5.
Population Pharmacokinetics in Geriatric Psychiatry
Although geriatric patients are the major recipients of drugs, taking an average of 5 or more mediations each day,141 most research during drug development is conducted in healthy young adults. There is evidence that physiological changes during aging contribute to differences in both drug disposition and response in older individuals compared to young adults.142,
143
Geriatric patients are a heterogeneous population, which is evident in the highly variable drug concentrations and differences in dose-concentration-response relationships.
Adverse drug
events are common in older adults and are often preventable. A cohort study of Medicare enrollees (30,397 person-years) evaluated the incidence and severity of adverse drug events; of the 1523 events identified, 38.0% were serious, life-threatening, or fatal, and 27.6% were considered preventable.144 Another study found that 1 in 6 older patients (aged 70 years and older) admitted to a general ward experienced adverse drug reactions, 24% of which were considered severe reactions.145
Safe and effective drug therapy in the elderly requires an
understanding of both drug disposition and response in older individuals.
More than a decade ago, the Expert Working Group of the International Conference on Harmonisation of Technical Requirements for the Registration of Pharmaceuticals for Human Use (ICH) recognized the paucity of clinical trials in elderly individuals and identified the need for the explicit study of the geriatric population. The ICH developed guidelines for DoseResponse Information to Support Drug Registration (E4)146 and Studies in Support of Special Populations: Geriatrics (E7).147
The U.S. Food and Drug Administration Center for Drug
Evaluation and Research has adopted these as Guidelines for Industry as part of the requirements
32
for drug registration. Unfortunately these documents do not address the heterogeneity in the elderly population and/or the approach to capturing these differences. One of the major issues of studying the elderly relates to the ability to study a large number of people in a minimally invasive way.
Population pharmacokinetics provides a potential means of addressing this
issue.148 Specifically, this section describes the use of population pharmacokinetics to evaluate the magnitude and consistency of drug exposure in the elderly.
Pharmacokinetic studies are typically done in a population of healthy adults, and involve intensive sampling of a small number of subjects. Most studies to date have studied young adults and then extrapolated the data to older adults. Older adults have decreased hepatic and/or renal function compared to younger adults as well as other physiological changes, and therefore direct comparisons cannot be made. Occasionally, younger adults with impaired renal function are used to predict the pharmacokinetics in the elderly, though this ignores other physiological changes that occur with aging.
The goal of population pharmacokinetic modeling is to
characterize and model sources of variability in drug concentration.
1.5.1.
Classical Pharmacokinetic Modeling
Most of the classical pharmacokinetic modeling techniques include averaging or pooling the data.149 The averaging approach, as named, involves the calculation of the average value of the data at each sampling time and then a model is fitted to the mean data. Parameter values can then be determined from this mean profile. This approach requires complete data, as every subject contributes one data point (i.e. plasma concentration) at each time point. Although this method is simple, the model may blunt the concentration-time profile, resulting in poorly 33
estimated parameters. In addition, this approach confounds sources of variability. Pooled data approaches (e.g. naïve pooled method) use a similar method in which all data from all individuals are regarded as coming from a single individual.150 These models perform well when the variations between subjects are small, but like the averaging approaches, they confound different sources of variability.
In general, classical pharmacokinetic modeling requires intense sampling of a small number of subjects (6 to 12 subjects). Classical methods are limited if data are not complete. Additionally the small number of subjects may not be representative of the variability in drug exposure in the population.
There are also limits to this approach if the drug exhibits nonlinear
pharmacokinetics, which means that the drug exhibits different pharmacokinetic characteristics at different doses. This happens when, for example, the capacity to eliminate the drug has been saturated.151 Classical pharmacokinetic approaches use drug concentrations from an individual patient, and therefore it is difficult to discern different sources of variability. This limitation has lead to excluding populations of people that contribute to the variability, including women, minorities, patients with co-morbidities, and the very young and very old.
Sometimes,
individually determined pharmacokinetic characteristics are summarized as a mean and standard deviation, based on estimates determined using classical approaches, to attempt to reflect the variability between subjects. This, however, is subject to the limitations described above. In contrast to the classical approaches, population pharmacokinetics models drug concentrations from a population of patients, and is able to distinguish interindividual (between-subject) and intraindividual (within-subject) variability.
34
1.5.2.
Population Pharmacokinetic Modeling
Population pharmacokinetics is the quantitative assessment of typical pharmacokinetic parameters, and the interindividual, intraindividual, and residual variability in drug concentration.152 Nonlinear mixed-effects modeling approaches analyze the data of a population of patients (i.e. all individuals at once), but take into account each individual uniquely.153 One advantage of population pharmacokinetics is that data can be used from many sparsely sampled individuals, which is often more feasible in the geriatric population than a small number of intensively sampled individuals typical of the classical studies.154-156
Additionally, taking
measurements from a larger number of individuals informs the nature of the interindividual variability to a much better degree than taking many samples in few subjects. Population pharmacokinetic methods use the concept of mixed-effects models (mixed = random + fixed, or varying + constant).
Fixed effects include model parameters (clearance and volume of
distribution) as well as covariates (e.g. age, weight, sex, and race). Random effects include both inter- and intraindividual variability. This type of nonlinear mixed-effects modeling generally uses Bayesian statistics to obtain individual estimates of pharmacokinetic parameters.157 Covariate effects are then assessed using every data point contributed by all of the individuals, thus every individual’s data contributes to the identification of sources of variability. Population pharmacokinetics can ascertain where variability arises, which is important for geriatric patients who often exhibit highly variable drug concentrations. It also allows for different numbers of data points per individual to be incorporated into the model, and can incorporate all available data from various routes of administration to inform the model.158 Population pharmacokinetics can also be used to detect unanticipated drug interactions. These advantages of population pharmacokinetics make it well-suited to analyze sparse data collected 35
from older individuals.
The advantages and limitations of both classical and population
pharmacokinetic modeling are listed in Table 1.7.
Table 1.7. Advantages and disadvantages of classical vs. population pharmacokinetic modeling CLASSICAL PHARMACOKINETIC MODELING Intense data required Precisely timed data required Complete data required Uses averaging or pooling techniques to estimate mean parameters Tends towards an upward bias in estimation of interindividual variability Data must be from same route of administration Confounded if different dosages exhibit different pharmacokinetic characteristics Covariates identified using summary parameters Fairly easy and fast
POPULATION PHARMACOKINETIC MODELING Can use sparse data in many subjects Data can be collected at different time points (i.e. collected during typical clinic visits) Different numbers of data points per individual can be incorporated into the model Uses Bayesian statistics to obtain individual estimates of pharmacokinetic parameters Identifies random and fixed effects to identify sources of variability Can use data from various routes of administration simultaneously Nonlinearities can be easily identified across a range of dosages Covariate effects are assessed using the entire dataset Technically difficult and time intensive
There are several software programs that can be used to model population pharmacokinetic data, the most well-known of these is NONMEM® (GloboMax, Ellicott City, MD); however the use of these programs remains technically difficult and often time intensive. There are newer software packages on the horizon, including System for Population Kinetics (SPK) from the University of Washington (https://spk.rfpk.washington.edu) and WinNonMix® (Pharsight Corporation, Mountain View, CA), which are more graphically driven and more user-friendly, although these are still in relatively early stages of development.
36
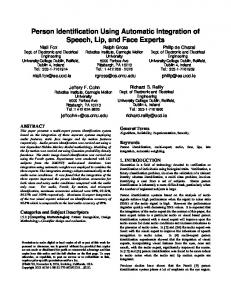
To illustrate the differences between classical and population pharmacokinetic analysis methods, data were generated and then analyzed using both classical and population pharmacokinetic techniques, as shown in Figure 1.3.
37
5 4 3 2 1 0 0
12
24
36
48
60
5 4 3 2 1 0
72
0
12
24
36
48
60
72
TIME (h)
TIME (h)
C. Nonlinear Mixed-Effects Modeling
D. Nonlinear Mixed-Effects Modeling
5
CONCENTRATION (ng/mL)
CONCENTRATION (ng/mL)
B. Individual Nonlinear Regression CONCENTRATION (ng/mL)
CONCENTRATION (ng/mL)
A. Naïve Pooled Method
4 3 2 1 0 0
12
24
36
48
60
72
5 Individual estimates Population estimate
4 3 2 1 0 0
TIME (h)
12
24
36
48
60
72
TIME (h)
Figure 1.3. Classical and population pharmacokinetic methods. The classical pharmacokinetics methods shown are the naïve pooled method (A) and the individual nonlinear regression approach (B). The population pharmacokinetic method (nonlinear mixedeffects modeling) is shown with individual data and the population prediction (data points and solid line respectively; C) as well as with a single individual showing the individual (solid line) and population prediction (dotted line) pharmacokinetic profile (D). 38
Olanzapine concentrations were simulated using WinNonlin® 4.0.1 (Pharsight Corporation, Mountain View, CA), based on pharmacokinetic data adapted from Callaghan et al.,159 as well as data from our laboratory. Specifically, individual sets of pharmacokinetic parameters were generated for 12 individuals based on the reported interindividual variability on the pharmacokinetic parameters in Callaghan et al.
The first example uses a classical
pharmacokinetic analysis approach, the naïve pooled method (panel 1.2 A). These data points enter the non-linear regression and least squares estimation as a single individual and the least squares estimator determines the best parameters for all of the data points together, thus unique patterns within individuals are ignored. No information on the variability across the individuals contributing to the analysis is provided by this approach. Another classical pharmacokinetic approach, the individual nonlinear regression approach (panel 1.2 B), estimates each individual’s pharmacokinetic parameters based on their own concentration measurements over time. This approach can be adapted to estimate population concentrations by summarizing the individually estimated pharmacokinetic parameters with means, medians, or modes and variances. However, these values tend to be upwardly biased and continue to require intense pharmacokinetic sampling to execute successfully. Population pharmacokinetics can be used to analyze the same data set, with only a sparse number of samples. A population model was determined by the nonlinear mixed-effects pharmacokinetic analysis in WinNonMix® 2.0.1 (Pharsight Corporation, Mountain View, CA) with sparse data (panel 1.2 C). Panel 1.2 D shows a single individual, with the individual predictions from the nonlinear mixed-effects population analysis as well as the population prediction.
This illustrates the simultaneous nature of estimation of the
pharmacokinetic characteristics of the population and the individual, all using Bayesian and related techniques.
39
1.5.3.
Examples of Population Pharmacokinetic Studies
1.5.3.1.
Pharmacokinetic Characterization and Covariate Analysis
Most of the research in the pharmacokinetics of the geriatric population lies outside the field of geriatric psychiatry.
As noted above, population pharmacokinetic techniques allow us to
determine pharmacokinetic parameters in a large population of patients even when the number of samples in each patient is very small. Krecic-Shepard et al. used sparse sampling to determine the clearance of sustained-release (SR) nifedipine.160 Clearance was determined in 226 patients with hypertension and/or coronary artery disease by a single concentration sample between 4 and 12 hours after drug administration using nonlinear mixed-effects modeling. This study was also designed to determine the demographic and clinical covariates that affect nifedipine clearance. Clearance was affected by race (slower in black subjects compared to white), sex (slower in men than in women), smoking status (slower in smokers compared to nonsmokers), and alcohol consumption (slower with alcohol use compared to no alcohol). This study had a large age range (36 to 96 years), although most patients were over 60 years, but did not identify age as a significant covariate on clearance.
Another feature of population pharmacokinetic techniques is the ability to identify factors that contribute to the variability in pharmacokinetic parameters. A study by Kang et al. evaluated the effects of age and sex on the clearance of SR racemic verapamil.161 Patients with heart disease (n=186) contributed both sparse and extensive verapamil concentration measurements, which provided the basis for the pharmacokinetic analyses using a nonlinear mixed-effects modeling approach.
This study found that sex significantly affected the steady-state clearance of 40
verapamil SR, with women having a faster clearance, and therefore a lower exposure, compared to men. Estimates of clearance were also affected by race (faster in black subjects compared to white subjects) and smoking status (faster in smokers compared with nonsmokers).
It is well established that renal function declines with age, which may impact the pharmacokinetics of renally excreted drugs.
Population pharmacokinetics can be used to
evaluate the impact of renal function on drug exposure, which is particularly important in the elderly population. Population pharmacokinetics were used to evaluate the antibiotic cefotaxime and its active metabolite, desacetylcefotaxime, which are both excreted primarily through renal elimination.162 Cefotaxime (1000 mg) was infused three times a day in 25 elderly individuals (age 66 to 93 years). Cefotaxime clearance increased with body weight and serum protein concentration, and decreased with age and serum creatinine concentration. This example also highlights the use of population pharmacokinetics in simultaneous parent drug (cefotaxime) and metabolite (desacetylcefotaxime) modeling.
1.5.3.2.
Identification of Drug Interactions
Population pharmacokinetics can also be used to detect pharmacokinetic drug interactions between combinations of drugs that are commonly combined for treatment purposes. Combination treatments are the major therapeutic strategy for human immunodeficiency virus (HIV) infection; therefore, it is important to identify patient characteristics that contribute to interindividual variability in the pharmacokinetics of each drug as well as the combination of drugs, which may relate to drug exposure and clinical response. Population pharmacokinetics of combined nevirapine, zidovudine, and didanosine were evaluated in 175 patients infected with 41
HIV as part of the AIDS Clinical Trials Group Protocol 241.163
Patients were randomized to
receive either a double combination of zidovudine and didanosine, or a triple combination of nevirapine, zidovudine, and didanosine. Approximately 3.5 samples per subject were measured during the 44 weeks of treatment. Pharmacokinetic analyses determined that sex significantly correlated with nevirapine clearance.
Body weight and age were correlates of zidovudine
clearance and body weight was a correlate of volume of distribution. Body weight was a significant correlate of both clearance and volume of distribution at steady state for didanosine. Bioavailability of zidovudine was reduced to 67.7% during the triple combination (with nevirapine) compared to the double combination (without nevirapine); no differences in bioavailability were found for didanosine. This demonstrates the ability to capture the covariate effects of multiple drugs simultaneously, in addition to whether or not a drug interaction is present.
1.5.3.3.
Therapeutic Drug Monitoring
Population pharmacokinetic approaches have been used to optimize the dose of phenytoin in patients with epilepsy, and the population data were then used to determine the variability in concentration resulting from a particular dosage.164 These elements were combined to produce a nomogram that reflects the regions of possible elimination rates given a particular dosage regimen and the resulting pseudo-steady-state concentration. Then if a new target concentration is desired, the dosage can be determined graphically from the nomogram. Subsequent to these analyses, Sheiner and Grasela evaluated the performance of NONMEM® in determining phenytoin exposure given routine clinical pharmacokinetic data, and found that reasonably good predictions of exposure could be determined using this type of sparse data.165 Killilea and 42
colleagues determined that Bayesian regression of sparse samples could accurately predict exposure, but that these samples needed to be taken over multiple occasions to robustly predict exposure.166 Other investigators have utilized these approaches for therapeutic drug monitoring of phenytoin exposure under both steady-state and non-steady-state conditions.167,
168
These
investigators concluded that the programs worked in a reasonably unbiased fashion and provided the best estimates when samples were taken beyond an initial five-day window of treatment.
1.5.3.4.
Determining Consistency of Drug Exposure
In addition to pharmacokinetic differences, patient adherence contributes to variability in clinical outcome.
Population pharmacokinetics can be used to determine the relationship between
intraindividual variability in drug concentrations and its association with patient response. Brundage and colleagues showed that intraindividual variability of efavirenz concentrations is a predictor of virologic response to antiretroviral therapy.169 Concentrations were obtained for 50 children as part of the Pediatric AIDS Clinical Trials Group Study 382, a concentrationcontrolled trial of efavirenz in combination with other antiretroviral medications. Nonlinear mixed-effects modeling was used to determine individual pharmacokinetic parameters of efavirenz from 24-hour concentration-time profiles at weeks 2 and 6.
Pharmacokinetic
parameters were used to predict trough concentrations during one year of therapy (one sample per visit, up to 12 visits). Inconsistencies in drug exposure can be detected by evaluating the differences between the observed (i.e. measured in the laboratory) and predicted (i.e. generated by the pharmacokinetic model) concentrations, which yields an integrated pharmacokinetic adherence measure (IPAM). The discrepancy between observed and predicted concentration was expressed as the ratio of the observed concentration (Cobs) to the predicted concentration (Cpred), 43
or Cobs/Cpred. The IPAM score was defined as the fraction of available ratios that Cobs was in the range of ± 50% the Cpred. A high IPAM score reflects a high concentration predictability, or low intraindividual concentration variability.
Only 8 of the 33 children (24%) in the high-
predictability group experienced viral rebound as measured by plasma HIV-1 RNA levels (>400 copies/mL), compared with 9 of the 17 children (53%) in the low-predictability group. Children with a low IPAM score also had a significantly shorter time to their first viral rebound.
1.5.4.
1.5.4.1.
Population Pharmacokinetic Examples in Geriatric Psychiatry
Pharmacokinetic Characterization and Covariate Analysis
Psychiatry is lacking basic pharmacokinetic data let alone sophisticated population pharmacokinetic evaluations.170
Recently our research group has used population
pharmacokinetic techniques to evaluate the disposition of psychiatric drugs in the elderly. We designed a study to determine whether the disposition of citalopram could be captured using only 1 to 2 blood samples per subject.171 Nonlinear mixed-effects modeling was used to evaluate the data collected in two studies of bipolar and elderly depression respectively.172, 173 In the first study, patients with bipolar depression were treated with citalopram for an initial 8-week response phase and then a 16-week continuation phase for responders. Plasma samples were obtained at baseline, week 1, week 8, and the end of the study. A total of 45 patients in this study provided 85 citalopram samples. The second study was a randomized, double-blind, placebo-controlled study of citalopram for the treatment of geriatric depression. Older depressed patients (75 years and older) were treated with citalopram or placebo for 8 weeks. Plasma samples were obtained at baseline, week 4, and week 8 (or at study termination). Sixty-six 44
patients provided 116 concentration samples in this study, for a total of 199 plasma citalopram concentrations from 106 patients for both studies.
The pharmacokinetic characteristics of
citalopram were well-captured, while taking only one or two blood samples per patient. In this analysis, the covariates age and weight had a significant effect on the clearance and volume of distribution of citalopram. increasing body weight.
Clearance decreased with increasing age and increased with
This sparse sampling design was adequate to support population
pharmacokinetic analyses in a clinically treated population including older adults.
A similar analysis was done for the Maintenance Therapies in Late-Life Depression trial.174 Older adults (69 years and older) with major depressive disorder were treated with paroxetine. A total of 171 patients provided 1970 paroxetine concentrations and a nonlinear mixed-effects model was developed with these sparse samples. Weight and cytochrome P450 (CYP) 2D6 genotype had a significant effect on the maximal elimination velocity (i.e., the rate of metabolism of the drug) and sex had an effect on the volume of distribution.175 Race, significant in the initial analysis as a covariate affecting rate of metabolism, was no longer significant when the CYP2D6 predicted phenotype (by genotype) was considered.
DeVane and colleagues have used similar methods to evaluate the population pharmacokinetics of alprazolam.176 Two blood samples collected at a random time during two different dose intervals were collected in 94 psychiatric inpatients receiving alprazolam.
Mixed-effects
modeling determined mean alprazolam clearance (0.05 L/h/kg), volume of distribution (0.7 L/kg) and absorption rate constant (1.1 h-1). Clearance was affected by sex (increased by 59% in
45
women compared to men), age (decreased by 23% in patients older than 60 years), and disease (decreased by 26% in patients with multiple organ disease).
The population pharmacokinetics of lithium were characterized by Gaillot and colleagues, using intense sampling on three different occasions after single and multiple dosages, as well as sparse sampling on two occasions.177 The aim of this study was to examine whether or not a universal dosage for lithium was possible a priori.
Average pharmacokinetics as well as the
interindividual variability were determined for the population. The total number of patients in this analysis (n=24) is not typically sufficient to adequately determine interindividual variability, but the investigators determined that any given fixed dosage would result in too large a proportion of patients falling either above or below the defined therapeutic range for this drug, and therefore no single dose could be recommended a priori. In another study, nonlinear mixedeffects modeling was applied using sparse therapeutic drug monitoring data to determine the population pharmacokinetics as well as important covariates affecting lithium disposition.178 Concentration measurements were taken 12 hours after the dose in 79 psychiatric inpatients. Steady state lithium concentrations were reasonably well predicted by this model. Lean body weight and serum creatinine were determined to be the best predictors of lithium clearance.
Other investigators utilized population pharmacokinetic approaches, using NONMEM®, to evaluate the disposition of lithium in Japanese patients.179 These investigators evaluated a number of potential covariates affecting disposition using 303 samples from 90 patients. They determined that age, total body weight, and serum creatinine affected the clearance of lithium. In addition, the interindividual variability of elimination was approximately 25%, in this
46
population. These approaches provide utility in the area of therapeutic drug monitoring where concentrations can be reasonably well-predicted from dose, and then further refined after initial measurements.
There is a paucity of data regarding the pharmacokinetics of the antipsychotics, with most studies involving a small number of healthy subjects. Callahan et al. reported a population pharmacokinetic analysis of olanzapine in 1711 patients with schizophrenia during phase II and phase III clinical trials.159 Smoking and sex were identified as important factors contributing to clearance and volume of distribution, though the actual data and model were not reported. In another study, by Kimko and colleagues, data from one phase I and one phase II clinical trial of quetiapine in patients with schizophrenia were analyzed with nonlinear mixed-effects modeling to develop a pharmacokinetic-pharmacodynamic (PK-PD) model.180 This PK-PD model was used to simulate the results of a phase III trial of quetiapine. Simulation results were compared with those in the actual trial to evaluate how well the simulations were able to predict the outcome. The actual trials results fell within the predicted response scores (± 1 standard error) for all doses (75, 150, 300, 600, or 750 mg/d) except the placebo group.
The Clinical Antipsychotic Trials of Intervention Effectiveness (CATIE) was a multi-site National Institute of Mental Health (NIMH) funded research project that evaluated the clinical effectiveness of atypical antipsychotics in the treatment of schizophrenia and Alzheimer's disease. This was the first systematic evaluation of the response to antipsychotics.181
An
ancillary study to the CATIE trial, Atypical Antipsychotics: Determinants of Concentration, was designed to reliably capture the concentration exposure of antipsychotics using mixed-effects
47
population pharmacokinetic methodologies. The CATIE Alzheimer’s disease trial contributed 795 concentrations in 260 patients (230 concentrations of olanzapine, 223 of quetiapine, 210 of risperidone, and 132 of citalopram). The CATIE schizophrenia trial contributed 5660 samples in 1212 patients (1528 concentrations of olanzapine, 1137 of quetiapine, 1274 of risperidone, 681 of ziprasidone, 641 of perphenazine, 216 of clozapine, 69 of aripiprazole, 18 of fluphenazine, and 96 of combination therapy). Our research group is in the process of constructing separate population pharmacokinetic models for each drug, and specific covariates are being evaluated as potential contributors to variability in drug exposure.182-184 This study will allow us for the first time to evaluate the pharmacokinetics of the antipsychotics, as well as the factors that contribute to variability in exposure within a psychiatric population.
Another NIMH funded multi-site study Depression: The Search for Treatment-Relevant Phenotypes (SPECTRUM) is aimed to define treatment-relevant phenotypes of depression in order to aid practicing clinicians in achieving durable recovery from major depression. The SPECTRUM study assesses the impact of the SSRI, escitalopram, and/or interpersonal psychotherapy on patients with depression. This study will provide up to five escitalopram concentration samples per patient in approximately 228 patients with depression. Additionally this study employs the use of electronic medication event monitoring (MEMS™) in order to monitor pharmacotherapy adherence, which is defined as the subject taking the medication at the prescribed time, and to provide the input profile for the pharmacokinetic modeling. This will further enhance the understanding of patterns of drug exposure.
48
1.5.4.2.
Identification of Drug Interactions
Population pharmacokinetics can also be used to determine the impact of exposure to a concomitant medication on the pharmacokinetics of another drug, which is particularly important for elderly individuals who regularly take multiple medications. A drug interaction between alprazolam and imipramine was identified with a population pharmacokinetic approach.185 Alprazolam (4 mg/d) was found to decrease the clearance of imipramine by 20%, using a traditional pharmacokinetic approach. However mixed-effects modeling determined that the interaction is dependent on the simultaneous concentration of alprazolam, which could not have been determined using the traditional pharmacokinetic study design.
1.5.4.3.
Determining Consistency of Exposure and Clinical Trial Simulation
Continuing Pharmacotherapy in Agitation and Dementia (CPAD) is a study that used population pharmacokinetic analyses to assess the consistency of risperidone exposure in older patients with dementia-related agitation and/or delusions.186 Risperidone was administered for 12 weeks and plasma samples obtained at baseline and weeks 1, 2, 4, 6, 8, 10, and 12. The observed concentrations (Cobs) of risperidone formed the basis for applying a Bayesian pharmacokinetic (mixed-effects modeling) approach to determine the ideal predicted concentration for an individual given a previously established population pharmacokinetic model, dosage history, and timing of the concentration sample. The predicted risperidone concentrations from the model (Cpred) were compared with the observed concentrations (Cobs) in the form of the ratio, Cpred/Cobs. If the model overestimates the measured concentration, this ratio increases. Assuming that the pharmacokinetic model is adequate, a higher ratio suggests that the patient has not received or 49
absorbed as much drug as prescribed. If the measured concentration is larger relative to the predicted concentration, the Cpred/Cobs ratio decreases, which suggests that the patient is receiving or absorbing more of the drug than was prescribed. In this study, the central tendencies of the Cpred/Cobs ratios across groups were not significantly different; however the modeled Cpred/Cobs ratios for risperidone had a much higher within-subject variance in the inpatients than in the community care patients (117.03% vs. 72.35%).
The CATIE and SPECTRUM studies have been simulated by our research group to assess the feasibility of accurately and precisely identifying the consistency of concentration exposure and to evaluate the impact of electronic monitoring on measuring consistency of exposure to pharmacotherapy.187 These studies were simulated separately using nonlinear mixed-effects pharmacokinetic modeling. The first step simulated datasets of “virtual patients,” each with a unique virtual concentration-time profile under the sampling conditions of each study. Virtual patient characteristics were generated using Monte Carlo (i.e. random number generating) simulation methods. In this study, two versions of the dosing history and sample times were simulated. The true dosage history and sample times were simulated using MEMS™ data, and the other simulation was done with incorrectly-reported dosage history and sample times. The second step estimated the concentrations and pharmacokinetic parameters from the datasets of the virtual patients; first using accurate dosage history and sample times from MEMS™ data, and then with inaccurate dosage history and sample times. The Cpred/Cobs ratio was calculated for each concentration observation. In these simulations, the use of electronic monitoring improved the identification of atypical exposure by population pharmacokinetics both for selective serotonin reuptake inhibitors and atypical antipsychotics.187 Erratic exposure patterns were
50
detected with population pharmacokinetic techniques in the absence of MEMS™ data. The Cpred/Cobs ratio increased with decreasing adherence (or increasingly erratic exposure) when exact dosage history was not accurately known. These simulations demonstrated the usefulness of the combination of population pharmacokinetics with electronic monitoring, as a robust method for accurately and precisely capturing both magnitude and consistency of pharmacotherapy exposure.
1.5.5.
Summary
As reflected from the examples discussed in this section, most population pharmacokinetic studies have been done in the adult population, but have recently expanded to include children and elderly individuals. These techniques are particularly relevant for the very young and the very old because of the use of sparse sampling strategies.
Population pharmacokinetic
techniques contribute to a greater understanding of drug disposition and response in older individuals, by modeling drug concentrations from a population of patients and characterizing the degree of variability in drug exposure for this population. Another advantage is the ability to identify factors that contribute to the variability in pharmacokinetics, including age, sex, race, weight, renal function, and concomitant medications. Population pharmacokinetics can also be used to measure patient adherence and evaluate its effect on clinical outcome. As shown with the examples from the CATIE and SPECTRUM studies, population pharmacokinetics can be used to design and simulate data for large clinical trials, which can decrease the time and resources spent and therefore defray costs.188, 189 The following section is an example of the use of population pharmacokinetic methodologies to identify contributors to variability in olanzapine pharmacokinetics using data from the CATIE trials. 51
Acknowledgments:
This section was previously published:
Bigos KL, Bies RR, Pollock BG. Population
pharmacokinetics in geriatric psychiatry. American Journal of Geriatric Psychiatry. 2006;14(12):993-1003.190
This work was supported by NIH MH065416, MH059666,
MH064137, MH71944, MH076420, and the Sandra A. Rotman Chair in Neuropsychiatry.
52
1.6. Population Pharmacokinetics of Olanzapine
1.6.1.
Introduction
The Clinical Antipsychotic Trials of Intervention Effectiveness (CATIE) was the first systematic evaluation of the clinical response to atypical antipsychotics in the treatment of Alzheimer's disease and schizophrenia. In the schizophrenia trial (CATIE-SZ), olanzapine was the most effective antipsychotic studied in terms of the rates of discontinuation before 18 months for any cause (64%), compared to perphenazine (75%), quetiapine (82%), risperidone (74%), and ziprasidone (79%).181
However, olanzapine was associated with greater weight gain and
increases in measures of glucose and lipid metabolism.181 In the Alzheimer’s disease trial (CATIE-AD), there were no significant differences among treatments. The median time to discontinuation of treatment for any reason was similar for olanzapine (8.1 weeks), risperidone (7.4 weeks), quetiapine (5.3 weeks), and placebo (8.0 weeks).191
The CATIE trials reported overall high rates of discontinuation due to lack of efficacy and/or intolerable side effects for all antipsychotics. One reason for the high rates of discontinuation may relate to the wide variability in the pharmacokinetics of these drugs, which often results in differences in the pharmacodynamics, both in the response to a drug and the incidence of adverse effects. For example, if a patient clears a drug faster than average, they will experience lower drug levels and may not respond as well at the same dose. Conversely, if a patient clears the drug slower than average, they will have higher drug levels and may be at a higher risk of experiencing adverse effects. Therefore, in order to limit the variability in response to a drug, it is necessary to limit or control for the variability in the pharmacokinetics. This is particularly 53
important in an older population such as patients with Alzheimer’s disease, where the variability is often greater.170
Population pharmacokinetic methodologies provide a means of estimating the magnitude of drug exposure in a large number of patients in a minimally invasive way, using sparse sampling.190 These methodologies also allow one to identify factors that contribute to variability in drug exposure as well as detect potential pharmacokinetic drug interactions.190 Limited data on the pharmacokinetics of olanzapine has been published.159 Most studies were conducted in a small number of subjects, and other studies elude to population analyses but do not report actual values or the magnitude of effect of the contributors to variability.159, 192, 193 The CATIE trials afforded a unique opportunity to study a large number of subjects treated with antipsychotics. This ancillary study to the CATIE trials aimed to capture the magnitude and variability of concentration exposure of antipsychotics using mixed-effects population pharmacokinetic methodologies.
This allowed us, for the first time, to evaluate the pharmacokinetics of
olanzapine, as well as identify factors that contribute to variability in exposure, in large populations of patients with schizophrenia and Alzheimer’s disease.
54
1.6.2.
1.6.2.1.
Methods
Participants and Interventions
A detailed description of the study design and methods has been published for CATIE-SZ194 and CATIE-AD.195
Patients with Alzheimer's disease and schizophrenia were recruited from
multiple U.S. sites between January 2001 and December 2004. Patients were treated with oral olanzapine (2.5 to 20 mg/day taken once a day for AD and 7.5 to 30 mg/day taken once or twice daily for SZ, with the exception of one patient in the SZ trial who received up to 80 mg/day). Demographic information was collected at study visits, including height, weight, age, sex, smoking status, and concomitant medications.
Race was self-reported and included the
following categories: American Indian, Asian alone, Black/African American, Native Hawaiian, White alone, and two or more races. Subjects also reported whether they were of Hispanic ethnicity, as a separate category from race. Plasma samples were collected during the study visits.
Each subject provided between one and six plasma samples for determination of
olanzapine concentrations. Data was excluded for missing (or incorrect) dose, time of dose, sample, or time of sample.
1.6.2.2.
Analytical Procedures
Plasma levels of olanzapine were determined using liquid chromatography tandem mass spectrometry (LC-MS-MS).196 Briefly, 0.5 mL of plasma was alkalized with 0.5 mL of saturated aqueous solution of sodium carbonate and extracted by a liquid-liquid extraction method (15%
55
methylene chloride in pentane). The organic extract was dried and reconstituted in mobile phase and an aliquot was injected into the LC-MS-MS system. The compounds were separated on a phenyl-hexyl (5 micron 50 x 4.6 mm) column by isocratic elution using a mobile phase containing aqueous 78 µM ammonium acetate, methanol and acetonitrile (5:45:50).
The
analytes were ionized in the mass spectrometer in a TurboIon source with positive ion atmospheric pressure electrospray ionization and detected with multiple reaction-monitoring modes. The ion transitions monitored were m/z 313 → 256 for olanzapine and m/z 327 → 270 for the internal standard (LY 170222). These transition ions were selected based on predominant fragmentation pathways of olanzapine and internal standard and their intensity as observed in their product ion mass spectra. The olanzapine standard was linear over the range of 0.1 ng/mL to 100 ng/mL when 0.5 mL of plasma was used for the analysis (r2 > 0.999). The intra- and inter-assay variations were less than 15% for the spiked standard curve and quality control samples. The variations for the long-term patient quality control samples were 0.05 > 0.05 > 0.05 > 0.05 > 0.05 > 0.05 > 0.05 > 0.05
95% CI of difference 3.216 to 9.067 0.4649 to 15.01 -9.060 to 18.09 -7.133 to 23.12 -5.439 to 8.632 -15.08 to 11.82 -13.16 to 16.87 -18.23 to 11.78 -16.17 to 16.68 -16.55 to 23.51
None of the 41 concomitant medications tested had an effect on olanzapine clearance. None of the covariates (including concomitant medications) had an effect on the volume of distribution of olanzapine. 60
Figure 1.4. Olanzapine clearance by smoking status
CLEARANCE (L/h)
75 60 45 30 15 0
SMOKERS
NONSMOKERS
(n=274)
(n=249)
Figure 1.5. Olanzapine clearance by sex
CLEARANCE (L/h)
75 60 45 30 15 0
MEN
WOMEN
(n=332)
(n=191)
61
Figure 1.6. Olanzapine clearance by race
CLEARANCE (L/h)
75
Black/African American (n=149) White (n=346) Asian (n=19) American Indian (n=5) Two or more races (n=4)
60 45 30 15 0
Black
White
Asian
Indian
2+
Figure 1.7. Combined effect of smoking, sex, and race on olanzapine clearance
CLEARANCE (L/h)
75 60 45 30 15 0 Smoking African American Men (n=70)
62
Non-smoking Non-African American Women (n=90)
1.6.4.
Discussion
Dose-adjusted steady-state concentrations of olanzapine vary 26-fold in patients treated with standard doses of olanzapine.200 This pharmacokinetic variability likely contributes to the wide variability in response to olanzapine. This study showed that olanzapine clearance varies nearly 10-fold and is impacted by sex, race, and smoking.
CYP1A2 is the major enzyme responsible for metabolizing olanzapine, with minor pathways including CYP2D6 and flavin-monooxygenase FMO3.201
Polyaromatic hydrocarbons in
cigarette smoke are known to induce the liver enzyme cytochrome P450 (CYP) 1A2.202,
203
Therefore, it is not surprising that clearance of olanzapine is accelerated in patients who smoke, which has been previously reported.159, 204 This is a potentially serious problem due to the fact that many patients with schizophrenia smoke.
In this population, 66% of patients with
schizophrenia were active smokers. Due to faster clearance, it may be necessary to increase the dose in patients who smoke. Conversely, doses may need to be decreased following smoking cessation.
Sex differences in pharmacokinetics have been reported for many psychotropic medications.69, 95 Differences in olanzapine clearance due to sex have been previously reported.159, 204-206 In this study, men cleared olanzapine 38% faster than women. Estrogen is a known inhibitor of CYP1A2, which could explain the slower olanzapine clearance found in women.72
Other
possible mechanisms include sex differences in blood flow and liver size, as well as differences in expression of metabolizing enzymes and transporters.69, 95
63
This is the first study to find racial differences in olanzapine clearance. Patients who identified themselves as Black or African American cleared olanzapine faster than patients of other races. There are many possible factors underlying these racial differences, potentially arising from both the sociologic and possible biologic realms.207 One possible explanation for racial differences in pharmacokinetics is the known genotypic differences in metabolizing enzymes.
Genetic
polymorphisms found in the CYP1A2 gene,208 but there are limited data on the effects of CYP1A2 genetics on drug metabolism. However, more than 80 allelic variants have been identified for the CYP2D6 gene among different racial populations, which results in variable enzymatic activity.209
Feng and colleagues found that race was a significant predictor of
paroxetine clearance, but was no longer significant when CYP2D6 genotype was incorporated in the model, which suggests that race is acting a surrogate for CYP2D6 genotype.175,
210
The
average paroxetine clearance was 27.4 L/h for the African American population compared to only 21.9 L/h for the Caucasian population, which may relate to the 3-fold higher frequency of the *4 null allele in Caucasians compared to African Americans.211
Another possible explanation is that there are differences in adherence, or drug intake rates across the different racial populations. A consistently lower intake of the drug would result in an increased estimate of clearance due to lower drug concentrations. Additionally, if patients were inconsistently taking the medication, this would contribute to variability in apparent elimination across occasions. There is also greater genetic diversity in African populations than in either European or Asian populations, which leads to considerable heterogeneity in African populations.212 Other potential reasons for the racial differences found in this study may arise, as the race covariate is collected primarily as a social category, not a biological category.213 Due to
64
the multifactorial nature of race, this finding requires further study. Therefore conclusions regarding dosage should not be made on the basis of race.
In summary, sex, race, and smoking status impact olanzapine clearance and therefore impact drug exposure. Differences in olanzapine exposure due to sex, race, and smoking status may account for some of the variability in response to olanzapine.
Acknowledgments:
Funding was provided by the National Institute of Mental Health MH064173, MH065416, and MH076420, and the Sandra A. Rotman Chair in Neuropsychiatry. analytical olanzapine.
Eli Lilly donated the
We gratefully acknowledge the generous assistance of the CATIE
investigators (P.I. Jeffrey Lieberman, MD).
65
1.7.
Summary
As more data become available, clinicians should consider these pharmacokinetic and pharmacodynamic differences between women and men, young and elderly, different racial backgrounds, and/or smoking status, in prescribing psychotropics and evaluating their response. Population pharmacokinetic techniques contribute to a greater understanding of drug disposition and response, by modeling drug concentrations from a population of patients and characterizing the degree of variability in drug exposure for this population. This allows us to identify factors that contribute to the variability in pharmacokinetics, including age, sex, race, weight, smoking, and concomitant medications. As shown with olanzapine, differences due to sex, race, and smoking status, which contribute to variability in exposure to olanzapine, may account for some of the variability in response. However, characterizing the variability in the pharmacokinetics of a drug is only one step to a better understanding of how and why psychotropics work differently in each individual. The following chapter describes an approach to elucidating the neural pathways that produce changes in mood and behavior in order to better understand the pharmacodynamics of a particular drug or class of drugs, as well as to learn more about the pathophysiology of psychiatric illnesses.
66
2. Introduction to Citalopram Pharmacodynamics
67
2.1.
The Serotonergic System
Serotonin, 5-hydroxytryptamine (5-HT), is a monoaminergic neurotransmitter known to mediate mood and emotion, as well as a host of other basic functions including sleep and appetite. Serotonergic neurons project to most regions of the brain, with primary targets including the amygdala, hippocampus, hypothalamus, substantia nigra, caudate, putamen, nucleus accumbens, and multiple cortical areas.214 There is a great deal of evidence that dysregulation of the serotonin system is involved in the pathophysiology of depression, anxiety, and other psychiatric illnesses. In fact, many regions implicated in depression are regions regulated by serotonin including the amygdala, hypothalamus, caudate, as well as the frontal and cingulate cortices, as reviewed by Staley et al.215
2.2. Selective Serotonin Reuptake Inhibitors
Selective serotonin reuptake inhibitors (SSRIs), the second most commonly prescribed class of drugs, are the first line therapy for the treatment of depression and anxiety.
SSRIs act at the
serotonin transporter (5-HTT) to block the reuptake of serotonin, thus increasing serotonin concentration in the synapse. Due to their actions at the serotonin transporter, SSRIs can also be used to measure serotonin function in the brain of both healthy and depressed patients. One common measure of serotonin function is an increase in hormones in response to SSRIs. Serotonergic neurons stimulate the secretion of several hormones including adrenocorticotropic hormone (ACTH) and prolactin from the pituitary.216 Studies have shown that intravenous (IV) administration of the SSRI, citalopram, increases plasma prolactin and cortisol levels in a dose-
68
related manner.217-219 Additionally, depressed patients have a significantly blunted prolactin secretion after administration of citalopram when compared to healthy subjects.220
The
mechanism underlying the secretion of cortisol after administration of an SSRI has not yet been elucidated; however it is possible that direct effects of the SSRI on the pituitary mediate the release of ACTH, which results in a release of cortisol.216 Alternatively, SSRIs may have a direct effect on the adrenal glands.221 This neuroendocrine response to SSRIs has often been used as a probe for brain serotonin function; however, this measure does not indicate which regions of the brain are activated by SSRIs. In fact, while much is known about the action of SSRIs at the cellular level, it is still largely unknown how the effects of these agents on functional interactions between distinct brain regions alter mood and behavior.
2.3. Citalopram
The SSRI, citalopram, is a particularly useful probe of the serotonin system due to its high affinity for the serotonin transporter.222 Citalopram is approved by the U. S. Food and Drug Administration (FDA) for the treatment of depression, and is also commonly used in the treatment of other psychiatric illnesses, including obsessive compulsive disorder and panic disorder.222,
223
Citalopram is commercially available as an oral tablet (Celexa®), but is also
available in an intravenous formulation under an investigational new drug (IND) application. Citalopram, the only SSRI available in IV formulation, is well-tolerated at doses up to 40 mg.217, 219, 220, 224
Like other SSRIs, citalopram is believed to exert its pharmacological effects by
blocking serotonin (5-HT) reuptake at the serotonin transporter (5-HTT).
Citalopram is
particularly selective for 5-HTT, having negligible effects on other transporters including
69
dopamine and norepinephrine transporters, and little to no affinity for other neurotransmitter receptors such as the gamma amino butyric acid (GABA), opioid, and muscarinic receptors.222, 223
Citalopram exists as a racemic mixture, and studies have shown that the S-enantiomer is
significantly more potent in inhibiting 5-HT reuptake than the racemate.225 Because of its selectivity and tolerability, IV citalopram can be used as a probe for in vivo assessments of serotonin function.
Neuroimaging techniques have been used to detect drug-induced changes at the neuronal level. Positron emission tomography (PET) studies have shown that citalopram alters cerebral glucose metabolism, as measured by changes in the radiotracer [18F]-2-deoxy-2-fluoro-D-glucose ([18F]FDG), in areas of the brain thought to be involved in the pathophysiology of depression and anxiety. One such study in healthy men and women showed that IV citalopram decreased cerebral glucose metabolism in the right (R) anterior cingulate gyrus, R superior and R middle frontal gyrus, R parietal cortex (precuneus), R superior occipital gyrus, left (L) thalamus, and R cerebellum, while it increased glucose metabolism in the L superior temporal gyrus and L occipital cortex.226 In another PET study, patients with geriatric depression demonstrated greater left-hemisphere cortical decreases after administration of IV citalopram than elderly comparison subjects, while the control subjects demonstrated greater right-hemisphere cortical decreases than the patients.227 The depressed patients also demonstrated greater metabolic increases in the R putamen and L occipital cortex after IV citalopram compared to the elderly control subjects.227 These results support the hypothesis of serotonin dysregulation and potential compensatory responses in depressed patients.
The regions identified overlap with areas thought to be
70
important in the pathophysiology of depression and anxiety and may indicate regions important for treatment response.
2.4. Functional Magnetic Resonance Imaging
Neuroimaging techniques acquire substantial data sets, reflecting the acquisition of many hundreds of repeated measures of brain structure or function within a single subject in a short period of time. One such technique, functional magnetic resonance imaging (fMRI), can been used to non-invasively measure both spatial and temporal drug-induced changes in task-related neuronal activation, by detecting changes in the blood oxygenation level dependent (BOLD) signal. The BOLD signal, an indicator of neuronal activation, is generated by increases in local cerebral blood flow and the subsequent increase in the percentage of oxygenated hemoglobin. An increase in oxygenated hemoglobin, which is less paramagnetic than deoxygenated hemoglobin, can be measured using T2*-weighted magnetic resonance imaging, which is the basis of fMRI.
This method uses blood oxygenation as an endogenous contrast with
hemodynamic specificity similar to nuclear tracer techniques (i.e. PET) without the exposure to radioactivity. Compared to PET, fMRI also has better spatial (4 mm3 voxels and smaller compared to 8 mm3 voxels in PET) and temporal resolution, on the order of a few seconds compared to 40-60 seconds or even minutes. Additionally, fMRI is unique due to its ability to detect functional interactions between brain regions while subjects are performing tasks. The efficiency of fMRI allows for the ability to investigate the specificity of a drug or gene effect by examining its influence on multiple functional systems (e.g., prefrontal, striatal, limbic) in a
71
single subject. The ability to rapidly assay differences in brain with power and sensitivity places neuroimaging at the forefront of available tools for the in vivo study of psychotropics.
Advances in fMRI allow researchers to study regional brain activity while subjects are performing sensory, motor, cognitive, or affective tasks using rapid sequential imaging. Studies designed to determine the networks in the brain responsible for mood and cognition have found that performance of cognitive or emotional processing tasks results in increased blood flow in several distinct areas of the prefrontal cortex associated with these tasks, and corresponding decreased blood flow in other areas requiring deactivation to facilitate task performance.228 Tasks have been designed to activate more specific regions of the brain involved in the regulation of mood and behavior, including the amygdala, a brain region critical in mediating emotional arousal. PET studies found that the amygdala is the only structure in which regional blood flow and glucose metabolism consistently correlate positively with depression severity, and metabolism in the amygdala decreases toward normal during antidepressant drug treatment.228 The amygdala is known to play an important role in the recognition of certain facial emotions, particularly fear. Functional MRI tasks have been designed to engage the amygdala through the cognitive evaluation of angry and fearful human faces.229
Using fMRI, some psychoactive drugs have been shown to produce regionally specific patterns of neuronal activation during cognitive and affective tasks.230,
231
One study found that oral
dextroamphetamine (0.25 mg/kg body weight), a nonspecific monoaminergic agonist, induced a significant increase in the BOLD signal of the R amygdala in response to the fearful faces task.231 Functional MRI has been used to evaluate the effects of the oral SSRIs, fluoxetine232 and
72
paroxetine,233 on neuronal motor pathways, and one study found that chronic fluoxetine treatment decreased amygdala activation.234 Studies evaluating the acute effects of SSRIs during cognitive or affective tasks are limited.
One study found that IV citalopram (7.5 mg)
pretreatment decreased the R amygdala response to aversive faces in a single-blind study of 12 healthy men.235
2.5. Serotonin Transporter Genetics
The serotonin transporter (5-HTT) regulates the magnitude and duration of serotonergic responses by modulating the levels of 5-HT in the synapse.236 Dysregulation of 5-HTT has been associated with several psychiatric disorders including anxiety237-241 and depression.242,
243
A
common polymorphism exists in the transcriptional control region upstream of the 5-HTT coding sequence, which in humans is encoded by a single gene (SLC6A4) on chromosome 17q11.2.244 Insertion or deletion of a 44 base-pair segment in this 5-HTT gene-linked polymorphic region (5HTTLPR) results in long (l) and short (s) variants, and these genotypes are distributed according to Hardy-Weinberg equilibrium: 32% l/l, 49% l/s, and 19% s/s.245 The s allele is associated with decreased transcriptional efficiency of the 5-HTT gene promoter and a decrease in 5-HTT expression and 5-HT uptake.244, 245 The s allele is also differentially associated with anxietyrelated behavioral traits in healthy subjects; those carrying the s allele have been shown to be slightly more likely to have abnormal levels of anxiety245-248 and develop conditioned fear responses,249 resulting in an increased incidence of affective illnesses,250 especially in the context of environmental stress,251, 252 when compared to those homozygous for the l allele. Hariri et al. showed that individuals with one or two copies of the s allele exhibit greater amygdala neuronal
73
activation in response to fearful stimuli compared with individuals homozygous for the l allele, as measured by change in BOLD fMRI signal.253 There have been multiple replications of the association between the s allele and relatively increased amygdala reactivity in both healthy volunteers
254-259
and patients with mood disorders.260,
261
Additionally, the s allele has been
linked with reduced functional coupling between the amygdala and medial prefrontal cortex.262 As the magnitude of amygdala reactivity (as well as its functional coupling with medial prefrontal cortex) is associated with temperamental anxiety, these imaging genetics findings suggest that the 5-HTTLPR s allele may be associated with increased risk for depression upon exposure to environmental stressors because of its mediation of exaggerated corticolimbic reactivity to potential threat.263
The 5-HTTLPR polymorphism may also predict variability in response to treatment, specifically the neuronal response to SSRIs. Because SSRIs, including citalopram, act directly on the 5HTT, genetic differences in the transporter may result in variability in the therapeutic response to these drugs. One study in patients with late-life depression showed a decrease in depressive symptoms during acute treatment with paroxetine, as evidenced by mean reductions from baseline on the 17-item Hamilton Rating Scale for Depression, which was significantly more rapid for patients with the l/l genotype than for those with either s/l or s/s genotype.264 A similar study found that patients with the s/s genotype carried 3 times more risk of non-remission for a major depressive episode (>7 on the 21-item Hamilton Depression Rating Scale) after 12 weeks of treatment with oral citalopram than patients with l/l or l/s genotype.265
74
2.6. Summary
Although much is known about the role of 5-HT in the pathophysiology of depression, little is known about the temporal and regional brain alterations in 5-HT as they relate to the treatment of depression and anxiety. IV citalopram can be used as an in vivo probe of 5-HT function, due to its selectivity and tolerability. Functional MRI can been used to non-invasively measure both spatial and temporal drug-induced changes in task-related neuronal activation, by studying regional brain activity while subjects are performing sensory, motor, cognitive or affective tasks. Using fMRI, some psychoactive drugs have been shown to produce regionally specific patterns of neuronal activation during cognitive and affective tasks. Additionally, 5-HTT genotype can predict task-related neuronal activation as measured by fMRI.
In the following study, we aimed to evaluate the effects of IV citalopram on neuronal activation elicited during an emotional task using fMRI in healthy subjects. We hypothesized that acute IV citalopram administration will oppose the task-related increase in neuronal activity in the amygdala, as measured by fMRI, and that this opposition will be blunted in subjects with at least one s allele for the 5-HTTLPR compared to subjects who are homozygous for the l allele. This study will generate in vivo human data regarding the regional effects of acute SSRI administration on affective task-related neuronal activation. Functional MRI will allow us to better understand the actions of SSRIs at the neuronal level in real-time, and may help to elucidate the functional interactions between distinct brain regions involved in the actions of SSRIs. An understanding of the regional effects of SSRIs will aid in predicting patient response to these agents. By including 5-HTTLPR genotype in the analyses, we may account for some of the variability in response to citalopram and conceivably other SSRIs. 75
These efforts will
contribute to the identification of biological mechanisms and pathways that mediate response to SSRIs as well as may contribute to individual differences in complex behaviors and vulnerability to psychiatric illnesses.
76
3.
Methods
77
3.1.
Specific Aims
SPECIFIC AIM 1. To evaluate the effects of IV citalopram on task-related neuronal activation elicited during an affective task using fMRI in healthy subjects. This study is a double-blind placebo-controlled randomized crossover of IV citalopram (20 mg infused over 30 min) and normal saline (0.9% sodium chloride solution) during two fMRI scans. During each scan, subjects will complete a series of affective tasks, known to robustly activate the amygdala, and sensorimotor control tasks. We predict that task-related neuronal activation in the amygdala will be decreased during citalopram infusion compared to placebo.
SPECIFIC AIM 2. To evaluate the impact of a polymorphism in the promoter region of the serotonin transporter gene (5-HTTLPR) on task-related neuronal activation during IV citalopram administration. Subjects will be prospectively genotyped for the 5-HTTLPR and changes in neuronal activation will be compared between subjects who have at least one copy of the s allele (s/s or s/l) and subjects homozygous for the l (l/l) allele. We predict that changes in neuronal activation in response to acute administration of citalopram will be blunted in subjects who carry the s allele for the 5-HTTLPR.
78
3.2.
Drug Information
Parenteral citalopram was administered under IND #48,032 of the Food and Drug Administration (FDA), held by one of the listed investigators, Dr. Bruce G. Pollock. This protocol was submitted to the FDA as part of this IND. The recommended starting dose of oral citalopram is 20 mg daily with a maximum dose of 60 mg/day. Although 40 mg is well tolerated in both oral and IV formulations, 20 mg was chosen due to the potential for nausea and vomiting that may compromise the safety of the subject.219, 226 In addition, BOLD is a sensitive response measure which may lose specificity for regional activation at doses higher than 20 mg.
3.3.
Design and Overview
This study is a randomized, double-blind, placebo-controlled crossover of IV citalopram (20 mg infused over 30 min) and normal saline (0.9% sodium chloride solution) during two one-hour fMRI scans while subjects complete affective and sensorimotor tasks.
An unblinded
investigational pharmacist at the University of Pittsburgh Medical Center randomized each subject to receive either citalopram or placebo on their first visit and the opposite treatment on the following visit, as shown in Table 3.1. Visits were separated by a minimum washout period of two weeks. All subjects gave informed consent before undergoing any research procedures. Eight subjects, three homozygous for the l allele (l/l) and five with at least one s allele (s/l or s/s), were recruited to participate in the study.
79
Table 3.1. Treatment randomization Subject number 3 4 25
5-HTT genotype L/L L/L L/L
citalopram placebo placebo citalopram placebo citalopram
18 20 22 26 29
S/S S/S S/L S/L S/L
citalopram placebo placebo citalopram citalopram placebo citalopram placebo placebo citalopram
3.4.
Visit 1
Visit 2
Screening Visit
This study recruited healthy, right-handed, non-smoking Caucasian men between the ages of 18 and 60 years. These selection criteria were designed to minimize between-subject variation and possible age-related and ethnic differences in fMRI response.266 Subjects were recruited from established research studies being conducted at the University of Pittsburgh by these investigators, as well as through advertisements. All subjects signed a University of Pittsburgh Institutional Review Board (IRB) approved consent form prior to any research procedures (Appendix B).
The screening visit for the study was conducted at the General Clinical Research Center (GCRC) of the University of Pittsburgh Medical Center (UPMC). Screening included a complete medical history, physical examination (including height, weight, blood pressure and heart rate), biochemical and hematological laboratory screen (albumin, BUN, calcium, CBC, chloride, creatinine serum, glucose, hematocrit, hemoglobin, serum phosphorus, potassium, prothrombin
80
time, partial thromboplastin time, AST/ALT, and sodium), blood alcohol, serum cotinine, and urine drug screen, within 28 days of the first study day. Subjects provided a 10 mL blood sample, which was used to sequence the 5-HTTLPR. An electrocardiogram (ECG) was done to rule out subjects with cardiac electrophysiological abnormalities, particularly bradycardia (heart rate less than 50 beats per minute), which may increase the risk of cardiac side effects associated with SSRIs. The modified Structural Clinical Interview for Diagnosis of DSM-IV Disorders (SCID) was conducted by a trained interviewer to screen subjects for psychiatric illness.267 In addition to the SCID, subjects completed the Beck Depression Inventory, which is a 21-item self-report rating inventory measuring characteristic attitudes and symptoms of depression.268 When a clinically significant, unanticipated disease or condition was identified during the conduct of screening, the participant was informed of the discovery by the investigators, and the participant was referred appropriately.
Subjects were excluded for past or current psychiatric disorder, neurological disorder (including stroke, brain tumor, epilepsy, significant head injury, Alzheimer’s, Parkinson’s or Huntington’s disease) or an uncontrolled medical disorder. Subjects were also excluded for having a positive alcohol or cotinine level on the screening visit or study visit. Subjects taking known cytochrome P450 enzyme-inducing or enzyme-inhibiting agents within one month of the study, or any chronic medications (including over the counter drugs) within one week of the study were also excluded. Subjects were excluded if they have ever had an adverse reaction to oral citalopram or any other SSRI.
Subjects who have a contraindication to MRI, including a pacemaker,
defibrillator or other medical implant, bullets, shrapnel, or other metal objects, or claustrophobia were not eligible.
81
3.5.
Study Visits
Subjects refrained from the use of over the counter and prescription drugs and grapefruit juice for one week prior to the first study visit and refrained from alcohol and caffeine for 48 hours prior to each study visit. Subjects were admitted to the General Clinical Research Center (GCRC) the morning of the study day and completed a baseline BDI.
A baseline
electrocardiogram was recorded. Vital signs (blood pressure and heart rate) were also measured at baseline, after the infusion, and before discharge. A urine sample for drug screening was obtained and intravenous catheters were placed in each forearm, one for drug/placebo infusion and the other for multiple blood sampling. Subjects were escorted to the Magnetic Resonance Research Center (MRRC) where they completed an MR safety questionnaire, which was reviewed orally with MRRC staff prior to each scan to ensure their safety while in the magnet. Subjects were in the scanner for one hour as detailed in Figure 3.1.
Figure 3.1. Study design Infusion 0 to 30 (min)
Shapes
31 to 36
Faces
22 to 30
Shapes
TAP 3
16 to 21
Faces
FACES 3
7 to 15
Faces
TAP 2
1 to 6
Shapes
FACES 2
-8 to 0
Faces
TAP 1
-23 to -8 (min)
Shapes
FACES 1
Shapes
Structural scans
6 tasks
82
During the first 15 minutes a series of structural scans was acquired, which were used to align the functional MRI acquisition and for cross-registration of the functional scans for the group analyses. Immediately after the structural scan, the subjects performed tasks during the 45 minute functional scanning. The infusion began at time 0 min, after the structural scan and the baseline FACES 1 functional scan. Either citalopram (20 mg in 0.9% saline) or placebo (0.9% saline) was infused for 30 minutes while subjects were asked to perform the tasks. Subjects rested for one minute between tasks while investigators prepared the next task and gave the subjects instructions. Blood samples (10 mL) were taken between tasks to determine drug concentrations at baseline (0 min), during the infusion (6, 15, and 21 min), at the end of infusion (30 min), at the end of the scan (36 min), and after the scan (45, 60, 90, 150, and 360 min). Before discharge, the subjects had an ECG and completed the BDI and a side effect questionnaire. One week following each study visit, the subjects were called by one of the listed investigators and completed the BDI and side effect questionnaire. The subjects were paid a total of $225 for participating in the study, which included $100 for each of the two study visits, and $25 for the screening visit.
3.6.
fMRI Tasks
A blocked design was used for the fMRI tasks. The first block of tasks (FACES) included an emotion task (faces) and a sensorimotor task (shapes). During the FACES task, subjects were asked to match one of two faces to a target face, all expressing the same emotion (angry, fearful, surprised, or neutral). An example of each emotional stimuli is shown in Figure 3.2. Two hundred eighty-eight different images were used from the NimStim Face Stimulus Set.
83
(www.macbrain.org)
For each block (e.g. FACES 1), there were four sub-blocks each
containing six stimuli of random emotion (angry, fearful, surprised, and neutral). The identity of both faces was always different and an equal number of male and female faces were presented. Developed by Hariri, this task is known to elicit a robust amygdala response.229, 253
Figure 3.2 Emotional stimuli
A. Angry
B. Fearful
C. Surprised
D. Neutral
84
As a sensorimotor control task (shapes), subjects were asked to match one of two geometric shapes with a simultaneously presented target shape, Figure 3.3. Six different sets of geometric forms were used in the control condition. Between images, subjects were instructed to fixate on a black cross-hair in the middle of the screen. Figure 3.3. Sensorimotor stimuli As shown in Figure 3.1, FACES involved 9 experimental blocks: 5 blocks of the shapes task (control) interleaved with 4 blocks of the faces task (experimental). Each block contained 6 trials, lasting 5 seconds each. Before each block, a brief instruction (“match emotion” or “match form”) was presented for 2 seconds. During the task, subjects responded with button presses, which allowed us to determine accuracy and reaction time. A complete FACES block takes approximately 6 minutes and was completed once before the infusion and twice during the infusion.
In the second block, the sensorimotor control task (TAP) was done to acquire a baseline fMRI BOLD signal for each subject and to compare the time course of the hemodynamic response function across the entire scanning session. Subjects were instructed to press both buttons, with their index fingers, every time they see the word TAP appear on the screen. The stimulus appeared every 12 seconds and remained on the screen for 1 second. In the interim, subjects were instructed to fixate on a white cross-hair in the middle of the screen. This task takes 5 minutes and was completed twice during the infusion and once after the infusion.
85
3.7.
Scanning Procedures
All fMRI scans were conducted at the University of Pittsburgh Medical Center Magnetic Resonance Research Center (MRRC) on a 1.5 Tesla Signa MR Scanner (General Electric Medical Systems, Milwaukee, WI). Structural MRIs were performed prior to the functional scans to align the functional MRI acquisition and to cross-register the functional scans for the group analyses. The structural scans were acquired as T1-weighted images, and aligned within the anterior commissure-posterior commissure line. A high resolution anatomical image was acquired for each subject using a volumetric three-dimensional Spoiled Gradient Recalled Acquisition sequence. Within plane structural images were acquired as 37 oblique axial slices (3.8 mm thick), with an in-plane resolution of 0.9375 mm2, and a field of view of 24 cm.
Blood oxygenation level-dependent (BOLD) functional images were acquired using a reverse spiral sequence covering 28 axial slices (3.8 mm thick) encompassing the entire cerebrum and the majority of the cerebellum (TR/TE = 2000/35 ms, FOV = 24 cm, matrix = 64 x 64). Scanning parameters were selected to optimize BOLD signal while maintaining enough slices to acquire whole brain data. Stimulus presentation was performed using E-prime (Psychology Software Tools, Inc., Pittsburgh, PA) on the standard MRRC computer, which also collected accuracy and reaction time data. The stimuli were projected on a screen positioned above the subject’s chest and were seen by the subject through a series of mirrors. The stimuli subtended approximately 30º of the visual field. Before the collection of fMRI data for each subject, we acquired and visually inspected localizer scans for artifacts (e.g. ghosting) as well as good signal
86
across the entire volume of acquisition, including the medial temporal lobes. All subjects included in these analyses were cleared of such problems.
3.8.
Analytical Procedures
Blood samples were collected from an indwelling forearm catheter contralateral to the infusion catheter, into appropriately labeled vacutainers and centrifuged at 4°C at 1700 g (2300-2500 RPM). Plasma or serum were decanted, transferred to appropriately labeled polypropylene tubes and stored at -80°C. Assays were performed in the Geriatric Psychopharmacology Laboratory. Citalopram concentrations were determined using a high-performance liquid chromatographic technique previously described.269 The limit of quantitation using ultraviolet (UV) detection is 5 ng/mL, and coefficients of variation are 2.9% at 15 ng/mL and 1.8% at 220 ng/mL.
3.9.
Genotyping
Coded blood samples were genotyped for the serotonin transporter polymorphism (5-HTTLPR). The presence of s and l alleles was determined using polymerase chain reaction amplification followed by electrophoresis, in the laboratory of Dr. Robert E. Ferrell.270 A polymorphism found in the l allele of approximately 15% of Caucasian subjects (Xu and Goldman, unpublished), which results in an A to G substitution,271 was also analyzed. One l/l homozygote had an A/G allele, but because it was only one subject, it could not be considered in the analysis.
87
3.10.
3.10.1.
Functional Magnetic Resonance Image Analysis
Data Preprocessing
Whole-brain image analysis was completed using the general linear model of SPM2 (http://www.fil.ion.ucl.ac.uk/spm). Images for each subject were realigned to the first volume in the time series to correct for head motion, spatially normalized into a standard stereotactic space (Montreal Neurological Institute template) using a 12-parameter affine model and smoothed to minimize noise and residual difference in gyral anatomy with a Gaussian filter, set at 6 mm full width at half maximum. Voxel-wise signal intensities were ratio normalized to the whole-brain global mean.
3.10.2.
Region of Interest Analysis
Predetermined condition effects at each voxel were calculated using a t-statistic, producing a statistical image for the contrast of the face-processing (emotional task) vs. shapes (sensorimotor task) for each subject. To assess the main effects of task-specific regional responses all six runs from both visits for each individual subject were averaged together using a one-sample t-test. These individual effects of task were then averaged across all eight subjects to examine taskspecific activity at a group level.
Region of interest (ROI) analyses were used to compare neuronal activation between baseline (Faces 1 task) and during citalopram or placebo treatments (Faces 2 and 3) within specific
88
regions known to be engaged by this task. An automated approach was used to define specific ROIs exhibiting an effect of interest.272, 273 The primary ROI, the amygdala, was used to test our hypotheses regarding the effects of citalopram and the role of genotype on the effects of citalopram. A paired-t test was used to assess changes across the scanning session (i.e. Faces 3 vs. Faces 1) within a single visit for each subject to examine effects of drug administration or habituation. The relationship between citalopram concentrations and amygdala reactivity was determined using linear regression analyses of the single-subject amygdala BOLD values and corresponding drug concentrations at the respective time of each scan. Genotype effects were explored using an analysis of variance (ANOVA) comparing amygdala reactivity between genotype groups (l/l homozygotes vs. s allele carriers) using the baseline task (Faces 1) on the first visit to prevent bias due to habituation to task. As a result of the a priori interest in the differential response of the amygdala, second-level analyses (i.e. linear regression or paired ttest) were completed using a mask including all voxels in the amygdala. A statistical threshold of p < 0.05, uncorrected, and at least 10 contiguous voxels, were used for all statistical analyses.
3.11.
Pharmacokinetic Analysis
Given the timing of the fMRI tasks, an optimal sampling strategy was determined using the Doptimal sampling algorithm in Adapt II (release 4). This model was informed using IV citalopram data from 379 subjects (unpublished). Citalopram kinetics were modeled using a two-stage population approach with a three-compartment continuous infusion model using individual nonlinear regression in WinNonlin® 4.0.1 (Pharsight Corporation, Mountain View, CA). Modeling was done for total citalopram concentrations. Given the known rate of infusion
89
(0.67 mg/min), the measured concentrations were used to estimate the following pharmacokinetic parameters: volume of distribution of the central compartment (V1), the rate constant for the return of drug from compartment 2 to compartment 1 (K21), the rate constant for the return of drug from compartment 3 to compartment 1 (K31), and the macro-constants for the tri-exponential decay alpha (α), beta (β) and gamma (γ). Average concentrations associated with each scan were calculated based on the individual fitted parameters for the 3-compartment citalopram pharmacokinetic model.
Average concentrations during each of the scans were
estimated and used in a linear regression with BOLD response measurements for each individual. Post-processing of WinNonlin estimates were plotted using Prism® (version 4.03; GraphPad Software, Inc., San Diego, CA).199
90
4. The Effects of Citalopram on Neuronal Activity
91
4.1. Demographics
All subjects provided written informed consent prior to any research procedures. Twenty-one subjects were screened for this study. Two subjects were excluded for past or current psychiatric illness. Eight subjects were excluded due to an abnormal ECG at screening. One subject was excluded due to elevated liver enzymes. Ten subjects were enrolled in the study. Of these, one subject withdrew because of claustrophobia in the scanner, and one subject withdrew due to bradycardia upon admission for the first study visit. Eight healthy men completed the study between November 2005 and February 2007.
The mean age of the subjects was 28 years (range
19 to 50 years). Their mean height was 182.35 cm (range 170 to 194 cm) and mean weight was 81.2 kg (range 58.7 to 97.5 kg); height and weight data was not available for one subject (n=7). The average level of education was 16 years (range 13 to 23 years).
92
4.2. Adverse Effects
Subjects completed the Citalopram Symptom Checklist (Appendix D) before discharge on each study visit, and by phone one week after study visit. Subjects rated their symptoms on a 4-point scale (0 = not at all, 1 = a little, 2 = some, 3 = a lot). Subjects reported the following symptoms after citalopram and placebo at discharge on the day of the study visit (Table 4.1) and one week after each visit (Table 4.2). All data are shown as median (range).
Table 4.1. Citalopram symptoms during study visit. Loss of appetite Tired Lightheadedness/Feeling faint Nausea Vomiting (yes/no) Headache Tense/Nervous/On edge/Restless Difficulty concentrating Shaky/Tremors Heart racing Sweating Diarrhea Short tempered/Irritable Happy Energetic Low energy/Fatigued Dry mouth
Citalopram 0 (0) 0 (0 to 2) 0 (0 to 1) 0 (0 to 2) none 0 (0) 0 (0) 0 (0 to 1) 0 (0) 0 (0) 0 (0) 0 (0) 0 (0) 0 (0 to 3) 0 (0 to 2) 0 (0 to 1) 0 (0 to 2)
Placebo 0 (0) 0 (0 to 1) 0 (0) 0 (0) none 0 (0) 0 (0) 0 (0) 0 (0) 0 (0) 0 (0) 0 (0) 0 (0) 0.5 (0 to 2) 0.5 (0 to 2) 0 0 (0 to 1)
Subjects reported mild or no side effects for both drug and placebo visits. Wilcoxon matchedpairs tests were performed for each symptom using Prism; no significant differences were found between drug and placebo visits.
93
Table 4.2. Citalopram symptoms one-week after study visit. Loss of appetite Tired Lightheadedness/Feeling faint Nausea Vomiting (yes/no) Headache Tense/Nervous/On edge/Restless Difficulty concentrating Shaky/Tremors Heart racing Sweating Diarrhea Short tempered/Irritable Happy Energetic Low energy/Fatigued Dry mouth
Citalopram 0 (0) 0 (0 to 1) 0 (0 to 2) 0 (0) none 0 (0) 0 (0) 0 (0 to 1) 0 (0) 0 (0) 0 (0) 0 (0) 0 (0) 0 (0 to 3) 0 (0 to 2) 0 (0) 0 (0 to 1)
Placebo 0 (0) 0 (0) 0 (0) 0 (0) none 0 (0) 0 (0) 0 (0) 0 (0) 0 (0) 0 (0) 0 (0) 0 (0) 0 (0 to 2) 0 (0 to 2) 0 (0) 0 (0)
Two subjects were lost to follow up and did not contribute to the data in this table. There were no significant differences at follow-up between drug and placebo. All subjects scored less than 10 on the Beck Depression Inventory at every evaluation.
94
4.3.
Main Effects of Task
The emotional paradigm, the faces task, is known to elicit a robust amygdala response.229,
253
The following figures represent the statistical difference between the faces (emotional) and shapes (control) tasks. Figure 4.1 shows a group map including all scans of all subjects (46 scans) of the region of interest analysis of neuronal activation statistically greater in the faces task than in the shapes task in the right (R) and left (L) amygdala. Table 4.3 shows the statistics at the voxel level, as well as cluster size, for both R and L amygdala. Cluster size reflects the number of contiguous voxels activated.
Figure 4.1. Group map of main effect of task in R and L amygdala (faces > shapes)
Sagittal view (top left), coronal view (top right), axial view (bottom left), and T score (bottom right), for all figures.
95
Table 4.3 Main effect of task in the amygdala (faces > shapes) T Coordinates Cluster size Voxel-level x,y,z (mm) (kE) Puncorr PFWE-corr PFDR-corr R amygdala 22 -2 -20 64 16.10 shapes)
Table 4.5. Main effect of task in BA47 (faces > shapes) Region
Coordinates Cluster size T Voxel-level x,y,z (mm) (kE) Puncorr PFWE-corr PFDR-corr L BA47 -32 26 4 45 9.10 shapes) Region Coordinates Cluster size T Voxel-level x,y,z (mm) (kE) Puncorr PFWE-corr PFDR-corr BA25 6 18 -18 64 4.06 0.002 0.944 0.991
98
4.4.
Effects of Citalopram on Task-related Neuronal Activity
The first specific aim of this study was to evaluate the effects of IV citalopram on task-related neuronal activation elicited during an affective task using fMRI. As shown in figure 3.1, subjects performed the task once before drug/placebo infusion (Faces 1) and twice during drug/placebo infusion, once early in the infusion (Faces 2) and once at the end of infusion (Faces 3). Figure 4.5 shows a cluster in the right amygdala that has increased activation for the Faces 2 task during the citalopram infusion, compared to the baseline Faces 1 task. Table 4.7 shows the statistics of the activated cluster.
99
Figure 4.5. Acute citalopram increases R amygdala activation (Faces 2 > Faces 1)
Table 4.7 Acute citalopram increases R amygdala activation (Faces 2 > Faces 1). Region
Coordinates Cluster size T Voxel-level x,y,z (mm) (kE) Puncorr PFWE-corr PFDR-corr R amygdala 22 -4 -20 55 3.01 0.010 0.817 0.829
100
Figure 4.6 shows an even greater response to citalopram, at the end of infusion (Faces 3), when the citalopram concentrations approach their maxima. Table 4.8 shows the statistics for the clusters with highest activation. There were no regions in the amygdala that decreased during Faces 2 or Faces 3 compared to Faces 1.
Figure 4.6. Acute citalopram increases bilateral amygdala activation (Faces 3 > Faces 1).
Table 4.8 Acute citalopram increases bilateral amygdala activation (Faces 3 > Faces 1). Region
Coordinates Cluster size T Voxel-level x,y,z (mm) (kE) Puncorr PFWE-corr PFDR-corr L amygdala -24 -6 -22 115 6.05 Faces 1).
Table 4.10. R amygdala activation increases during late placebo condition (Faces 3 > Faces 1). Region
Coordinates Cluster size T Voxel-level x,y,z (mm) (kE) Puncorr PFWE-corr PFDR-corr R amygdala 22 -8 -12 15 2.47 0.024 0.924 0.991
103
4.5.
4.5.1.
Serotonin Transporter Polymorphic Modulation of Citalopram Response
Effect of 5-HTT Genotype on Baseline Amygdala Reactivity
This study also aimed to determine whether 5-HTTLPR genotype predicts the BOLD fMRI response following IV citalopram administration.
An exploratory analysis was done to
determine the effect of 5-HTT genotype on baseline amygdala reactivity, as well as its effect on citalopram modulation of amygdala reactivity. Figure 4.9 shows that s allele carriers have a greater baseline amygdala response compared to l/l homozygotes, which replicates data from Hariri et al. as well as other studies.253, 274 The data used in this analysis were from the first scan (Faces 1) of each subject’s first visit, in order to prevent bias due to habituation. Table 4.11 shows the statistics for the clusters of highest activation in the left and right amygdala.
104
Figure 4.9. S allele carriers have a greater baseline amygdala response compared to l/l homozygotes.
Table 4.11 S allele carriers have a greater baseline amygdala response compared to l/l homozygotes. Region
Coordinates Cluster size T Voxel-level x,y,z (mm) (kE) Puncorr PFWE-corr PFDR-corr L amygdala -26 2 -16 37 3.94 0.004 0.742 0.548 R amygdala 30 2 -20 30 3.86 0.004 0.755 0.548
Figure 4.10 shows the fitted response data for baseline activation in the left amygdala for l/l homozygotes (n=3) and s allele carriers (n=5). Figure 4.11 shows the fitted response data for baseline activation in the right amygdala for the same subjects. S allele carriers (s/s and s/l) had greater baseline amygdala activation in both the left and right amygdala.
105
Figure 4.10. Baseline L amygdala activity by genotype.
fMRI BOLD response at [-26, 2, -16]
2 1 0 -1 -2 l/l
s/s or s/l
5-HTT genotype
Figure 4.11. Baseline R amygdala activity by genotype.
fMRI BOLD response at [30, 2, -20]
2 1 0 -1 -2 l/l
s/s or s/l
5-HTT genotype
106
4.5.2.
Effect of 5-HTT Genotype on Citalopram Modulation of Amygdala Reactivity
An exploratory analysis was done to visualize the effect of 5-HTT genotype on citalopram modulation of amygdala reactivity. SPM2, the software used to analyze the fMRI data, cannot execute a direct drug*genotype interaction, therefore separate analyses were done on each genotype using a paired t-test to compare citalopram effects (Faces 3 > Faces 1). Figure 4.12 shows the effects of citalopram on amygdala reactivity in l/l homozygotes (n=3). A robust effect was found in both the left and right amygdala. Table 4.12 shows the statistics on these clusters.
Figure 4.12. Citalopram effect on amygdala reactivity (Faces 3 > Faces 1) in l/l homozygotes.
107
Table 4.12. Citalopram effect on amygdala reactivity (Faces 3 > Faces 1) in l/l homozygotes. Region
Coordinates Cluster size T Voxel-level x,y,z (mm) (kE) Puncorr PFWE-corr PFDR-corr L amygdala -18 -2 -26 94 15.57 0.002 1.000 0.396 R amygdala 16 0 -16 33 11.01 0.004 1.000 0.396
Figure 4.13 shows the effects of citalopram on amygdala reactivity in the s allele carriers (n=5). Only the left amygdala shows an effect in this group, which appears to be relatively smaller and weaker than the effect seen in the l/l homozygotes.
Table 4.13 shows the statistics for this
cluster.
Figure 4.13. Citalopram effect on amygdala reactivity (Faces 3 > Faces 1) in s allele carriers.
108
Table 4.13. Citalopram effect on amygdala reactivity (Faces 3 > Faces 1) in s allele carriers. Region
Coordinates Cluster size T Voxel-level x,y,z (mm) (kE) Puncorr PFWE-corr PFDR-corr L amygdala -26 -6 -26 36 5.32 0.003 0.982 0.698
4.6.
Discussion
The amygdala is believed to play a key role in processing emotionally salient, threat-relevant, events that require further online processing by cortical regions. Emotional disorders such as depression and anxiety have been associated with hyperactivity of the amygdala, but it is unknown whether antidepressant treatment directly affects amygdala responses to emotionally significant information.
This study investigated the acute effects of IV citalopram and found that acute exposure to citalopram increased the amygdala response to emotional stimuli. Based on these data, it seems that the immediate effects of citalopram, which involve blocking the serotonin transporter and thus increasing the available synaptic serotonin, act to potentiate amygdala activity. There are reports that SSRIs are actually anxiogenic, and that only after several days or weeks on the medications that the true anxiolytic and antidepressant effects are seen. Other studies, however, find almost immediate therapeutic benefit from SSRIs.
Del-Ben and colleagues studied IV citalopram (7.5 mg infused over 7.5 min) in twelve healthy men in a single-blind placebo controlled crossover.235 The right amygdala/amygdaloid complex
109
(BA34) response to covert recognition of aversive compared to neutral faces was attenuated by citalopram. This group had actually predicted that citalopram would increase the amygdala response similar to our findings. Our results may differ for several reasons. This group gave a sub-therapeutic dose and scanned quickly after drug administration. It is possible that not enough drug reached the brain in time to produce an effect, and the effects seen may be due to habituation in stead of drug effects. Additionally, the washout in this study was a minimum of 3 days, which is not enough time for citalopram to be eliminated, considering its 36-hour half-life.
Harmer et al. studied the chronic effects of 7 days of oral citalopram administration on amygdala responses to masked presentations of fearful and happy facial expressions in never-depressed volunteers using fMRI.275
A double-blind, between-groups design was used with subjects
randomized to citalopram (20 mg/day) or placebo.
Subjects receiving citalopram showed
decreased amygdala responses to masked presentations of threat compared with those receiving placebo. Citalopram also reduced responses within the hippocampus and medial prefrontal cortex specifically during the fear-relevant stimuli. These neural differences were accompanied by decreased recognition of fearful facial expressions assessed after the scan. By contrast, there was no effect of citalopram on the neural or behavioral response to the happy facial expressions. These results using chronic (7 days) oral citalopram are the opposite of our data with acute administration (single IV dose). It may be that the initial increase in serotonin, which acts to potentiate amygdala reactivity, is the stimulus needed to start a negative feedback that ultimately results in a down-regulation of the system. Future studies should focus on the acute versus chronic effects of SSRIs. Future analyses of our data will include a direct drug*genotype interaction using a software package capable of such analysis.
110
5. Pharmacokinetic/Pharmacodynamic Modeling of Citalopram
111
5.1.
Citalopram Pharmacokinetics
Blood samples were collected at 0, 6, 15, 21, 30, 36, 35, 60, 90, 150, and 360 minutes after the start of infusion. Seventy-three samples were collected (15 missing samples) for the eight subjects. Citalopram kinetics were modeled using a two-stage population approach with a threecompartment continuous infusion model using individual nonlinear regression in WinNonlin® 4.0.1 (Pharsight Corporation, Mountain View, CA). The nonlinear regression was carried out with uniform weighting on the data values, since the maximum to minimum concentrations were within a 2-3 fold range. The model successfully converged for 7 of the 8 subjects. One individual was not able to be estimated due to missing blood samples, which led to insufficient data for the nonlinear regression and undefined parameter estimates.
The two-compartment
model previously described,219 did not adequately capture the concentrations measured during the infusion.
In addition, the Akaike's Information Criterion (AIC) was lower for 7 of 8
individuals using the 3 compartment model structure.
Therefore, the three compartment model
structure was selected.
The measured concentrations were used to estimate the following pharmacokinetic parameters: volume of distribution of the central compartment (V1), the rate constant for the return of drug from compartment 2 to compartment 1 (K21), the rate constant for the return of drug from compartment 3 to compartment 1 (K31), and the macro-constants for the tri-exponential decay alpha (α), beta (β) and gamma (γ). Average concentrations associated with each scan were calculated based on the individual fitted parameters for the 3-compartment citalopram pharmacokinetic model. A summary of the parameters was determined using the geometric
112
mean as a population descriptor with the standard deviations calculated for each parameter to reflect the population variability associated with that parameter, as shown in table 5.1. Figure 5.1 shows the population prediction curve generated for all individuals using the mean parameters. Individual pharmacokinetic data and individual predications are shown in figure 5.2.
Table 5.1. Citalopram pharmacokinetic parameters. Pharmacokinetic parameter Geometric mean Standard deviation
V1
k21
k31
alpha
beta
gamma
25.49878 0.020513 0.082882 2.05949 0.036281 2.43E-05 21.69853 0.02973 0.068761 1.693856 0.035713 0.000423
113
CONCENTRATION (ng/mL)
Citalopram Pharmacokinetics 90 75 60 45 30 15 0 0
40
80 120 160 200 240 280 320 360
TIME (min) Figure 5.1. Citalopram pharmacokinetics. Solid line is the population predicted concentration. 114
CITALOPRAM CONCENTRATION (ng/mL)
CITALOPRAM CONCENTRATION (ng/mL)
Figure 5.2. Individual pharmacokinetic profiles 60 50 40 30 20 10 360
0 0
25
50
75
100
125
60 50 40 30 20 10 360
0
150
0
25
50
60 50 40 30 20 10 360
0 0
25
50
75
100
125
CITALOPRAM CONCENTRATION (ng/mL)
CITALOPRAM CONCENTRATION (ng/mL)
30 20 10 360
0 100
20 10 300
0 25
50
125
40 30 20 10 0 0
40
80 120 160 200 240 280 320 360
CITALOPRAM CONCENTRATION (ng/mL)
CITALOPRAM CONCENTRATION (ng/mL)
TIME (min)
75 60 45 30 15 360
0 50
75
100
100
50
150
90
25
75
60
TIME (min)
0
150
30
TIME (min)
40
75
125
40
0
50
50
150
50
150
60
25
125
60
TIME (min)
0
100
TIME (min)
CITALOPRAM CONCENTRATION (ng/mL)
CITALOPRAM CONCENTRATION (ng/mL)
TIME (min)
75
125
150
90 75 60 45 30 15 360
0 0
TIME (min)
25
50
75
100
TIME (min)
115
125
150
5.2.
Correlation Between Citalopram Concentration and Amygdala Activity
A simple regression with correlation was performed in SPM2, using the average citalopram concentration calculated for each subject, during each scan, correlated with fMRI BOLD signal change representing the effect of citalopram (Faces 3 > Faces 1 during citalopram visit). Right amygdala was correlated with citalopram concentration as shown in Figure 5.3. Table 5.2 shows the statistics for this region of activation.
Figure 5.3. Right amygdala activation correlates with citalopram concentration.
Table 5.2. Right amygdala activation correlates with citalopram concentration statistics. Voxel-level Coordinates Cluster size T x,y,z (mm) (kE) Puncorr PFWE-corr PFDR-corr R amygdala 22 2 -16 42 3.64 0.001 0.155 0.896 Region
116
Figure 5.4 shows a linear regression of local maximum activation data extracted from the linear regression performed in SPM2 in the previous figure regressed with the individual citalopram concentrations (r2 = 0.4112, slope = 0.04073 ± 0.01118, F = 13.27, p = 0.0017).
Figure 5.4. Linear regression of right amygdala activation (local maximum) with citalopram concentration.
fMRI RESPONSE at [22, 2, -16]
2 1 0 -1 -2 -3
0
10
20
30
40
50
60
70
80
CONCENTRATION (ng/mL)
Figure 5.5 shows a linear regression of average cluster activation data extracted from the linear regression performed in SPM2 regressed with the individual citalopram (r2 = 0.2711, slope = 0.03464 ± 0.01303, F = 7.065, p = 0.0155)
117
Figure 5.5. Linear regression of right amygdala activation (cluster average) with citalopram concentration.
fMRI RESPONSE at [22, 2, -16]
2 1 0 -1 -2 -3
0
10
20
30
40
50
60
70
80
CONCENTRATION (ng/mL)
5.3.
Discussion
A 3-compartment model adequately described the citalopram pharmacokinetics. Citalopram concentrations were highly correlated with fMRI BOLD response in the right amygdala. This is evidence that the differences found in amygdala reactivity are truly reflective of drug-induced changes in the neuronal response to emotional stimuli. Future studies should utilize different doses as well as different timing of the tasks to better elucidate the time course of action.
118
6.
Conclusions
119
The amygdala is believed to play a key role in processing emotionally salient events, and hyperactivity of the amygdala has been associated with psychiatric disorders, including depression and anxiety. Until recently, the role of the amygdala in the effects of antidepressant treatment has been unknown. This study is the first to show that acute IV administration of the SSRI, citalopram, increases the amygdala response to emotional stimuli. Citalopram increased amygdala reactivity at two time points during the infusion, and citalopram concentrations were highly correlated with fMRI BOLD response in the right amygdala. This is evidence that the differences found in amygdala reactivity are truly reflective of drug-induced changes in the neuronal response to emotional stimuli. Conversely, administration of chronic (7 days) oral citalopram, resulted in a decrease in amygdala reactivity.275 These findings suggest that the immediate effects of citalopram, which involve blocking the serotonin transporter and thus increasing the available synaptic serotonin, act to potentiate amygdala activity, which then in turn may be the stimulus needed to start a negative feedback that ultimately results in a downregulation of the system.
The development of novel psychoactive drugs requires a better understanding not only of their mechanism of action, but their sites and time-courses of action. Future studies should focus on the acute versus chronic effects of SSRIs. Ideally the same individual would undergo a similar drug paradigm before and after a single dose of citalopram, and then again after several weeks of treatment. Future studies should also utilize different doses as well as different timing of the tasks to better elucidate the time course of action. Additionally, while it is important to study these drug effects in healthy individuals in order to understand the functional interactions in a healthy brain, it is also necessary to study populations of patients with disorders such as
120
depression and anxiety in order to elucidate the disruptions in brain circuitry as well as the alterations with treatment.
An exploratory analysis using serotonin transporter genotype as a covariate found that while s allele carriers (s/s and s/l) had a greater baseline amygdala response, l/l homozygotes had a greater response to citalopram. This is not surprising as subjects with the l/l genotype have a greater number of serotonin transporters, which is the site of action of SSRIs. Therefore genetic differences in the serotonin transporter may account for some of the variability in response to SSRIs. In the future, this data set will be used to analyze a direct drug*genotype interaction, and additional subjects will be recruited to increase the power to detect genetic differences. Future studies will also investigate other genes related to the serotonin system, including 5-HT1A, 5HT2A, and BDNF.
Neuroimaging technologies, because of their unique ability to capture the structural and functional integrity of distributed neural circuitries within individuals, provide a powerful approach in identifying regional effects of either drugs or genes. This study was able to find a robust drug effect after analyzing only eight individuals. These results are likely due to the use of a homogenous patient population, thus controlling for age, race, sex and other external variables. Additionally, this was the smallest sample size to reproduce the effect of serotonin transporter genotype on baseline amygdala reactivity.
While the genetic findings are
preliminary, due to the small sample size (3 l/l and 5 s allele carriers), it is important to note the effects of genotype on citalopram modulation of amygdala reactivity.
121
Multidisciplinary research capitalizing on such neuroimaging based integration will contribute to the identification of predictive markers and biological pathways for neuropsychiatric disease vulnerability as well as the generation of novel targets for therapeutic intervention.
Such
knowledge will contribute to our understanding of the mechanism of action of current treatments as well as the development of novel therapeutics, tailored to individual neurobiologies, which will be more effective in combating the enormous personal and public health burden associated with common psychiatric disorders.
122
APPENDIX A Abbreviations
123
Abbreviations 5-HT 5-HTT 5-HTTLPR AC ACTH AIC AIDS ALT ANOVA AST AUC BA BDI BDNF BOLD BUN CATIE CBC Cl Cmax CNS Cobs CPAD Cpred CREB CYP DAG DMC DSM-IV E2 ECG ECT EEG ER ERK F FDA FDR FMO fMRI FWE GABA GCRC
5-hydroxytryptophan, serotonin serotonin transporter 5-HTT gene-linked polymorphic region adenylate cyclase adrenocorticotropic hormone Akaike's Information Criterion acquired immune deficiency syndrome alanine aminotransferase analysis of variance aspartate aminotransferase area under the curve Brodmann area Beck Depression Inventory brain derived neurotrophic factor blood oxygenation level dependent blood urea nitrogen Clinical Antipsychotic Trials of Intervention Effectiveness complete blood count clearance maximum concentration central nervous system observed concentration Continuing Pharmacotherapy in Agitation and Dementia predicted concentration cAMP-responsive element binding protein cytochrome P450 diacylglycerol desmethylclomipramine Diagnostic and Statistical Manual of Mental Disorders, 4th edition estrogens electrocardiogram electroconvulsive therapy electroencephalography estrogen receptor extracellular regulated kinases bioavailability Food and Drug Administration false discovery rate flavin-monooxygenase functional magnetic resonance imaging family wise error gamma amino butyric acid General Clinical Research Center 124
h HAM-D HIV HRF IMP IND IP IP3 IPAM IRB IV Ka kE MAO MAOI MAPK MDD MDR1 MEMS min MRI MRRC NE NGF NIMH OCD PD PDK PDR PET PI3K PIP2 PK PKA PKB PKC PLC PMDD PMS RNA ROI SCID SD SPECTRUM SR SSRI
hour Hamilton Depression Rating Scale human immunodeficiency virus hemodynamic response function inositol monophosphatase investigational new drug inositol monophosphate inositol 1,4,5- trisphosphate integrated pharmacokinetic adherence measure institutional review board intravenous absorption constant cluster size monoamine oxidase monoamine oxidase inhibitor mitogen-activated protein kinase major depressive disorder multi-drug resistance pump1 electronic medication event monitoring minutes magnetic resonance imaging Magnetic Resonance Research Center norepinephrine nerve growth factor National Institute of Mental Health obsessive compulsive disorder pharmacodynamics phosphinositide-dependent kinase Physician’s Desk Reference positron emission tomography phosphatidylinositol-3 kinase phosphatidylinositol bisphosphate pharmacokinetics protein kinase A protein kinase B protein kinase C phospholipase C premenstrual dysphoric disorder premenstrual syndrome ribonucleic acid region of interest Structural Clinical Interview for Diagnosis of DSM-IV Disorders standard deviation Depression: The Search for Treatment-Relevant Phenotypes sustained release selective serotonin reuptake inhibitor 125
t½ TCA TRH TSH UDPGT UPMC UV Vd
half-life tricyclic antidepressant thyrotropin-releasing hormone thyroid-stimulating hormone uridyl diphosphate glucuronyl transferase University of Pittsburgh Medical Center ultraviolet volume of distribution
126
APPENDIX B Pharmacodynamics of IV Citalopram Using Functional MRI IRB Protocol and Consent Forms
127
A.
Principal Investigator:
Kristin L. Bigos, BS
Co-Investigators:
Bruce G. Pollock, MD, PhD, Robert R. Bies, PharmD, PhD, Howard J. Aizenstein, MD, PhD, Robert R. Ferrell, PhD, Ahmad R. Hariri, PhD
B.
Protocol Title:
Pharmacodynamics of IV Citalopram using Functional MRI
C.
Hypothesis and Specific Aims
This study aims to evaluate the effects of intravenous (IV) citalopram on neuronal activation elicited during an affective task using functional magnetic resonance imaging (fMRI) in healthy subjects. A second specific aim is to evaluate the impact of a polymorphism in the promoter region of the serotonin transporter gene (5-HTTLPR) on task-related neuronal activation during IV citalopram administration. We hypothesize that acute IV citalopram administration will oppose the task-related increase in neuronal activity in the amygdala, as measured by fMRI, and that this opposition will be blunted in subjects who carry the s allele for the 5-HTTLPR. D.
Background Information and Significance
The Serotonergic System. Serotonin, 5-hydroxytryptamine (5-HT), is a monoaminergic neurotransmitter known to mediate mood and emotion and a host of other basic functions including sleep and appetite. Serotonergic neurons project to most regions of the brain, with primary targets including the amygdala, hippocampus, hypothalamus, substantia nigra, caudate, putamen, nucleus accumbens, and multiple cortical areas.214 There is a great deal of evidence that dysregulation of the serotonin system is involved in the pathophysiology of depression and other psychiatric illnesses. In fact, many regions implicated in depression are regions regulated by serotonin including the amygdala, hypothalamus, caudate, as well as the frontal and cingulate cortices, as reviewed by Staley et al.215 The most common treatments for depression are selective serotonin reuptake inhibitors (SSRIs), which act at the serotonin transporter (5-HTT) to block the reuptake of serotonin, thus increasing serotonin concentration in the synapse. Because of these actions, SSRIs can also be used to measure serotonin function in the brain of both healthy and depressed patients. Citalopram. The SSRI, citalopram, is approved by the FDA for the treatment of depression, and is also commonly used in the treatment of other psychiatric illnesses, including obsessive compulsive disorder and panic disorder.222, 223 Citalopram is commercially available as an oral tablet (Celexa®), but is also available in an intravenous formulation under an IND. Citalopram, the only SSRI available in IV formulation, is well-tolerated at doses up to 40 mg.217, 219, 220, 224 Like other SSRIs, citalopram is believed to exert its pharmacological effects by blocking 5-HT reuptake at the serotonin transporter, and has negligible effects on other transporters including dopamine and noradrenaline transporters, and little to no affinity for other neurotransmitter receptors such as the gamma amino butyric acid (GABA), opioid, and muscarinic receptors.222, 223 Because of its selectivity and tolerability, IV citalopram, can be used as a probe for in vivo assessments of serotonin function. Positron emission tomography (PET) studies have shown that citalopram alters cerebral glucose metabolism, as measured by changes in the radiotracer [18F]-FDG, in areas of the brain thought to be involved in the pathophysiology of depression and anxiety. One such study in healthy men and women showed that IV citalopram decreased cerebral glucose metabolism in the right (R) anterior cingulate gyrus, R superior and R middle frontal gyrus, R parietal cortex (precuneus), R superior occipital gyrus, left (L) thalamus, and R cerebellum, while it increased glucose metabolism in the L superior temporal gyrus and L occipital cortex.226 The regions
128
identified overlap with areas thought to be important in the pathophysiology of depression and may indicate regions important for treatment response; however PET has low spatial resolution and therefore may not be sensitive enough to detect effects on many smaller subcortical structures. FUNCTIONAL MAGNETIC RESONANCE IMAGING. When compared to PET, fMRI has better spatial and temporal resolution, and can been used to non-invasively measure drug-induced changes in task-related neuronal activation. fMRI allows researchers to study regional brain activity while subjects are performing sensory, motor, cognitive, or affective tasks using rapid sequential imaging. Tasks have been designed to activate specific regions of the brain involved in the regulation of mood and behavior, including the amygdala. Regional blood flow and glucose metabolism in the amygdala consistently correlate positively with depression severity, and metabolism in the amygdala decreases toward normal during antidepressant drug treatment.228 It is known that the amygdala plays an important role in the recognition of certain facial emotions, particularly fear, and one task has been designed to engage the amygdala through the cognitive evaluation of angry and fearful human faces.229 Using fMRI, researchers have been able to show that some psychoactive drugs cause regionally specific patterns of neuronal activation during cognitive and affective tasks.230, 231 One such study found that oral dextroamphetamine (0.25 mg/kg), a nonspecific monoaminergic agonist, induced a significant increase in the blood oxygenation level dependent (BOLD) signal of the R amygdala in response to the fearful faces task.231 fMRI has been used to evaluate the effects of the oral SSRIs, fluoxetine232 and paroxetine,233 on neuronal motor pathways, and one study found that chronic fluoxetine treatment decreased amygdala activation.234 However no studies have evaluated the acute effects of SSRIs on cognitive or affective tasks. A pilot study evaluated the effects of IV citalopram (7.5 mg over 7.5 min) on fMRI response in a single-blind crossover design in 12 healthy young men; however the investigators did not employ a task.276 Compared to placebo infusion, neuronal activity was increased in the anterior cingulate gyrus, caudate, R posterior orbitofrontal cortex, R amygdala, and R brainstem extending into the hypothalamus, while neuronal activity was decreased in the R hippocampus and R precuneus. To date there have been no studies which evaluate the acute effects of SSRIs on task-related neuronal activation related to mood or cognition. This study is designed to determine the effects of the SSRI, citalopram, on affective task-related neuronal activation. SEROTONIN TRANSPORTER GENETICS. The serotonin transporter (5-HTT) regulates the magnitude and duration of serotonergic responses by modulating the levels of 5-HT in the synapse.236 Dysregulation of 5-HTT has been associated with several psychiatric disorders including depression242, 243 and anxiety.237-241 A polymorphism exists in the transcriptional control region upstream of the 5-HTT coding sequence.244 Insertion or deletion of a 44 basepair segment in this 5-HTT gene-linked polymorphic region (5-HTTLPR) results in long (l) and short (s) variants. The s allele is associated with decreased transcriptional efficiency of the 5HTT gene promoter and a decrease in 5-HTT expression and 5-HT uptake.244, 245 The s allele is also differentially associated with anxiety-related behavioral traits in healthy subjects; those carrying the s allele have been shown to be slightly more likely to have abnormal levels of anxiety245 and develop conditioned fear responses,249 resulting in an increased incidence of affective illnesses,250 when compared to those homozygous for the l allele. Studies have found that individuals with one or two copies of the s allele exhibit greater amygdala neuronal activation in response to fearful stimuli compared with individuals homozygous for the l allele, as measured by change in BOLD fMRI signal.253, 274 Therefore 5-HTT genotype can predict taskrelated neuronal activation as measured by fMRI. This study aims to determine whether the 5HTTLPR polymorphism can predict the objective BOLD fMRI response to IV citalopram.
129
SIGNIFICANCE. The development of novel psychoactive drugs requires a better understanding not only of their mechanism of action, but their sites and time-courses of action as well. Antidepressants are the second most commonly prescribed class of medications in the United States. While much is known about their mechanism at the cellular level, it is still largely unknown how their effects on functional interactions between distinct brain regions alter mood and behavior. Further elucidation of these mechanisms through functional studies will be useful in explaining the variability in patient response. This study will generate the first in vivo human data regarding the regional effects of acute SSRI administration on affective task-related neuronal activation. Functional MRI will allow us to better understand the actions of SSRIs at the neuronal level in real-time, and may shed light onto the functional interactions between distinct brain regions involved in the actions of SSRIs. An understanding of the regional effects of SSRIs will aid in predicting patient response to these agents. By including 5-HTTLPR genotype in the analyses, we may account for some of the variability in response to citalopram. E.
Progress Report and Preliminary Studies
Data on the safety of IV citalopram is included in the section above.217, 219, 220, 224 There are no data using fMRI in the evaluation of IV citalopram. F.
Research Design and Methods
DRUG INFORMATION. Parenteral citalopram will be administered under IND #48,032 of the FDA, held by one of the listed investigators, Dr. Bruce G. Pollock. Once approved, this protocol will be submitted to the FDA as part of this IND. The recommended starting dose of oral citalopram is 20 mg with a maximum dose of 60 mg/day. Although 40 mg is well tolerated in both oral and IV formulations, 20 mg was chosen due to the potential for nausea and vomiting that may compromise the safety of the subject.219, 226 In addition, BOLD is a sensitive response measure which may lose specificity for regional activation at doses higher than 20 mg. DESIGN AND OVERVIEW. This study is a randomized, double-blind, placebo-controlled crossover of IV citalopram (20 mg infused over 30 min) and normal saline during two one-hour fMRI scans while subjects complete affective and sensorimotor tasks. An unblinded investigational pharmacist at the University of Pittsburgh Medical Center will randomize each subject to receive either citalopram or placebo on their first visit and the opposite treatment on the following visit. Visits will be separated by a minimum washout period of two weeks. All subjects will give informed consent before undergoing any research procedures. Sixteen subjects, eight homozygous for the l allele (l/l) and eight with at least one s allele (s/l or s/s), will be recruited to participate in the study. SCREENING VISIT. Subjects will be recruited from established research studies being conducted at the University of Pittsburgh by the investigators. Through their initial participation, subjects completed behavioral measures and provided a genetic sample. The subjects’ samples have been genotyped for the 5-HTTLPR. Subjects will also be recruited in the community through advertisements. This study will recruit healthy, right-handed, non-smoking Caucasian men between the ages of 18 and 60 years. These selection criteria are designed to minimize between-subject variation and possible age-related and ethnic differences in fMRI response.266 As part of this study, subjects will provide a 10 mL blood sample, which will be used to sequence the 5-HTTLPR to ensure that other polymorphisms in the 5-HTT gene, in particular the A to G substitution in the l allele, are characterized. The screening visit for the study will be conducted at the General Clinical Research Center (GCRC) of the University of Pittsburgh Medical Center (UPMC). Screening will include a complete medical history, physical examination (including height, weight, blood pressure and heart rate), biochemical and
130
hematological laboratory screen (albumin, BUN, calcium, CBC, chloride, serum creatinine, glucose, hematocrit, hemoglobin, serum phosphorus, potassium, prothrombin time, partial thromboplastin time, AST/ALT, and sodium), blood alcohol, serum cotinine, and urine drug screen, within 28 days of the first study day. An electrocardiogram (ECG) will be done to rule out subjects with cardiac electrophysiological problems, in particular bradycardia (heart rate less than 50 beats per minute), which may increase the risk of cardiac side effects associated with SSRIs. The modified Structural Clinical Interview for Diagnosis (SCID) of DSM-IV Disorders will be conducted by a trained interviewer to screen subjects for psychiatric illness.267 In addition to the SCID, subjects will complete the Beck Depression Inventory, which is a 21-item self-report rating inventory measuring characteristic attitudes and symptoms of depression (Beck et al., 1961). If a clinically significant, unanticipated disease or condition is identified during the conduct of screening, the participant will be informed of the discovery by the investigators, and if requested, the participant will be referred appropriately. If a subject has a BDI score of 10 or greater at any time, they will be removed from the study and referred to a psychiatrist for assessment and follow-up. If the subject endorses the suicide item on the BDI, they will be immediately referred to the emergency department at Western Psychiatric Institute and Clinic. If the subject scores a 10 or higher, but does not endorse the suicide item, we will offer a referral and follow-up with the subject the next day. STUDY VISITS. Subjects will refrain from the use of over the counter and prescription drugs and grapefruit juice for one week prior to the first study visit and refrain from alcohol and caffeine for 48 hours prior to each study visit. Subjects will be admitted to the GCRC the morning of the study day and will complete a baseline BDI. A baseline electrocardiogram will be done; any subject with an abnormal ECG will be removed from the study and referred for follow-up care with a physician. Vital signs (blood pressure and heart rate) will be also measured at baseline, after the infusion, and before discharge. A urine sample for drug screen will be obtained and intravenous catheters will be placed in each forearm, one for drug/placebo infusion and the other for multiple blood sampling. Subjects will be escorted to the MRRC where they will complete an MR safety questionnaire, which will be reviewed orally with MRRC staff prior to each scan to ensure their safety while in the magnet. In subjects with a questionable history of metallic fragments, an X-ray study of the suspected body area will be performed prior to the MRI to rule out such. Subjects will be in the scanner for one hour as detailed in the figure below. Infusion 0 to 30 (min)
Shapes
Faces
31 to 36
Faces
TAP 3
22 to 30
Shapes
FACES 3
16 to 21
Faces
TAP 2
7 to 15
Shapes
FACES 2
1 to 6
Shapes
TAP 1
-8 to 0
Faces
FACES 1
-23 to -8 (min)
Shapes
Structure scans
6 tasks
During the first 15 minutes a series of structural scans will be acquired, which will be used to align the functional MRI acquisition and for cross-registration of the functional scans for the group analyses. Immediately after the structural scan, the subjects will perform tasks during the 45 minute functional scanning. A blocked design will be used for the fMRI tasks. The first block of tasks (FACES) includes an emotion task (faces) and a sensorimotor task (shapes). During the faces task, subjects will be asked to match the facial expression (either angry or afraid) of
131
one of two faces to that expressed by a simultaneously presented target expression. The faces task is known to elicit a robust amygdala response.229, 253 Twelve different images will be used, six per block, all derived from a standard set of pictures of facial affect. The identity of all three faces is always different and an equal number of male and female faces will be presented. As a sensorimotor control task (shapes), subjects will be asked to match one of two geometric shapes with a simultaneously presented target shape. Six different sets of geometric forms will be used in the control condition. Between images, subjects will be instructed to fixate on a black cross-hair in the middle of the screen. As shown in the figure, FACES, involves 9 experimental blocks: 5 blocks of the shapes task (control) interleaved with 4 blocks of the faces task (experimental). Each block contains 6 trials, lasting 5 seconds each. Before each block, a brief instruction (“match emotion” or “match form”) will be presented for 2 seconds. During the task, subjects will respond with button presses, which will allow us to determine accuracy and reaction time. A complete FACES block takes approximately 8 minutes and will be completed once before the infusion and twice during the infusion. In the second block, the sensorimotor control task (TAP) will be done to acquire a baseline fMRI BOLD signal for each subject and to compare the time course of the hemodynamic response function across the entire scanning session. Subjects will be instructed to press both buttons, with their index fingers, every time they see the word TAP appear on the screen. The stimulus will appear every 12 seconds and will remain on the screen for 1 second. In the interim, subjects will be instructed to fixate on a white cross-hair in the middle of the screen. This task takes 5 minutes and will be completed twice during the infusion and once after the infusion. As indicated in the figure, the infusion will begin at time 0 min, after the structural scan and the baseline FACES 1 functional scan. Either citalopram (20 mg in 0.9% saline) or placebo (0.9% saline) will be infused for 30 min while subjects are asked to perform the tasks. Subjects will rest for one minute between tasks while investigators prepare the next task and give the subjects instructions. Blood samples (10 mL) will be taken between tasks to determine drug and metabolite concentrations at baseline (0 min), during the infusion (6, 15, and 21 min), at the end of infusion (30 min), at the end of the scan (36 min), and 45, 60, 90, 150, and 360 min. Additional blood samples (5 mL) will be taken to determine cortisol and prolactin concentrations at 0, 15, 30, 45, 60, 90, and 150 min. Before discharge, subjects will have an ECG and complete the BDI and side effect questionnaire. If a subject has an abnormal ECG, they will be evaluated by the admitting physician, Dr. Aizenstein, and referred for follow-up care. If a subject has ECG changes after drug administration, the adverse event will be reported according to IRB and FDA regulations. One week following each study visit, the subjects will be called by one of the listed investigators and complete the BDI and side effect questionnaire. SCANNING PROCEDURES. All fMRI scans will be conducted at the University of Pittsburgh Medical Center Magnetic Resonance Research Center (MRRC) on a 1.5 Tesla Signa MR Scanner (General Electric Medical Systems, Milwaukee, WI). During the screening visit, subjects will be given the opportunity to become acclimated to the study conditions in a simulation scanner. Structural MRI will be performed prior to the functional scans to align the functional MRI acquisition and to cross-register the functional scans for the group analyses. The structural scans will be acquired as T1-weighted images, and aligned within the anterior cortex-posterior cortex line. A high resolution anatomical image will be acquired for each subject using a volumetric three-dimensional Spoiled Gradient Recalled Acquisition sequence. Low resolution anatomical images will be acquired as 36 oblique axial slices with a slice thickness of 3.8 mm, an in-plane resolution of 0.9375 mm2, and a field of view of 240 mm2. Functional scanning will be performed using a one-shot spiral pulse sequence, with TE = 35 msec and TR = 2000 msec. Twenty-six oblique axial slices will be acquired as T2*-weighted
132
images with a slice thickness of 3.8 mm, an in-plane resolution of 64 x 64 (with 3.75 mm2 pixels), and a field of view of 240 mm2. Stimulus presentation will be performed using E-prime (Psychology Software Tools, Inc., Pittsburgh, PA) on the standard MRRC computer, which will also collect accuracy and reaction time data. The stimuli will be projected on a screen positioned above the subject’s chest and will be seen by the subject through a series of mirrors. The stimuli subtend approximately 30º of the visual field. ANALYTICAL PROCEDURES. Blood samples will be collected from an indwelling forearm catheter contralateral to the infusion catheter, into appropriately labeled vacutainers and centrifuged. Plasma or serum will be decanted, transferred to appropriately labeled polypropylene tubes and stored at -80°C. Assays will be performed in the laboratory of Dr. Pollock. Citalopram concentrations will be determined using a high-performance liquid chromatographic technique previously described.269 The limit of quantitation using ultraviolet (UV) detection is 5 ng/mL, and coefficients of variations are 2.9% at 15 ng/mL and 1.8% at 220 ng/mL. Both the R(-) and S(+) enantiomers of citalopram will be measured separately, as well as its metabolites demethylcitalopram and didemethylcitalopram. The limit of quantitation for each enantiomer is 10 ng/mL by UV detection. Serum cortisol and prolactin will be quantified using an enzymelinked immunoassay (Diagnostic Systems Labs; Webster, TX). Prolactin measures are linear from 2 to 180 ng/mL with a coefficient of variation of 1.2 to 10.7%. Cortisol measures are linear from 0.5 to 60 μg/mL with a coefficient of variation of 1.0 to 7.4%. GENOTYPING. Coded blood samples have been genotyped for the serotonin transporter polymorphism (5-HTTLPR) as part of participation in previous studies by these investigators. The presence of s and l alleles was determined using polymerase chain reaction amplification followed by electrophoresis.270 As part of this study, samples will be sequenced in the laboratory of Dr. Ferrell, to ensure that other polymorphisms in the 5-HTT gene are characterized. A polymorphism found in the l allele of approximately 15% of Caucasian subjects (Xu and Goldman, unpublished), which results in an A to G substitution,271 will be taken into consideration when comparing s and l genotypes. Research subjects recruited from the community will be genotyped for the 5-HTTLPR. During the screening visit, a 10 mL sample will be taken for genotyping. This sampled will be genotyped and stored using only their subject number (without identifiers) in the laboratory of Dr. Ferrell. Their genotype information will only be shared with the co-investigators listed on this protocol. G.
Biostatistical Design and Analysis
SAMPLE SIZE ANALYSIS. In a previous fMRI study using the FACES task, the percent change in BOLD fMRI signal had a standard deviation of 0.187% in subjects with the l (l/l) allele (n=14) and 0.299% in subjects with at least one s (s/s or s/l) allele (n=14).253 The pooled standard deviation for both groups (all genotypes) was 0.245%. We believe that although we are proposing a crossover study, the within-subject variability in signal change would not be greater than the intersubject variability observed previously, and therefore the intersubject variability will provide a more conservative sample size estimate. Based on the proposed sample size of 16 subjects, we have an 80% power, with a type-I error of 5% (α=0.05), to detect a difference of 0.260% BOLD fMRI signal change using a t-test. A previous fMRI study using this task resulted in a signal difference much larger than 0.260%, between drug and placebo.230 IMAGE ANALYSIS: DATA PREPROCESSING. fMRI data will be corrected for movement using a 6parameter linear algorithm,277 and spatially smoothed using an 8 mm full width-half maximum Gaussian filter. A linear detrending algorithm will be performed using only the data within 3 standard deviations (SD) of the mean to estimate the linear trend. An outlier-correction
133
algorithm will also be performed to remove data that are more than 7 SD from the mean. Global normalization will be performed multiplicatively to give each subject a mean intensity of 3000. REGION OF INTEREST ANALYSIS. The anatomical regions of interest (ROI) were selected from those known to be altered by citalopram226, 276 and/or involved in perceptual face processing.231, 278 An automated approach will be used to define the primary ROI, the amygdala, as previously described.266, 279 Secondary regions of interest will be mapped separately using Talairach coordinates (x, y, z; mm) determined by PET studies of citalopram.226 The primary ROI will be used to test our hypotheses regarding the effects of citalopram and the role of genotype on the effects of citalopram. A set of mean fMRI signal values will be calculated for each subject for each task (faces and shapes) within each block (FACES 1, 2, and 3). This difference between faces and shapes for each block will be compared using an analysis of variance (ANOVA) to test for a significant interaction of treatment by task, i.e. whether citalopram alters the amygdala BOLD response to an emotional task. Similarly, we will use an ANOVA to test for a significant interaction of treatment*task*genotype, i.e. if patients who carry the s allele have a different response to citalopram during task. If significant differences are identified, a t-test will be used to compare each combination of block, treatment, and genotype. A similar analysis will be conducted for each additional ROI. A set of mean fMRI signal values will be calculated for each subject for each task, within each block, during each treatment. The analysis for significant differences in activations will be performed using an ANOVA, and post-hoc t-tests will be used to compare each combination when indicated. EXPLORATORY ANALYSIS. An exploratory analysis will be used to identify regions of the brain that have different activation during the citalopram and placebo treatments, which have not been previously described. In this analysis, we will conduct an ANOVA to compare the interaction of block by treatment. This will generate an F-map summarizing the effect of treatment on response to faces across blocks for each voxel, i.e. a brain image in which each of the 64x64x26 voxels is an F-value representing the effect for that particular location in the brain. The F-map will then be thresholded with an alpha of 0.01. To correct for multiple comparisons, we will only consider those voxels which are significant for eight contiguous voxels.280 In examining these group differences, all data must first be normalized into a standard brain coordinate system, such as Talairach space, in order to take into account the variability in brain shape and size across subjects. CONTROL TASK ANALYSIS. The sensorimotor control task (TAP) will be done to acquire a baseline fMRI BOLD signal for each subject and to compare the time course of the hemodynamic response function (HRF) across the entire scanning session. To test whether citalopram alters the overall HRF, we will use this task as a covariate and therefore control for systematic differences in the BOLD signal. This would be necessary if, for example, citalopram changed the coupling of neural activation. PHARMACOKINETIC ANALYSIS. An optimal sampling strategy given the timing of fMRI tasks was determined using the D-optimal sampling algorithm in Adapt II (release 4). This model was informed using IV citalopram data from 379 subjects (unpublished). Citalopram kinetics will be modeled using a mixed-effect population approach with a two-compartment continuous infusion model, as previously described.219 Given the known rate of infusion (0.67 mg/min), we can use the concentrations measured to estimate the following pharmacokinetic parameters: volume of distribution of the central compartment (Vc), volume of the peripheral compartment (Vp), intercompartmental clearance (Cld), and systemic clearance (Cl). Acute exposure will be determined by the plasma area under the concentration time curve from 0 to 360 min (AUC360). Modeling will be done for total citalopram concentrations and for both the R and S enantiomer separately. Pharmacokinetic parameters will be individually correlated with BOLD fMRI
134
response as an exploratory analysis to determine whether any kinetic parameters or acute exposure (AUC360) predict BOLD fMRI response to citalopram. HORMONE ANALYSIS. Area under the curve (AUC) from 0 to 150 min for cortisol and prolactin has previously been used to measure the neuroendocrine response to IV citalopram.219 We propose to estimate AUC from 0 to 150 min for cortisol and prolactin, and correlate these values with the percent BOLD fMRI signal change during citalopram treatment. Previous literature using fMRI, without a task, found significant correlations between hormone AUCs and neuronal activation in several brain regions after IV citalopram (7.5 mg/7.5 min).276 H.
Human Subjects 1.
Subject population
Subjects will be recruited from established research studies being conducted at the University of Pittsburgh by the investigators, including the Functional Genomics Imaging Study (FIGS) and Neuroimaging Markers of Vulnerability to Depression. Through their initial participation, subjects completed behavioral measures and provided a genetic sample, which has been genotyped for the 5-HTTLPR. Subjects will also be recruited in the community through advertisements, which will be posted throughout the university and UPMC. There are well-characterized differences in fMRI response between men and women, and between young and elderly subjects; therefore this pilot study will be conducted in healthy nonsmoking men (age 18 to 60 years), in order to limit variability due to sex or age and to increase the probability of detecting a treatment effect. Similarly, there are known differences between subjects of different racial and ethnic origins; therefore this study will be restricted to the study of Caucasian (white) subjects in order to maximize the probability of detecting a main effect of 5HTT genotype. Additionally, there are no human data on the effects of IV citalopram on taskrelated neuronal activation; therefore it is appropriate to limit the study population to generate pilot data to power a larger analysis. Additionally, the extraordinary cost of MRI limits the number of subjects that can be scanned. In order to maintain a balanced design that will have the power to detect a difference between responses of individuals of different genotypes, it is necessary to recruit the same number of individuals of each genotype. If patients were recruited without regard to genotype, it is very likely that the number of individuals of each genotype would be skewed. This would lead to an unbalanced sample and a loss of power in the analysis. Therefore sixteen subjects (8 l/l and 8 s/l or s/s) will be selected to participate in this study. Subjects will be excluded if they have a past or current psychiatric disorder, neurological disorder (including stroke, brain tumor, epilepsy, significant head injury, Alzheimer’s, Parkinson’s or Huntington’s disease) or an uncontrolled medical disorder. Subjects will be excluded for having a positive alcohol or cotinine level on the screening visit. Subjects will be excluded for having a positive drug screen on a screening or study visit. Subjects taking known cytochrome P450 enzyme-inducing or enzyme-inhibiting agents within one month of the study, and/or any chronic medications (including over the counter drugs) within one week of the study will also be excluded. Subjects will also be excluded if they have ever had an adverse reaction to oral citalopram or any other SSRI. Subjects who have a contraindication to MRI, including a pacemaker, defibrillator or other medical implant, bullets, shrapnel, or other metal objects, or claustrophobia will not be eligible.
135
The safety and effectiveness of citalopram have not been established in pediatric patients; therefore children under the age of 21 will not be recruited for this study. Celexa® (oral citalopram) is not approved for use in treating any indications in the pediatric population. 2.
Targeted/Planned Enrollment Table Ethnic Category
Females
Males
Total
Hispanic or Latino Non Hispanic or Latino
0 0
0 16
0 16
Ethnic Category Totals
0
16
16
0 0
0 0
0 0
0 0 0
0 0 16
0 0 16
0
16
16
Racial Categories American Indian Asian Native Hawaiian or other Pacific Islander Black or African American White Racial Categories: Total of all Subjects
3.
Sources of Research Material
All specimens and data collected are for research purposes only. Medical and psychiatric information will be obtained for the purposes of screening for healthy subjects. Blood samples will be obtained for the purpose of measuring drug and hormone concentrations, genotype analyses, and medical screening. Total blood collected in this study is 325 mL, which is less than a normal blood donation (480 mL). Urine will be collected for screening for drugs of abuse. 4.
Recruitment Methods and Consent Procedures
Subjects will be recruited from research studies being conducted by these investigators, including the Functional Imaging Genomics Study (FIGS; IRB#0403005) and Neuroimaging Markers of Vulnerability to Depression (IRB#011170). These subjects have given their consent to be contacted for future research studies. Subjects will be informed of this new research study by one of the listed investigators and given the option of participating. The recruitment letter is included in Appendix 3. Subjects interested in this study will be asked to provide written consent using a University of Pittsburgh Institutional Review Board (IRB) approved consent form. It may be necessary to recruit additional subjects that have not formerly participated in a study. In the event that additional subjects must be recruited, advertisements will be posted throughout the university and the University of Pittsburgh Medical Center (UPMC), and potential subjects will also be appropriately consented and screened for this study. The advertisement is included in Appendix 4. We will also include an advertisement on the Office of Clinical Research website. The study will be explained to the subjects by Kristin Bigos (PI) and given a chance to ask questions. Then Howard Aizenstein, a co-investigator and admitting physician for this study, will be called. The subject will have a chance to discuss the study with Dr. Aizenstein over the phone, and have any questions answered by the physician. Ms. Bigos will sign the consent form and Dr. Aizenstein will sign the consent form at a later time.
136
5.
Potential Risks
This research study is considered moderate risk. Citalopram is not FDA-approved for parenteral use, therefore the probability and magnitude of harm or discomfort anticipated in this research study is greater than encountered in daily life. However, the planned research activities do not pose a significant likelihood of a serious adverse event to involved research subjects. Common adverse events (occurring in 10-25% of people) of chronic oral citalopram include nausea, dry mouth, somnolence, insomnia, and increased sweating. (Celexa [package insert]. St. Louis, MO: Forest Pharmaceuticals Inc.; 2004) Infrequent adverse events (occurring in 1-10% of people) include diarrhea, tremor, fatigue, ejaculation disorder, upper respiratory infection, rhinitis, anxiety, anorexia, abdominal pain, agitation, impotence, and decreased libido. Recently the risk of suicide has been suggested to be associated with chronic use of SSRIs. (Celexa [package insert]. St. Louis, MO: Forest Pharmaceutical Inc.; 2004) It is possible, however unlikely, that acute IV citalopram will increase the risk of suicide in these patients. No serious or life-threatening side effects have been reported during the use of IV citalopram. Based upon our experience to date with these procedures, the following adverse events are expected during the study day. Likely adverse events (occurring in more than 25% of people) include lightheadedness and feeling tired. Common adverse events (10% to 25%) include nausea, loss of appetite, difficulty concentrating, low energy/fatigue, and headache. Infrequent adverse events (1% to 10%) include vomiting, shaky, heart racing, sweating, dry mouth, and hunger. Rare adverse events (