items: 'Humanity, brotherhood and solidarity are all nonsense. Everybody has to take care of themselves first and defend their own interests' and 'People should.
Van de Walle, S. (2008). Perceptions of corruption as distrust? Cause and effect in attitudes towards government. In: Huberts, L., Jurkiewicz, C., & Maesschalck, J. (eds.). Ethics and integrity and the politics of governance. Cheltenham: Edward Elgar, pp. 215-236.
PERCEPTIONS OF CORRUPTION AS DISTRUST? CAUSE AND EFFECT IN ATTITUDES TOWARDS GOVERNMENT. Steven Van de Walle
Introduction
A foreigner moves to Belgium, and needs a telephone line in his new apartment. His Belgian friends wish him good luck, telling him it will take months, unless he has some connections in the public telephone company, or knows a politician who could intervene for him. The foreigner, not being well-connected, reluctantly decides to follow the standard procedure, and visits the telephone company’s office the next day. To his surprise, he is the only customer there and is able to file his application within 20 minutes, helped by a very friendly employee. One day later, his telephone is connected. His friends are amazed. Pleasantly surprised about this fast service, he goes back to the telephone company’s office, taking a bottle of his native country’s wine for the friendly and helpful employee, and asked the employee how comes his telephone was connected that fast, while everyone told him it would take months. The employee smiles and tells him, ‘well, you know, you were the first customer in weeks following the normal procedure, and not having some local politician call us. We really appreciated that, and decided to connect your telephone right away’. This joke, emergent from the 1980s, illustrates how political and other ‘connections’ have been a central element in the functioning of public services in Belgium. Belgium has had an image of being a corrupt country for a long time
(Maesschalck, 2002; De Winter, 2003). A number of high-profile corruption scandals in the 1980s and 1990s has contributed to this image, and the structure of the party-political system has been a major factor in some of these cases (De Winter, 2000). Recently, however, there appears to have been a positive evolution (Van de Walle, 2004b). In this chapter, we use a representative survey of 3168 Flemish citizens to analyze the determinants of perceptions of administrative and political corruption. We will show that citizens’ perceptions of corruption are embedded in general attitudes towards government and that subjective corruption indicators may be heavily influenced by predispositions towards government, and therefore do not reflect the respondents’ personal experience with corruption. Because many citizens do not have frequent personal experience with corrupt practices, the answer they give in surveys is influenced by other factors. The absence of an experiential basis allows respondents considerable freedom to take certain other attitudinal aspects into account. This creates problems of comparability and invites respondents to broaden their frame of reference to whatever factor they wish when giving an opinion on corruption. Perceptions of administrative corruption, hence, both contribute to the general attitudes towards the administration and government as well as being a consequence of them (Van de Walle, 2004c). In the first section we briefly present some of the available survey material on citizens’ perception of public sector corruption in Belgium. Using data from a general survey administered in Flanders (Northern part of Belgium) in 2003, we subsequently analyze determinants of general perceptions of corruption and unethical behavior. We show that these perceptions are to a large extent influenced by feelings of political alienation and general attitudes towards government. It is therefore difficult to distinguish cause and effect between trust in government and perceptions of corruption. We then will show that general perceptions of corruption should not be seen as an expression of individual experience. Parallels become
apparent with how citizens evaluate government services, where a disconnection seems to exist between generally positive personal bureaucratic encounters and more negative attitudes towards public services in general. We end by reviewing possibilities for avoiding ‘contamination’ of perceptions of corruption by general attitudes towards government, and for developing indicators that better measure actual corruption.
Perceived corruption in Belgium
By means of an introduction, we briefly present some of the available survey data on citizens’ perception of corruption in Belgium. The 1995 ISPO General Election Study (Beerten, Billiet, Carton, & Swyngedouw, 1997) revealed that 29 percent of Belgians thought politicians to be more corrupt than other individuals, while 65.5 percent did not see a difference. This study also revealed that citizens have more problems with politicians who demand bribes or payments for granting government contracts than with politicians who accept money for a contract. A politician using bribes for funding his or her personal election campaign is considered more reprehensible than is a politician who transfers the money to his or her political party, although 73.9 percent of respondents overall viewed accepting bribes as unacceptable 1 . The best-known source for corruption indicators is the Transparency International (TI) Corruption Perceptions Index (CPI). This index ranks countries
1
‘Hardly acceptable’ and ‘never acceptable’. Of the remaining respondents, 17.8
per cent stated this is ‘sometimes acceptable’, and 5.4 per cent stated that accepting money and giving it to one’s party is ‘completely acceptable’.
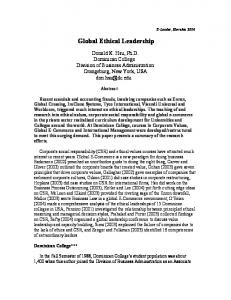
based on perceived corruption among politicians and public officials 2 . Even though the CPI does not lend itself to making time-series comparisons, the trend for Belgium in recent years is quite clear: Since 1999 there has been an unambiguous positive trend (the lower the score, the higher perceived corruption). The score does not return to 1980s level, but this is probably due to changes in the method of measurement and the fact that data for Belgium and Luxembourg have not always been disaggregated. Luxembourg generally ranks higher than Belgium. Figure 1: Belgium in the Corruption Perceptions Index
10 9 8 7 6 5 4 3 2 1 0 80- 88- 95 85 92
96
97
98
99
00
01
02
03
04
05
Source: Transparency International: Corruption Perceptions Index In 2005, Belgium ranked 19th among the least corrupt countries (in a total of 133 countries). This puts the country on a par with Ireland and higher than, for example, Spain and Japan. Still, Belgium performs worse than many other EU15 countries, including its neighboring countries. Compared to 2004, the country declined in the rankings, even though this change is probably not large enough to be significant. Additional information on Belgian citizens’ attitude towards corruption can be 2
www.transparency.org, note that CPI scores cannot just be compared on a year-
to-year basis, as composition has changed a number of times.
found in the 1999-2000 European Values Study. One question was about the perceived occurrence of taking bribes. Table 1 shows the answers in a series of European countries and indicates significant differences between countries. In Belgium, 27.8 percent of the respondents report that almost all or many of their compatriots accept bribes. This percentage is comparable to that in Austria, Germany and the UK, yet higher than that found in Finland or Luxemburg. In Italy, however, this percentage peaks at 41.2 per cent. Table 1: According to you, how many of your compatriots do the following? Accepting a bribe in the course of their duties? %
almost all
Many
some
almost none
BE 4.8
23.0
63.5
8.7
AT 2.4
30.4
63.3
3.9
DE 5.1
27.9
61.2
5.8
FI
2.3
20.3
64.5
13.0
IT
7.4
43.8
46.5
2.3
LU 0.9
9.7
38.1
33.0
UK 1.8
29.4
60.0
8.7
Source: European Values Study, only results for EU15 countries (Halman, 2001)
Another question asked to what extent citizens considered it justified for someone to accept a bribe in the course of his or her duties. The percentage of respondents that considered accepting a bribe to never be justified was 77.7 percent in 1981, 78.6 in 1990, and 84.1 percent in 1999. Figure 2 illustrates how the Transparency International and European Values Study findings are related.
Figure 2: Perceptions of corruption (TI) and justifiability of accepting bribes (EVS) in the EU-countries
Source: Transparency International Corruption Perceptions Index 1999, where ‘10’ means that corruption is perceived to be very low; European Values Study (1999-2000 wave). ‘Please tell me for each of the following statements whether you think it can always be justified, never be justified, or something in between. Someone accepting a bribe in the course of their duties.’ Scale 1 (never) to 10 (always), mean score (Halman, 2001) Considering bribes to be unjustified does not lead to perceptions of corruption to be lower in a particular country, though there are exceptions. Perceptions regarding accepting bribes is actually quite similar across most countries, despite differences in CPI scores. In only a few Central-European countries is accepting bribes considered to be somewhat more justified, yet the differences remain small.
What determines perceptions of corruption? An analysis
For this section, we use data from the Werken aan de Overheid survey (WADOWorking on Government), which was administered as part of a research project commissioned by the ministry of the Flemish Community (2000-2004, www.kuleuven.be/trust). The questionnaire dealt with citizens’ attitudes towards the public sector and contained items on socio-demographics, citizens and public services, citizens and politics, and citizens and society. Participants were inhabitants of the Flemish Region (aged 18-85). Three surveys were administered: a face-to-face survey (2002, n=1248, response rate 68.2 percent), an initial mail survey (2002, n=2166, response rate 63.5 percent), and a second mail survey (2003, n=3168, response rate 61.9 percent 3 ). We will only report data from the 2003 survey here (Van de Walle, Kampen, Maddens, & Bouckaert, 2004). Questionnaires were sent with two-week intervals. Fifteen successive waves covered a period of half a year (third and fourth quarters of 2003). In this way the impact of events on citizens’ opinions could be measured and long-term impacts and evolutions analyzed. We do not, however, analyze trends in this chapter. Respondents each received three mailings: an introductory letter, the questionnaire with postage-paid return envelope and a reminder. As an incentive, a limited number of gifts (approx. 0.5 to 1 percent of respondents) was given to respondents by means of a lottery. The survey contained a number of issues related to corruption and favoritism, five of which are analyzed here in greater detail. Three of these articulate corruption-related issues, the other two focus on issues of equal treatment.
3
In the 2003 survey, 25-44 aged are underrepresented, 45-60 aged tended to return
the questionnaire more often, and the +70 category is again underrepresented. Response was higher in rural areas.
Table 2: Perceptions of unethical behavior in the public sector in Flanders %
totally
disagree not agree, not agree
totally
disagree
agree
disagree Civil servants are more 8.4
28.7
38.2
19.0
5.7
18.4
36.2
29.4
13.1
11.3
30.5
40.5
15.7
40.2
26.1
16.7
6.1
35.4
35.5
18.6
2.7
corrupt than other people Politicians are more corrupt 3.0 than other people You need 'connections' to 2.1 get
something
done
by
government or the public administration All users of public services 10.9 are treated equally Users of public services 7.8 always get what they're entitled to Source: Werken aan de Overheid (WADO) 2003, n=3168.
Surprisingly, 56.2 percent of the respondents believe an individual needs connections to get something done from government or public administrators; only 13.3 percent disagree. The results are somewhat more encouraging in response to the question regarding corruption: just under a quarter of respondents believe that civil servants are more corrupt than other people. Politicians, however, are perceived to be more corrupt than other people by 42.4 percent of participants in the survey. Responses to these three questions are strongly correlated.
Table 3: Perceived ethical treatment of citizens, correlations users
users treated equally users get what entitled
get civil
need
politicians
connections
corrupt
what
servants
entitled to
corrupt
0.51**
-0.08**
-0.17**
-0.13**
-0,07**
-0.16**
-0.11**
0.43**
0.40**
to civil servants corrupt need connections
0.36**
**Correlation is significant at the 0.01 level; Kendall's tau_b The correlation table along with a factor analysis confirm that the items are measuring different dimensions of ethical treatment. While opinions on corruption are quite moderate, there is evidently something wrong with equal treatment. Just one out of five respondents agrees that users of public services are treated equally and get what they’re entitled to, while over half of the respondents disagree. In the next step, we attempt to explain these attitudes by socio-demographic characteristics, social attitudes, voting behavior, and media exposure. Sociodemographic variables are gender, level of education (six levels), and age (six categories from 18-24 to 65+). Social attitudes are individualism (based on two items: ‘Humanity, brotherhood and solidarity are all nonsense. Everybody has to take care of themselves first and defend their own interests’ and ‘People should always pursue their personal pleasure, and shouldn’t think too much about others’), and authoritarianism (also based on two items: ‘Obedience and respect for authority are the two most important virtues children have to learn’ and ‘What we need is strong leaders who tell us what to do’). Voting behavior is based on the question ‘Suppose there are national elections next Sunday. Which would be your preferred political party?’ This variable has been recoded into seven dummies, each referring to one of the main parties; AGALEV (greens), CD&V (Christiandemocrats), N-VA (Flemish nationalists), SP-A (social democrats), Spirit (Flemish
nationalist and social democrat), Vlaams Blok (extreme right) and VLD (liberals). The three media variables measure whether an individual reads reputable newspapers, watches the news on public television, and/or watches news on commercial television. The five dependent variables have been recoded into trichotomous variables. Table 4 gives the results of the multivariate ordinal logit regression models.
Table 4: Determinants of perceptions of ethical behavior: ordinal regression models Civil
Politicians
Need
All
Get
servants
corrupt
connectio
treated
what
ns
equally
entitled
corrupt
to SEX
(0=male, 0.185*
0.050
0.21**
-0.024
0.143*
(0.074)
(0.074)
(0.077)
(0.074)
(0.073)
-0.128***
-0.082*
-
-0.020
-0.073*
1=female)
EDUCATION
0.115***
AGE
AUTHORITARIA
(0.033)
(0.032)
(0.033)
(0.032)
(0.032)
0.021
0.012
-0.001
0.007
0.032
(0.027)
(0.027)
(0.028)
(0.027)
(0.027)
0.041**
0.025
0.038**
0.047***
0.050*
NISM
INDIVIDUALIS
** (0.014)
(0.014)
(0.014)
(0.014)
(0.014)
0.159***
0.142***
0.096***
-0.002
0.048*
M
PARTY: agalev
PARTY: cd&v
PARTY: n-va
** (0.014)
(0.014)
(0.015)
(0.014)
(0.014)
0.041
-0.027
-0.514*
0.036
0.266
(0.23)
(0.225)
(0.229)
(0.232)
(0.228)
-0.348**
-0.174
-0.297*
0.193
0.233
(0.132)
(0.132)
(0.139)
(0.133)
(0.131)
-0.103
0.152
0.009
-0.258
-0.080
(0.213)
(0.213)
(0.221)
(0.223)
(0.215)
PARTY: sp-a
-0.172
-0.475***
-0.392**
0.373**
0.343* *
(0.131)
(0.132)
(0.138)
(0.132)
(0.131)
0.356
-0.128
0.174
0.201
0.361
(0.212)
(0.217)
(0.238)
(0.212)
(0.208)
0.617***
0.265
-0.067
-0.241
(0.142)
(0.152)
(0.16)
(0.146)
(0.144)
-0.188
-0.671***
-0.238
0.115
0.167
(0.129)
(0.131)
(0.138)
(0.132)
(0.129)
-0.166
-0.190
-0.240*
0.009
-0.098
(0.108)
(0.105)
(0.107)
(0.107)
(0.106)
0.019
-0.233
0.185
-0.064
(0.138)
(0.145)
(0.135)
(0.133)
0.295*
0.087
0.252
0.043
(0.132)
(0.135)
(0.141)
(0.133)
(0.132)
N
2742
2747
2749
2731
2735
Nagelkerke
0.148
0.143
0.098
0.017
0.040
PARTY: spirit
PARTY:
vlaams 0.393**
blok
PARTY: vld
QUALITY NEWSPAPERS
TV NEWS public -0.137 TV (0.134) TV
NEWS 0.152
commercial TV
pseudo R² Note: standard errors in parenthesis; *p