Evaluating Automatically Generated Timelines from the Web Roberta Catizone, Angelo Dalli and Yorick Wilks University of Sheffield Computer Science Department E-mail:
[email protected],
[email protected],
[email protected]
Abstract As web searches increase, there is a need to represent the search results in the most comprehensible way possible. In particular, we focus on search results from queries about people and places. The standard method for presentation of search results is an ordered list determined by the Web search engine. Although this is satisfactory in some cases, when searching for people and places, presenting the information indexed by time may be more desirable. We are developing a system called Cronopath, which generates a timeline of web search engine results by determining the time frame of each document in the collection and linking elements in the timeline to the relevant articles. In this paper, we propose evaluation guidelines for judging the quality of automatically generated timelines based on a set of common features.
already seen elsewhere in order to find additional new information. Organising the documents in a timeline is a logical way of getting an overview of a large number of search results. If the subparts of the timeline are expandable to a more detailed one, users can home in on the desired detailed information provided by supporting documents. Timelines have traditionally been used to summarise entire periods made up of events and their capacity for allowing users to get a feel for an entire document collection at a glance is a desirable feature in finding relevant information more efficiently.
1. Introduction The Internet provides access to a variety of text documents, such as frequently updated news stories written by professional media authors, in-depth encyclopaedic articles written for traditional sources and organisations like Wikipedia, blogs, forum discussions to general web documents. Although the authority of many web documents is debatable, search engines such as Google have overcome this problem by returning results to the user that are deemed the most popular (what we could call authority by “general consensus”). Popularity is determined by the number of hyperlinks to a web page using algorithms such as PageRank (Page; Brin, 1998) and HITS (Kleinberg, 1999). Assuming that WWW information retrieval techniques yield accurate results, the average user still has a problem trying to assimilate the enormous amount of information returned. The information overload becomes particularly acute when there is a huge number of documents that are all relevant but pertain to different events or aspects related to a particular query topic. This situation is often encountered when performing web searches on People, Places, Organisations (and Events themselves) – usually called Named Entities in the Information Extraction community (Cunningham, 2005). Named entities generally have associated events and other named entities that involved them or somehow interacted with them at particular dates and times (Grishman and Sundheim, 1996). Although today’s search engines do quite a good job of retrieving relevant information, there is no sense of a time frame associated with particular events related to a named entity. Users are simply presented with a popularly ranked list of relevant documents and in most cases must piece together all available information by looking at many documents individually to get a better understanding about the named entity in question. As an example, if we are looking for information about Osama bin Laden on the Web, the search results will contain tens of thousands of documents about related events taking place during the period 1957 to the present. To make matters worse, most of the information is duplicated across documents, making users lose precious time reading and skipping information that they have
2. The Cronopath System We have developed a system for automatically producing a timeline of web search engine results (Dalli, 2004). A few systems that have attempted to generate timelines from unstructured text (Kumar et al., 1998; Swan and Allan, 2000; Allan et al., 2001; Crane et al., 2001; Smith, 2002; Chieu and Lee, 2004), with most of the work created indirectly in submissions for the Topic Detection and Tracking (TDT) programme in the DARPA TIDES evaluation series (Wayne, 2000; NIST, 2004). In this paper, we propose standard guidelines for evaluating the quality of automatically generated timelines that can be used as a baseline measure for evaluating our own system in the future and any other related system that perform automatic timeline generation from a document collection. We have briefly surveyed evaluation methods used in other related fields such as the precision and recall methods in Information Retrieval, the F-measure (Van Rijsbergen, 1979) in Information Extraction, the BLEU evaluation (Papineni et al., 2002) in Machine Translation and the methods used for the DARPA-sponsored MUC, DUC, TDT and TERN evaluations. Although timeline generation (and thus evaluation) has many common aspects shared with multiple document summarisation, (ROGUE, Lin and Hovy, 2003; Lin, 2004 , Lin, 2001), we aim to define a method that does not use such heavy processing.
885
timeline contains accurate text labels for each time line unit and 3) that the timeline includes the most
3. Timeline Features
significant facts in the document collection. Presentation. This issue is important if the results are to displayed in a graphical style (as in the case of Cronopath). When displaying the timeline in graphical form (as opposed to displaying the timeline as an ordered list), where the timeline is composed of a series of time frame elements, one must address the following issues: the number of timeframes to be displayed, and what each time frame or gap associated with each element of the
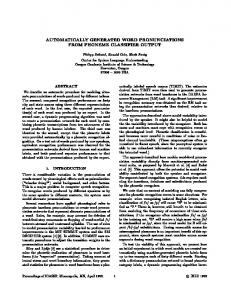
Figure 1
timeline should be.
Are all timelines equally good or is there a preferred style? We started by looking at existing manually created timelines that are normally both accurate and comprehensible. After looking at existing timelines on the Web and those in encyclopaedias, we found that manually created timelines share a set of common features. These common features provide us with a good set of principles for evaluating automatically generated timelines. Additionally our evaluation guidelines were selected in such a way that automated testing could be performed, so as to reduce the bias inherent in human subjective measurements which seems to affect the evaluation results of many summarisation systems (McKeown, 2001). We are assuming that the timeline is generated from a collection of supporting documents, which are first processed to extract named entities together with a series of time stamped facts and relations. Every document can then be processed to identify a range of times that narrow down the possible dates of the document’s creation, using a combination of temporal expression analysis such as the techniques used in TERN/TIMEX (Ferro et al., 2005) and temporal classification of texts (Dalli et al., 2006 forthcoming). A multiple document summarisation technique is also needed to extract (or generate) relevant sentences for use as labels in each timeline unit. Every timeline is also constrained by physical viewing and/or rendering requirements to a particular set of timeline units. The components of a timeline that will be used in future discussion are as follows: Timeline: complete representation including all the subparts. Figure 1 is a timeline. Time Frame: units of the timeline. In Figure 1, 1957-1974, 1975-1979 and 1980-1984 are examples of time frames. Label: text that is associated with each time frame. In Figure 1, an example is ‘Bin Laden marries a Syrian girl who is a relative’. The features that we have identified as important in automatic timeline generation are: Accuracy. The accuracy of a timeline is dependent
4. Evaluation Guidelines 4.1. Accuracy The issues when considering timeline accuracy; 1) Is the timeframe for each timeline document correct? 2) Does the timeline label reflect the document that it represents? We assume that grammatical correctness of labels is handled by the label generation mechanism 3) Does the timeline include the most important events/facts? 4.1.1. Is the timeframe for each timeline document correct? Evaluating this is fairly straightforward; take each document linked to by a label in each of the time frames and verify that the time/date that is listed on the time frame is in the document/s. In the cases where the time referent refers to a time span, it is necessary to search for each time within the defined time span. So if the time span is 1956-1974, searching would be done for years 1956, 1957, 1958…1974. If the time/date does not appear in the document, then there is a problem. If, on the other hand, it appears, along with other dates/time in the same document, we will assume that the label refers to the correct event/fact. 4.1.2. Does the timeline label reflect the document that it represents? As regards issue 2, one trivial way to decide if a label accurately represents a document is to search for the label as a literal in the document/s. Assuming that most labels are abbreviations or summarizations of the document fact/event, this will not usually work. Although recalculating the summary of each document and comparing it to the timeline label is one sure way to go about it, it seems unnecessarily complex. We propose looking for n-grams (Church 2005) taken from the timeline label in the linked document/s. On the theory that most document summaries and hence timeline labels will contain text that overlaps with the text of the original document, this will produce the correct result. N-grams for smaller values of n may produce misleading results, but this can be accounted for by weighting n-grams with higher values of n more heavily Although, determining the exact weighting algorithm can only be
on these features; 1) That each relevant document is included in the appropriate timeframe, 2) that the
886
done by manually examining the results, one could begin by weighting more heavily the n-grams where n is greater than at least half the words in the label. We have noted that differing verb forms can cause a problem, so to improve accuracy, it would be best to include all verb forms when creating the n-grams. This can easily be done using an electronic dictionary resource.
case of a very large timeline, display only a portion of the timeline and use scrolling to navigate to parts that are not initially visible. • Horizontal timelines seem the most popular form for graphical timelines. When the need to expand one of the timeframe units arises, it is frequently done using vertical expansion. Having observed common features for manually created timelines, we now ask whether these guidelines apply to timelines generated from Web documents. As noted previously, most manually created timelines seem to focus on keeping the time frame units the same. With regard to timelines that represent historical facts (the greatest use of timelines we found), this is a traditional style for timelines, but when analyzing timelines created automatically from web documents, it may be more practical to create the timeline so that it has a more even distribution of events/facts across the time frames. This would mean that time frame definition is determined by the number of significant events in a time period over the entire document collection. When processing large-scale collections, this way of balancing a timeline is better suited to the display constraints. This could result in time frames covering different time periods. For example if there are 1000 document facts and the associated years covered are as follows:
4.1.3. Does the timeline include the most important events/facts? This issue is the hardest to tackle and without using an information extraction engine, difficult to assess. One light-touch way of going about this is to use frequency counts on the collection for overlap with the timeline labels (including n-grams for the labels with more weight given to n-grams with higher values of n). Intuitively, one would expect that the labels or subparts of labels in the timeline to have a higher frequency of occurrence than the average event that is not represented at all in the timeline. Unfortunately, finding the event/fact occurrences, which are not represented in the timeline, but have considerable presence in the collection, cannot be found with this approach. This approach only addresses verifying that the documents represented in the timeline are significant. The exact meaning of significant would need to be defined, but will most likely be correlated with the number of documents in the collection. So one would expect that the larger the document collection, the greater the number of occurrences for an event/fact to be significant. Another means for determining the overall global significance of labels/events is to input the label into another search engine such as Google and record the returned number of documents. Results with very few hits in Goggle may be judged to be problematic.
Years covered in facts 1950-1960 1961-1970 1971-1980 1981-1990 1991-2000 2001-2002 2003-2004 2005-2006
Number of facts 50 50 100 200 200 100 100 200
4.2. Presentation Although, graphical presentation issues involve a certain amount of personal taste, there are identifiable features that graphical timelines share that can be used in design and evaluation. The specific timeline issues under consideration are a) how many time frames the timeline should be broken into and b) what the timeframe units should be; should all the timeframe units cover the same period. Taking into consideration theses points, we will use the term balance to describe the process of creating a timeline that displays information in a complete and comprehensible way. An important fact to note is that there is often more than one way to satisfy the requirements for a balanced timeline. In the following example, we propose how it might be done, but realize that there are other, equally satisfying, ways of presenting the data. Some observations to note based on looking at existing timelines. • Try to keep the same number of units per time frame. Multiples of ten seem to be very popular. All the timeframe units represent the same unit of measure (years, decades, centuries). Although this seems to be a general rule, there are situations where all labels refer to a year or years and then one event (so outstanding) is displayed as a particular day. • Keep the font large enough to be readable so in the
With data of this type one reasonable timeline would contain groupings of 200 facts per time frame. Another reasonable timeline would contain groupings of 100 facts per time frame. Either of these groupings appears natural given this set of facts since there are already groupings of those numbers (3 groupings of 200 and 3 groupings of 100). The reasons for choosing one set of timeline groupings over another, depends on the particular graphical display constraints. The following represent the balanced timelines based on the data: 1950-1980 200
1981-1990 200
1991-2000 200
2001-2004 200
2005-2006 200
[Timeline in 2 parts : A and B for display purposes] Part A 1950-1970 100
1971-1980 100
1981-1985 100
1986-1990 100
1991-1995 100
1996-2000
2001-2002
2003-2004
100
100
100
2005 100
2006 100
Part B
887
Ralph Grishman and Beth Sundheim, 1996, Message Understanding Conference - 6: A Brief History. Proc. 16th Int'l Conf. on Computational Linguistics (COLING-96), Copenhagen, August 1996. pp. 466-471.
5. A Web-based Timeline Evaluation Corpus Wilkipedia, a web-based encyclopedia containing about 1 million articles (2006), is a growing and well-regarded resource freely available to the public. Wikipedia has hundreds of timelines which, have the important feature of being linked to encyclopedia articles (http://en.wikipedia.org/wiki/Timelines). We are in the process of collecting the documents associated with each of the Wikipedia timelnes and building a repository of these which could be used as a collection repository for systems that are doing automatic timeline generation from Web collections The timeline results of a system using the Wikipedia Timeline document Collection could be compared to the timelines created by Wikipedia. Although, some may doubt the authority of the Wikipedia timelines, it is hard to dispute the authority by general consensus that underlies the creation and maintenance of each of the timelines (they can be modified at any time) in the spirit of Wikipedia. The great advantage of having the Wikipedia timeline entries linked to Web articles is that it provides a repository for evaluating other timeline generation systems.
Lin, C.W. 2001. SEE: Summary Evaluation Environment. ISI, University of Southern California, California. Lin, C.W. 2004. “ROUGE: a package for Automatic Evaluation of Summaries”, proc. Workshop on Text Summarization Branches Out (WAS 2004), Barcelona, Spain. 25-26 July 2004. McKeown, K. Barzilay, R. Evans, D. Hatzivassiloglou, V. Kan, M. Schiffman, B. Teufel, S. 2001. “Columbia Multi-Document Summarization: Approach and Evaluation”, proc. DUC 2001, SIGIR 2001, New Orleans, Louisiana. NIST. 2004. Topic Detection and http://www.nist.gov/speech/tests/tdt
Tracking.
Over, P. Yen, J. 2004. “Intrinsic Evaluation of Generic News Text Summarization Systems”, DUC Workshop, HLT/NAACL 2004, Boston, Massachusetts.
6. Conclusion In the next phase of Cronopath, we will evaluate our automatically generated timelines, using the guidelines in this paper, and report the results in a future paper. We feel that automatically generated timelines will be a popular way to present and summarise information in the future. The adoption of a standard method for evaluating the quality of the timelines produced is essential to ensure that timelines represent an accurate and comprehensible picture of the document facts, while ensuring a firm basis for scientific comparisons between existing and future systems.
Over, P. Yen, J. 2003. “DUC 2003: Intrinsic Evaluation of Generic News Text Summarization Systems”, HLT 2003, Edmonton, Canada. Over, P. Liggett, W. 2002. “DUC 2002: an Intrinsic Evaluation of Generic News Text Summarization Systems”, proc. Workshop on Text Summarization, ACL 2002, Philadelphia, Pennsylvania. Over, P. 2001. “Introduction to DUC”, NIST, proc. DUC 2001, SIGIR 2001, New Orleans, Louisiana. Wayne, C. 2000. “Multilingual Topic Detection and Tracking: Successful Research Enabled by Corpora and Evaluation”, proc. LREC 2000, Athens.
7. Acknowledgements We acknowledge EPSRC funding of the Cronopath project and the University of Sheffield Computer Science Department for supporting our research.
8. References Kenneth Ward Church. (1995) ``Ngrams.'' On-line Proceedings, 33rd Annual Meeting of the Association for Computational Linguistics Cunningham, H. 2005. “An introduction to Information Extraction”, Encyclopaedia of Language and Linguistics, 2nd Ed., Elsevier, Amsterdam. Dalli, A. 2004. “Timeline Extraction from Hyperlinked Text Corpora”, University of Sheffield, Sheffield. Dalli, A. et al. 2006. “Temporal Classification of Texts”, forthcoming. Ferro, L. Gerber, L. Mani, I. Sundheim, B. Wilson, G. 2005. “TIDES 2005 Standard for the Annotation of Temporal Expressions”, http://timex2.mitre.org
888