International Journal of
Molecular Sciences Article
Evaluating Complex Mixtures in the Zebrafish Embryo by Reconstituting Field Water Samples: A Metal Pollution Case Study Ellen D. G. Michiels 1 , Lucia Vergauwen 1,2 , An Hagenaars 1 , Erik Fransen 3 , Stefan Van Dongen 4 , Steven J. Van Cruchten 5 , Lieven Bervoets 2 and Dries Knapen 1, * 1
2 3 4 5
*
Zebrafishlab, Veterinary Physiology and Biochemistry, Department of Veterinary Sciences, University of Antwerp, Universiteitsplein 1, 2610 Wilrijk, Belgium;
[email protected] (E.D.G.M.);
[email protected] (L.V.);
[email protected] (A.H.) Systemic Physiological and Ecotoxicological Research (SPHERE), Department of Biology, University of Antwerp, Groenenborgerlaan 171, 2020 Antwerp, Belgium;
[email protected] StatUa Center for Statistics, University of Antwerp, 2000 Antwerp, Belgium;
[email protected] Evolutionary Ecology, Department of Biology, University of Antwerp, Universiteitsplein 1, 2610 Wilrijk, Belgium;
[email protected] Applied Veterinary Morphology, Department of Veterinary Sciences, University of Antwerp, Universiteitsplein 1, 2610 Wilrijk, Belgium;
[email protected] Correspondence:
[email protected]; Tel.: +32-3265-2724
Academic Editors: Juliette Legler and Masato Matsuoka Received: 23 December 2016; Accepted: 24 February 2017; Published: 2 March 2017
Abstract: Accurately assessing the toxicity of complex, environmentally relevant mixtures remains an important challenge in ecotoxicology. The goal was to identify biological effects after exposure to environmental water samples and to determine whether the observed effects could be explained by the waterborne metal mixture found in the samples. Zebrafish embryos were exposed to water samples of five different sites originating from two Flemish (Mol and Olen, Belgium) metal contaminated streams: “Scheppelijke Nete” (SN) and “Kneutersloop” (K), and a ditch (D), which is the contamination source of SN. Trace metal concentrations, and Na, K, Mg and Ca concentrations were measured using ICP-MS and were used to reconstitute site-specific water samples. We assessed whether the effects that were observed after exposure to environmental samples could be explained by metal mixture toxicity under standardized laboratory conditions. Exposure to “D” or “reconstituted D” water caused 100% mortality. SN and reconstituted SN water caused similar effects on hatching, swim bladder inflation, growth and swimming activity. A canonical discriminant analysis confirmed a high similarity between both exposure scenarios, indicating that the observed toxicity was indeed primarily caused by metals. The applied workflow could be a valuable approach to evaluate mixture toxicity that limits time and costs while maintaining biological relevance. Keywords: metals; mixture toxicity; aquatic toxicology; zebrafish embryo; field-to-lab testing
1. Introduction In most aquatic ecosystems, organisms are exposed to multiple contaminants of different chemical groups and are therefore continuously exposed to mixtures rather than to single compounds [1]. While environmental monitoring and risk assessment are mainly focused on analysis and effect assessment of single compounds [2], river water and/or sediment can cause toxicity to organisms, even if the individual concentrations of the contaminants are very low (e.g., below the surface water quality standards or below the no observed effect concentrations (NOECs)) [3–5]. On the other hand, Int. J. Mol. Sci. 2017, 18, 539; doi:10.3390/ijms18030539
www.mdpi.com/journal/ijms
Int. J. Mol. Sci. 2017, 18, 539
2 of 16
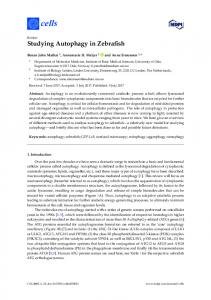
cases have been reported in which the toxicity of a complex mixture was lower than that predicted based on single compound toxicity [6,7]. Because of the complexity and uncertainties related to mixture toxicity, it is difficult to develop mitigation programs and to improve the quality of rivers, or aquatic ecosystems in general. Instead of aiming to decrease the concentrations of all detected compounds in a contaminated stream, it may be more feasible and cost-efficient to identify the toxicants in the mixture that are predominantly responsible for the observed toxic effects, allowing measures to be taken that specifically address those contaminants [8]. The measurement of selected compounds and evaluation of mixture effects is an approach that is used often. For example, Whitehead et al. [9] used a combination of field-caged experiments and laboratory exposures to field water while Johnson et al. [10] exposed fish in artificial pools up- and downstream of an effluent discharge point. Schoenaers et al. [11] were able to discriminate between different complex field water samples reflecting different types of pollution by using a combination of molecular, biochemical and physiological biomarkers. Several approaches combining bioassays and chemical analyses to identify toxicants of concern have been developed, such as effect-directed analysis (EDA) and Toxicity Identification Evaluation (TIE). Using such approaches, toxicity can then be traced back to single chemicals or to a fraction of the initial mixture [8,12–18]. EDA and TIE have the same goal, i.e., identifying toxicants of concern, but they apply different methodologies to achieve that goal. A TIE starts with a toxicity test of the original sample using whole organisms. After this initial test, a TIE is divided into three phases. Phase 1 consists of the characterization of the type of contaminants causing toxicity, e.g., metals. This is done by comparing the whole organism toxicity of a sample before and after treatment with ethylenediaminetetraacetic acid (EDTA), aeration, pH adjustment, etc. The second phase involves the identification of the specific toxicants using analytical measurements and the third phase confirms the identified toxicants [15–17]. Different techniques can be applied during this third phase (e.g., spiking, deletion, etc.) [17]. An EDA also starts with toxicity tests of the original sample, but these tests are mainly based on in vitro endpoints. Subsequently, sample treatments such as extraction and fractionation are performed, followed by another round of in vitro tests to determine which fraction causes the observed toxicity. These assays are then followed by chemical analyses and finally also by a confirmation step [18]. However, in many cases, knowledge about the presence of specific contaminants is available (e.g., it can be deduced from close-by industrial activities, or derived from documented pollution history) and the role of certain toxicants in a water body can be plausibly expected. In such cases, it may not be necessary to follow the entire workflow of TIE or EDA approaches. We applied a workflow (Figure 1) in which first the toxicity of the complex field sample was determined in vivo (step 1 in Figure 1). Secondly, concentrations of the suspected contaminants were quantitatively measured. Next, the field samples were reconstituted in terms of general physico-chemical properties and by adding the suspected toxicants in the appropriate concentrations. In the fourth step, the toxicity of these reconstituted samples was determined, and, finally, the results were compared to the toxicity of the original complex field sample. The last three steps of our workflow are conceptually analogous to the confirmation phase of a TIE and can possibly be used as an alternative approach. If no historical data are available, phases 1 and 2 of a TIE or a similar approach should be used as a guidance to select candidate toxicants [15,16]. Because these reconstituted samples may more closely resemble the original field samples when compared to samples obtained after fractionation, this approach may also be used to validate results from effect-directed analysis. Our specific implementation of the overall approach outlined above considered whether morphological and physiological effects in zebrafish embryos, caused by exposure to contaminated environmental water samples, were mainly due to the known predominant contaminants (metals) in selected rivers. For this case study, we selected two Flemish rivers (Scheppelijke Nete, abbreviated as SN, and Kneutersloop, abbreviated as K), and a ditch which flows into SN with a well-known history of metal contamination. Since the toxicity of complex aquatic mixtures to organisms depends on the interaction between chemicals and physicochemical properties of the water (e.g., pH), the test organism
Int. J. Mol. Sci. 2017, 18, 539
3 of 16
used for evaluating toxicity should preferentially be tolerant to a wide range of physicochemical Int. J. Mol.The Sci. 2017, 18, 539 3 of 16 in a properties. homeostatic salinity range of zebrafish embryos was therefore established preliminary experiment. Zebrafish embryos were then exposed in the lab to water samples taken in established in a preliminary experiment. Zebrafish embryos were then exposed in the lab to water the field. Metal concentrations were measured in these samples to identify the concentration of four samples taken in the field. Metal concentrations were measured in these samples to identify the major cations (Na, Ca, Mg and K) and predominant trace metals. Eight trace metals were identified concentration of four major cations (Na, Ca, Mg and K) and predominant trace metals. Eight trace that exceeded their respective water standard at least onestandard of the sample sites metals were identified thatsurface exceeded their quality respective surface in water quality in at least one(Al, of Mn, Fe, Ni, Cu, Zn, As, Cd; see Table 1). Field samples were then reconstituted using the site-specific the sample sites (Al, Mn, Fe, Ni, Cu, Zn, As, Cd; see Table 1). Field samples were then reconstituted measured of the four major cations tofour reflect thecations baseline ionicthe composition of the using concentrations the site-specific measured concentrations of the major to reflect baseline ionic field samples, andofusing thesamples, site-specific measured concentrations of the eight selected trace metals. composition the field and using the site-specific measured concentrations of the eight selected trace metals. Zebrafish embryos then exposed to theBy reconstituted By Zebrafish embryos were then exposed to thewere reconstituted mixtures. comparingmixtures. effects between comparing effects between exposure to reconstituted and field water samples, we investigated exposure to reconstituted and field water samples, we investigated whether the observed toxicity was whether was mainly caused by the metal mixtures rather (e.g., than by other, or mainly causedthe by observed the metaltoxicity mixtures rather than by other, unknown, contaminants pesticides) unknown, contaminants (e.g., pesticides) or environmental factors. environmental factors.
Figure 1. Schematic overview of of the workflow studyanalogous analogous concepts a Toxicity Figure 1. Schematic overview the workflow of of this this study to to thethe concepts of a of Toxicity Identification Evaluation (TIE). The numbered thesteps steps that were conducted in this Identification Evaluation (TIE). The numberedboxes boxes represent represent the that were conducted in this study. Identification of predominant pollutant class(es) corresponds to phase 1 of a TIE and is study. Identification of predominant pollutant class(es) corresponds to phase 1 of a TIE and is necessary necessary in cases where no background data are available (e.g., as illustrated by Burgess et al. [18]). in cases where no background data are available (e.g., as illustrated by Burgess et al. [18]). The dashed dashed arrow step 6 of the i.e.,the comparing the effects between field and arrowThe represents step 6represents of the workflow, i.e.,workflow, comparing effects between field and reconstituted reconstituted exposure scenarios. exposure scenarios. Table 1. Dissolved trace metal(loid) concentrations at the different sites. The underlined metal concentrations exceeded the surface water quality standards. Elements shaded in grey were used to Tablereconstitute 1. Dissolved tracemixtures. metal(loid) concentrations the metal All values are in µg/L.at the different sites. The underlined metal
concentrations exceeded the surface water quality standards. Elements shaded in grey were used to (µg/L) Al Cr Mn Fe Ni Cu Zn As Cd Pb reconstitute the metal mixtures. All values are in µg/L. (µg/L)
SN1 D Al SN2 53.0 K1 904 K2 84.3 Norm 12.6
53.0 904 Cr 84.3 0.4 12.6 0.3 10.4 0.3 87 0.3a
0.4 31.1 267 2.4 0.3 5298 10440 67.2 Mn Fe Ni 0.3 264 709 5.0 31.1 267 2.4 0.3 26.1 847 34.9 5298 10440 67.2 0.4264 17.7 709847 35.4 5.0 5 b26.1 / c 847/ c 20 b 34.9
12.5 65.8 2.5 3.0 98621 131 Cu Zn 4.3 3447 2.9 12.5 65.8 60.4 46.2 7.8 3.0 98621 56.4 4.3 27.4 3447 6.3 b 760.4 20 b46.2 3 b
0.5 3383 As Cd 6.7 2.5 0.5 1.4 131 3383 0.9 2.9 6.7 0.08–0.25 b (*) 7.8 1.4
2.9 2.2 2.1 3.3 2.9 7.2 b
Pb
SN1 2.9 D 2.2 SN2 2.1 K1 3.3 K2 0.4 17.7 847Cd is 35.4 56.4on hardness 27.4 6.3 < 40 mg CaCO 0.9 2.9 * Surface10.4 water quality standard for dependent (0.08 3/L; 0.25 ≥ a c c b b b b b b Norm 87 / / 5a 20 7 20 3 0.08–0.25 (*) 7.2 b
200 mg CaCO3/L). The surface water quality standard for Al was obtained from US Environmental * Surface water quality standard for Cd is dependent on hardness (0.08 < 40 mg CaCO3 /L; 0.25 ≥ 200 mg CaCO3 /L). Protection Agency (EPA) standards because there is no Belgian or European surface water quality a The surface water quality standard for Al was obtained from US Environmental Protection Agency (EPA) standards b The surface water quality standards were obtained from the Flemish standard forBelgian this element; because there is no or European surface water quality standard for this element; b The surface water quality environmental legislation (VLAREM), which is based on the European legislation 2008/105/EG); standards were obtained from the Flemish environmental legislation (VLAREM), which is(EU based on the European c Currently (2016), no surface water quality standards for Mn and Fe exist in the EU c Currently legislation (EU 2008/105/EG); (2016), no surface water quality standards for Mn and Fe exist in the EU or the US. or the US.
Int. J. Mol. Sci. 2017, 18, 539
4 of 16
2. Results 2.1. Physicochemical Properties of the Scheppelijke Nete (SN), Ditch (D) and Kneutersloop (K) Concentrations of Al, Ni, Cu, Zn, As and Cd were higher than the water quality standards for at least one sampling point (underlined in Table 1). Currently, there are no surface water quality standards available for Mn and Fe, but their concentrations were also high in some of the sampling points compared to other rivers and were therefore also included for the reconstitution of the samples [19–21]. Apart from Cr and Pb, which were not included in the reconstituted samples and will not be further discussed, the highest metal (loid) concentrations were found in the water of D, and the values were, except for Cu, always higher at the SN2 sampling point than at SN1. Nickel and Cu were the only two elements that were substantially higher in K than in SN. Chromium and Pb never exceeded their surface water quality standards. The results of the pH, conductivity and measurements of four major cations are listed in Table 2. The pH-values of all sampling points except D were similar to standard embryo medium (pH 7.5). The conductivity in SN was similar to the conductivity of standard embryo medium (500 µS/cm). The conductivities of D and K were higher (931 µS/cm and 1343 µS/cm, respectively) than standard embryo medium (Table 2). Table 2. Measurements of pH, conductivity and the concentration of four major cations in the field water samples and standard embryo medium. Sample
Ca (mg/L)
Mg (mg/L)
K (mg/L)
Na (mg/L)
pH
Conductivity (µS/cm)
SN1 D SN2 K1 K2 Standard embryo medium
54.05 51.16 54.31 38.16 37.61 2.86
6.50 13.60 6.82 8.36 8.26 8.56
9.01 12.92 8.46 8.78 8.50 5.08
28.89 39.22 28.57 208.24 201.74 68.94
7.47 6.14 7.39 7.33 7.42 7.50
476 931 509 1343 1322 500
2.2. Exposure to Field Water Samples and Reconstituted Water Samples 2.2.1. Survival All embryos exposed to water collected at D or exposed to reconstituted D died within four days (Figure 2A,B). The diluted D mixtures showed no significant mortality compared to reconstituted control D. A significant number of embryos that were exposed to reconstituted control medium of SN2 (i.e., without the presence of trace metals) died in the first 24 h, but when the same medium was used to produce the metal mixture of SN2, no significant mortality was observed. The exposure of embryos to reconstituted control medium of SN2 was repeated six times and resulted in a high mortality rate in the majority of the experiments (at least 23% mortality in four out of six experiments). Based on our current data, we cannot explain this observation. The positive control of 4 mg/L 3,4 dichloroaniline (DCA) always resulted in an expected mortality of approximately 100% at the highest concentration, which is in compliance with the criteria of Organisation for Economic Co-operation and Development Test Guideline (OECD TG) 236 [22]. The other DCA concentrations (0.5; 1 and 2 mg/L) resulted in 0%, 6% and 17% mortality, respectively. The internal negative controls showed no mortality.
Int. J. Mol. Sci. 2017, 18, 539
Int. J. Mol. Sci. 2017, 18, 539
5 of 16
5 of 16
Figure 2. Survival curves after exposure watersamples, samples, reconstituted metal mixtures. Figure 2. Survival curves after exposuretoto(A) (A) field field water (B)(B) reconstituted metal mixtures. Hatching curves after exposure samplesand and(D) (D)reconstituted reconstituted metal mixtures. Hatching curves after exposuretoto(C) (C)field field water water samples metal mixtures. Different letters in the legendindicate indicatesignificant significant differences each graph. “Control” Different smallsmall letters in the legend differenceswithin within each graph. “Control” indicates rearing in standard embryo medium. In (A,C) separate controls (“control D” and “control indicates rearing in standard embryo medium. In (A,C) separate controls (“control D” and “control K”), pH withand pH conductivity and conductivity adjusted to those of the field water samples,were wereincluded. included. The The pH K”), with adjusted to those of the field water samples, pH and and conductivity of the Scheppelijke Nete (SN) resembled standard embryo medium; therefore, a conductivity of the Scheppelijke Nete (SN) resembled standard embryo medium; therefore, a separate separate control was not needed in this case. In (B,D), “control D”, “control SN1” and “control SN2” control was not needed in this case. In (B,D), “control D”, “control SN1” and “control SN2” media media were reconstituted based on the actual baseline ionic composition (Na, K, Ca and Mg) were reconstituted based on the actual baseline ionic composition (Na, K, Ca and Mg) measured in the measured in the field water samples. field water samples.
2.2.2. Hatching
2.2.2. Hatching
Embryos that were exposed to the environmental SN2 water sample (Figure 2C) or to the
reconstituted of SN2 (Figure showed a significant (p < sample 0.001) decrease hatching Embryos thatmixture were exposed to the2D) environmental SN2 water (Figurein2C) or to the success atmixture 120 h post fertilization compareda to the controls anddecrease 61% of the embryos did reconstituted of SN2 (Figure(hpf) 2D) showed significant (p