PNNL-15102
Evaluating Cumulative Ecosystem Response to Restoration Projects in the Columbia River Estuary, Annual Report 2004
FINAL REPORT December 16, 2005
Prepared for: U.S. Army Corps of Engineers, Portland District Under a Related Services Agreement with The U.S. Department of Energy Contract DE-AC05-76RLO 1830 Prepared by: Pacific Northwest National Laboratory, Marine Sciences Laboratory NOAA Fisheries, Pt. Adams Biological Field Station Columbia River Estuary Study Taskforce
DISCLAIMER
This report was prepared as an account of work sponsored by an agency of the United States Government. Neither the United States Government nor any agency thereof, nor Battelle Memorial Institute, nor any of their employees, makes any warranty, express or implied, or assumes any legal liability or responsibility for the accuracy, completeness, or usefulness of any information, apparatus, product, or process disclosed, or represents that its use would not infringe privately owned rights. Reference herein to any specific commercial product, process, or service by trade name, trademark, manufacturer, or otherwise does not necessarily constitute or imply its endorsement, recommendation, or favoring by the United States Government or any agency thereof, or Battelle Memorial Institute. The views and opinions of authors expressed herein do not necessarily state or reflect those of the United States Government or any agency thereof.
PACIFIC NORTHWEST NATIONAL LABORATORY operated by BATTELLE for the UNITED STATES DEPARTMENT OF ENERGY under Contract DE-AC05-76RL01830
Printed in the United States of America Available to DOE and DOE contractors from the Office of Scientific and Technical Information, P.O. Box 62, Oak Ridge, TN 37831-0062; ph: (865) 576-8401 fax: (865) 576-5728 email:
[email protected] Available to the public from the National Technical Information Service, U.S. Department of Commerce, 5285 Port Royal Rd., Springfield, VA 22161 ph: (800) 553-6847 fax: (703) 605-6900 email:
[email protected] online ordering: http://www.ntis.gov/ordering.htm
Cover Photo: View of the Columbia River estuary looking north with Trestle Bay in the foreground.
PNNL-15102
Evaluating Cumulative Ecosystem Response to Restoration Projects in the Columbia River Estuary, Annual Report 2004 Heida L. Diefenderfera G. Curtis Roegnerb Ronald M. Thoma Earl M. Dawleyc Allan H. Whitingd Gary E. Johnsona Kathryn L. Sobocinskia Michael G. Andersone Blaine D. Ebbertsf
FINAL REPORT December 16, 2005
Prepared for the U.S. Army Corps of Engineers, Portland District Under a Related Services Agreement with The U.S. Department of Energy Contract DE-AC05-76RLO 1830
Prepared by: Pacific Northwest National Laboratory, Marine Sciences Laboratory NOAA Fisheries, Pt. Adams Biological Field Station Columbia River Estuary Study Taskforce a
b c d e f
Pacific Northwest National Laboratory, Richland, Washington NOAA Fisheries, Hammond, Oregon NOAA Fisheries (retired) Columbia River Estuary Study Taskforce, Astoria, Oregon Oregon State University, Corvallis, Oregon U.S. Army Corps of Engineers, Portland District, Portland, Oregon
Evaluating Cumulative Ecosystem Response to Restoration Projects in the Columbia River Estuary, 2004
Abstract The restoration of wetland salmon habitat in the 235-km tidal portion of the Columbia River is accelerating and is anticipated to improve habitat quality through hydrological reconnection of existing and restored habitats. Currently, multiple groups are implementing a variety of restoration strategies. However, the region lacks a standardized means of evaluating the effectiveness of individual projects and methods for assessing estuary-wide cumulative effects. This project is establishing a framework for such evaluations. A priority has been to develop a protocol manual for minimum monitoring of physical and biological metrics, intended to standardize data collection critical for analyzing changes following restoration actions. The draft manual included with this report is a practical technical guide for the design and implementation of restoration monitoring from Bonneville Dam to the river mouth. Additionally, the project’s literature review and synthesis identified ways that effects can accumulate (e.g., cross-boundary effects, compounding effects) as well as analytical tools (e.g., models, matrices) for assessing them. Restoration project managers on the estuary began using the draft manual in 2005, and their feedback will be incorporated as the manual is finalized for wider distribution. Field studies are being implemented to test the protocols and to evaluate additional potential indicators for detecting a signal in the estuarine system (e.g., organic matter production, sedimentation, food webs, biodiversity, salmon habitat usage, and allometry.) Baseline data were collected in 2005 on two restoration sites and two associated reference sites. The sites represent two habitat types of the estuary – brackish marsh and freshwater swamp – that have sustained substantial losses in area and that may play important roles for salmonids. Baseline data collected included vegetation and elevation surveys, above- and below-ground biomass, water depth and temperature, nutrient flux, fish species composition, and channel geometry. This data will be reported and evaluated in the 2005 Annual Report, which will include a new version of the protocol manual revised based on 2005 field work.
iii
Evaluating Cumulative Ecosystem Response to Restoration Projects in the Columbia River Estuary, 2004
iv
Evaluating Cumulative Ecosystem Response to Restoration Projects in the Columbia River Estuary, 2004
Preface This report is a deliverable for the 2004 study. As such, it includes all of our work products for the 2004 study year. Future annual reports will be prepared for the remaining study years 2005 through 2009. In this report we introduce the research problem (Chapter 1), review the literature (Chapter 2), summarize CRE habitat use by juvenile salmon (Chapter 3), describe a conceptual model for the CRE ecosystem (Chapter 4), develop standard monitoring protocols for CRE restoration projects (Chapter 5), and provide recommendations and discuss management implications (Chapter 6). The report provides a foundation for subsequent research on the cumulative effects of habitat restoration in the CRE. We organized the report in compendium style because we wanted each chapter to be able to stand alone. Our intent is eventually to publish Chapter 2 (cumulative effects literature review) as a journal article and Chapter 5 (standard monitoring protocols) as a manual.
Recommended citation: Diefenderfer, HL, GC Roegner, RM Thom, EM Dawley, AH Whiting, GE Johnson, KL Sobocinski, MG Anderson, and BD Ebberts. 2005. Evaluating Cumulative Ecosystem Response to Restoration Projects in the Columbia River Estuary, Annual Report 2004. PNNL-15102. Report to the US Army Corps of Engineers, Portland District, by Pacific Northwest National Laboratory, Richland, Washington.
v
Evaluating Cumulative Ecosystem Response to Restoration Projects in the Columbia River Estuary, 2004
vi
Evaluating Cumulative Ecosystem Response to Restoration Projects in the Columbia River Estuary, 2004
Executive Summary The purpose of this study is to develop methods to measure and evaluate the cumulative effects of habitat restoration actions in the Columbia River estuary (CRE, river kilometers 0-235). By “cumulative effects” we mean the collective effects of numerous and varied estuarine habitat restoration projects aimed at improving the population viability of Columbia Basin salmon under the Endangered Species Act. Results from this study will ensure comparable monitoring data sets across multiple years and across multiple restoration projects estuary-wide. The management implications of this research are two-fold in that it will enable resource managers and decision-makers to 1) evaluate the ecological performance of the collective habitat restoration effort in the CRE and its effects on listed salmon, and 2) design, implement, and prioritize future habitat restoration projects. In 2004, the first year of this multi-year study, we focused our efforts on three primary objectives: 1. Review available scientific literature on the evaluation of cumulative ecosystem effects as it applies to the CRE. 2. Summarize knowledge on estuary habitat usage by juvenile salmon as it relates to habitat restoration efforts. 3. Draft standard protocols for monitoring the effectiveness of habitat restoration actions.
Findings The review of cumulative effects literature began with the topic matter most specific to the problem – the cumulative effects of multiple estuarine restoration projects. Finding a dearth of such investigations, we proceeded to explore related literature, including approaches to evaluate the cumulative effects of various disturbances on ecosystem degradation, the cumulative effects of ecological restoration projects in other ecosystems, and indicators responsive to the effects of restoration actions in estuarine habitats. We found that measuring changes in estuarine habitat conditions and ways that estuarine habitats support salmon is a science still under development. Accordingly, we conceived a weight of evidence approach as a means of reducing the risk of mistakenly attributing causation in an analysis of cumulative ecosystem effects. The four lines of evidence we propose are 1) statistically based estuary-wide sampling for structural and functional (process) indicators at project and reference sites, 2) spatial data processed in geographical information systems (GIS) including changes in land use and hydrological information, 3) focused research into data gaps to characterize appropriate indicators of fundamental processes in the system, such as organic matter export, and the relationships between elevation and vegetation, and 4) research into fish-habitat relationships using mark/recapture technologies. These lines of evidence to measure cumulative effects are scheduled to be developed in subsequent study years. The summary of knowledge on CRE habitat usage by juvenile salmon covered available literature from the 1920s to the present. Juvenile salmonid use of CRE habitats is related to species, race, stock, distance of migration, and fish size, among other factors. Nearly 200 million fish, hatchery and wild, emigrate from sub-basins in the Columbia River watershed each year and all pass through the estuary. At present, most do so rapidly (within a matter of days). Observations to date, however, vii
Evaluating Cumulative Ecosystem Response to Restoration Projects in the Columbia River Estuary, 2004
indicate that lower river stocks of ocean type subyearling Chinook salmon (Oncorhynchus tshawytscha) in particular exhibit extended (weeks to months) estuarine residence. Lower river chum salmon (O. keta) and coho salmon (O. kisutch) also exhibit estuary-dependent life-history strategies. Some upper river populations also exhibit extended use of tidal freshwater and estuarine habitats. These populations, some of which are naturally spawned and listed as threatened under the Endangered Species Act, can provide the focus for future research and facilitate evaluation of salmon performance in habitat restoration actions. Research and evaluation of CRE habitat restoration projects, however, are complicated by differences in overall abundances and life-history strategies among stocks emigrating from hundreds of locations in the Columbia River, creating an everchanging amalgam of individuals at any site and time. For example, catch at any site does not necessarily indicate fish were utilizing the habitat there for anything more than a migration corridor; measures of duration of residence and growth are needed to quantify use. The identification of sites and conditions in the Columbia River estuary important to enhancing survival and diversity of salmonid stocks depends on a clear understanding of spatial and temporal distribution of juvenile salmonids. Thus, it is imperative that individual fish be identifiable beyond general phenotype. Research endeavors by others utilizing a suite of physical and biochemical methods are underway to further quantify estuarine habitat use. The project team developed, with the help of agencies and restoration project managers, a set of standard monitoring protocols that on-the-ground restoration managers can reasonably conduct at most project sites. Standardization and widespread dissemination of monitoring protocols is of timecritical importance because numerous restoration projects are currently being implemented in the estuary. In addition, since habitat restoration actions are being undertaken by a variety of governmental and nongovernmental entities and funded by multiple sources, a collaborative approach to the implementation of restoration monitoring will be the most effective and most useful to the cumulative effects evaluation. To develop the monitoring protocols, we adapted monitoring methods available in the literature to typical project work in the CRE. We advocated state-of-the-art data collection protocols for future studies in the CRE, including data logging instrumentation and GIS-based analysis. The protocols distinguished between structural and functional features of a given restoration site in order to capture an array of responses to treated sites. Emphasis was placed on Before After Control Impact (BACI) sampling schemes, which integrated both temporal and spatial scales into the effectiveness monitoring experimental design. Monitored parameters would be sampled simultaneously at two (or more) locations (control versus impact) during both pre- and post restoration action (before versus after). We proposed specific monitoring protocols for the following monitored attributes: 1) landscape features, 2) bathymetry and topography, 3) water quality (temperature, salinity, dissolved oxygen), 4) hydrology (water elevation), 5) fish temporal presence, size/age-structure, and species composition, 6) vegetation changes from tidal reconnection, and 7) success rate of vegetation plantings. It may not be necessary to monitor all seven attributes at all restoration project sites. Our intent was to provide a suite of attributes that managers can choose from and apply as appropriate to their particular restoration site and circumstance. We will continue to collaborate with those implementing monitoring on the ground and other scientists to develop a standard manual of monitoring protocols for the CRE. viii
Evaluating Cumulative Ecosystem Response to Restoration Projects in the Columbia River Estuary, 2004
Management Implications Ultimately, this study will serve to consolidate our understanding of the variety of restorative and management actions that could result in benefits to ecosystem processes and to habitat structure in the Columbia River estuary. This is critical since the CRE system is highly important to potentially competing uses such as agriculture, shipping, and recreation. The study will provide a comprehensive guide to actions that effectively mitigate the ecosystem effects of these uses. This project also has direct and indirect management implications for resource management agencies, environmental organizations, and federal Action Agencies in the Columbia Basin. This study will enrich decision-making to implement CRE habitat restoration projects. There is enormous potential to establish effective habitat restoration strategies using a comprehensive dataset developed from a standard set of monitoring protocols. Given the standard protocols, the application of the data in a management scheme with a definitive programmatic infrastructure will be instrumental to 1) coordinate among groups conducting habitat restoration projects; 2) promulgate the protocols; 3) compile and analyze the data; and 4) develop specific management recommendations. Provided mechanisms are in place that are transparent and understood, managers can apply this information as important “lessons learned" for future restoration projects. This will apply directly to the prioritization of environmental restoration and research monies. This study will enable managers to objectively evaluate the success of the CRE habitat restoration effort. Despite the challenges, developing and implementing appropriate indicators and methods is the best way to enable estuary managers to track the effectiveness of their large investments in estuary habitat restoration projects and to improve conservation and restoration measures over time. The study is directed at showing whether projects have a “signal” in the ecosystem. This will allow managers the capability to measure and assess the effects of the CRE habitat restoration effort on a collective basis. The field sampling protocols (see Chapter 5) will allow sampling methods and database development to be standardized, in turn permitting data to be analyzed estuary-wide. This study will be especially pertinent to habitat restoration in the CRE under the Water Resources Development Act. Other authorities under which the Corps can develop restoration projects are Section 1135 of the Water Resources Development Act (WRDA) of 1986, Project Modification for Improvement of the Environment; Section 206 of WRDA 1996, Aquatic Ecosystem Restoration; Section 536 of WRDA 2000, Lower Columbia River Ecosystem Restoration; and Section 306 of WRDA 1990, General Investigation Studies for Environmental Restoration. Although the emphasis of the cumulative ecosystem response analysis was originally the lower Columbia River and estuary, with an emphasis on ESA-listed salmonids, it is apparent the outcome will have much farther reaching effects. This study builds on earlier ecological understanding and existing planning tools to create an approach that supports several key planning processes associated with ecosystem restoration projects in the estuary, including those without fisheries-related goals. These processes include project prioritization, project effectiveness evaluation, and adaptive management. Restoration projects developed under any of the four Corps authorities can apply the results of this analysis. Additionally, other Corps and national ecosystem restoration programs will likely benefit from this work. ix
Evaluating Cumulative Ecosystem Response to Restoration Projects in the Columbia River Estuary, 2004
This study will help fill the existing data gap on the effects of CRE habitat restoration on listed salmonids. Subyearling fall Chinook salmon (Oncorhynchus tshawytscha) from endangered stocks in the Snake River migrate downstream through the lower Columbia River and estuary in summer and fall. Overall, however, little is known about the habits of juvenile salmonids in shallow water habitats in the tidal freshwater reach of the lower river. Furthermore, fish sampling as part of status and trends monitoring in the tidal freshwater reach is sparse, as opposed to the relatively intensive sampling for juvenile salmon in the estuary proper (R Km 0-74). Thus, there is a need for CRE research to address the gap for tidal freshwater fish sampling, especially for subyearling Chinook salmon, and to link this research with that elsewhere in the lower Columbia River and estuary. The cumulative effects assessment methods will include protocols to sample listed subyearling fish and, therefore, will be useful to managers working to protect this depleted population. This study is germane to cumulative effects assessment basin-wide in the Columbia Basin. The Northwest Power and Conservation Council’s Fish and Wildlife Program involves the implementation of over $100M annually on projects for on-the-ground habitat restoration, monitoring, and research in the Columbia Basin. In any given subbasin, multiple habitat restoration projects are conducted, many of which are impractical to individually monitor because of small scale, limited funds, and for other reasons. This necessitates monitoring action effectiveness in the form of cumulative effects at the subbasin scale. Accordingly, analysis methods for cumulative effects are currently being developed for the Council’s Fish and Wildlife Program. The objectives of these efforts are analogous to those of the cumulative effects study in the estuary in that both intend to establish the effects of habitat restoration actions on salmon. Managers will be able to use the combined data to track basin-wide effects of actions undertaken from the headwaters to the estuary. This study will provide information for collaborative planning for large-scale river ecosystems restoration. A recent analysis by the National Research Council, clarifying the Corps’ ecosystem restoration mission, demonstrates the complexity of factors that need to be considered in order to restore the hydrologic and geomorphic processes of large river and coastal systems. The National Research Council recommended the Corps adopt strategies including the following: integrated large-scale systems planning, adaptive management methods, expanded post-project evaluations, and a collaborative approach. Multi-jurisdictional environments complicate large-scale river basin and coastal systems planning (e.g., multiple states and tribes in the Columbia Basin), necessitating a collaborative approach. The NRC’s recommendations are guiding the effort to assess the cumulative effects of restoration in the Columbia River estuary. With this study, the Portland District is demonstrating the implementation of national level guidelines – large-scale systems planning, adaptive management, post-project evaluation, and a collaborative approach – in the Pacific Northwest region on the estuary of one of the largest rivers in the nation.
Recommendations We recommend research in 2005 to: •
Finalize the standard monitoring protocols in a user manual using results from focused field evaluations of particular protocols. x
Evaluating Cumulative Ecosystem Response to Restoration Projects in the Columbia River Estuary, 2004
•
Continue to develop techniques to assess cumulative effects and field test critical elements of these techniques.
•
Design, coordinate, and communicate to interested parties a pilot monitoring program to assess cumulative effects.
•
Initiate development of an adaptive management system for COE habitat restoration monitoring that will identify the most important monitoring activities and establish guidelines for data management and dissemination.
•
Further develop the conceptual model and begin to apply it to planning restoration projects and identifying research needs.
Summary With substantial work already underway to restore aquatic habitats in the CRE to help recover salmon populations, detecting the cumulative effects of multiple restoration projects on the CRE ecosystem is a challenging yet critical problem. Restoration projects are typically expensive, and the return on investment in terms of benefits to the ecosystem often is not well documented or understood. In systems where restoration is conducted at a variety of sites, however, these projects may add up to produce a system-wide benefit. Assessing cumulative effects is critical to understanding whether there has been a net improvement in the ecosystem from restoration actions or whether actions are only effective in a site-specific manner. The problem lies primarily in how to document this effect, especially in large and complex ecosystems like the CRE. This study is an attempt at a systematic approach to developing a cumulative effects assessment of multiple restoration projects in the Columbia River estuary. There are several management implications from this study, but the most important will be the capability for managers and decision-makers to assess whether CRE habitat restoration is having a measurable, cumulative effect on the CRE ecosystem and, ultimately, contributing to the recovery of listed salmonids in the Columbia Basin.
xi
Evaluating Cumulative Ecosystem Response to Restoration Projects in the Columbia River Estuary, 2004
xii
Evaluating Cumulative Ecosystem Response to Restoration Projects in the Columbia River Estuary, 2004
Acknowledgments This research was conducted under the auspices of the U.S. Army Corps of Engineers, Pacific Northwest Division’s Anadromous Fish Evaluation Program (study code EST-02-P-04). It is related to and complements other estuary research (study codes EST-02-P-01 and EST-02-P-02). This study was funded by the Portland District, U.S. Army Corps of Engineers (Ref. No. AGRW66QKZ40228248) under an agreement with the U.S. Department of Energy, and was conducted by Pacific Northwest National Laboratory (PNNL), operated by Battelle. Subcontractors to PNNL included the Columbia River Estuary Study Taskforce (No. 3594) and Mr. Earl Dawley (No. 11324). We particularly wish to thank the following individuals for providing review comments on a draft version of this report: •
Craig Cornu, South Slough Estuarine Research Reserve
•
Cliff Pereira, Oregon State University
•
John Skalski, University of Washington
•
Kristiina Vogt, University of Washington.
We also gratefully acknowledge contributions to this study by: •
The staff of the Lower Columbia River Estuary Partnership, particularly Scott McEwen and Jason Karnezis
•
The estuary restoration project managers and monitoring specialists who participated in a June 2004 meeting to identify minimum monitoring indicators and develop protocols representing the following organizations: Ash Creek Forest Management, Columbia Land Trust, Columbia River Estuary Study Taskforce, Oregon Parks and Recreation Department, Pacific States Marine Fisheries Commission, Scappoose Bay Watershed Council, Sea Resources, and US Geological Survey.
•
Greg Williams and Dick Ecker, for peer review
•
Taunja Berquam, U.S. Army Corps of Engineers
•
The Estuary and Ocean Subgroup for Research, Monitoring, and Evaluation.
We would like to acknowledge the authors of the Columbia River Estuary Conceptual Model presented in Chapter 4. The conceptual model alone may be cited as follows: Thom, R.M., A.B. Borde, N.R. Evans, C.W. May, G.E. Johnson, and J.A. Ward. 2004. A Conceptual Model for the Lower Columbia River Estuary. PNNL-SA-43444. Report to the US Army Corps of Engineers, Portland District, by Pacific Northwest National Laboratory, Richland Washington. Available URL: www.nwp.usace.army.mil/pm/lcr/science.asp
xiii
Evaluating Cumulative Ecosystem Response to Restoration Projects in the Columbia River Estuary, 2004
The principle authors of the individual chapters of this report are as follows: Overview
-
Gary Johnson
Chapter 1
-
Heida Diefenderfer
Chapter 2
-
Heida Diefenderfer
Chapter 3
-
Earl Dawley
Chapter 4
-
Ron Thom
Chapter 5
-
Curtis Roegner
Chapter 6
-
Gary Johnson
Appendix A
-
Mike Anderson
xiv
Evaluating Cumulative Ecosystem Response to Restoration Projects in the Columbia River Estuary, 2004
Abbreviations and Acronyms AFEP – Anadromous Fish Evaluation Program
NAPP – net aerial primary productivity
BACI – Before After Control Impact
NEPA – National Environmental Policy Act
BPA – Bonneville Power Administration
NMFS – National Marine Fisheries Service (now called NOAA Fisheries)
CEQ – Council on Environmental Quality
NOAA – National Oceanic and Atmospheric Administration
COE – U.S. Army Corps of Engineers CPUE – catch per unit effort
NPCC – Northwest Power and Conservation Council (formerly Northwest Power Planning Council)
CRE – Columbia River Estuary (rkm 0-235) CRE&P – Columbia River from Bonneville Dam into the plume
NRC – National Research Council
CREDDP – Columbia River Estuary Data Development Program
OWEB – Oregon Watershed Enhancement Board PNNL – Pacific Northwest National Laboratory
CREST – Columbia River Estuary Study Taskforce
rkm – River kilometer
CTD – conductivity-temperature-depth
RPA – reasonable and prudent alternative
DEM – Digital Elevation Model
SARE – Salmon at River’s End
DNA – deoxyribonucleic acid
SET – sediment-elevation table or sedimenterosion table
DOQ – Digital Orthophoto Quadrangle
SRFB – Washington Salmon Recovery Funding Board
EMAP – EPA Environmental Monitoring and Assessment Program
SWG –Science Work Group of the Estuary Partnership
EPA – U.S. Environmental Protection Agency ESA – Endangered Species Act
USDA – U.S. Department of Agriculture
ESU – evolutionarily significant unit
USDI – U.S. Department of the Interior
FCRPS – Federal Columbia River Power System
USFWS – U.S. Fish and Wildlife Service
GCP – ground control point
WDFW – Washington State Department of Fish and Wildlife
GI – General Investigation GIS – geographic information system GPS – global positioning system HEP – habitat evaluation procedure HGM – hydrogeomorphic approach HSI – Habitat Suitability Index IBI – indexes of biotic integrity LCREP – Lower Columbia River Estuary Partnership LIDAR – Light Detection and Ranging MBL-GEM – Marine Biological Laboratory General Ecosystem Model MPA – Marine Protected Area xv
Evaluating Cumulative Ecosystem Response to Restoration Projects in the Columbia River Estuary, 2004
xvi
Evaluating Cumulative Ecosystem Response to Restoration Projects in the Columbia River Estuary, 2004
Glossary Adaptive management – A structured learning process for testing hypotheses through management experiments in ecosystems, collecting and interpreting new information, and making changes based on monitoring information to improve the management of ecosystems; i.e., “learning by doing.” Adaptive management framework – A set of processes developed and formalized specifically for use in the long-term management of a specific natural system, which constitute a structured learning process. Allometry – Ecological scaling such as relationships between measurable physical and biological features or the relative growth of a part in relation to the entire organism. Attribute – Frequently called “metric” or “parameter,” this is the specific variable that is measured to assess the response of the system, e.g. “percent cover.” Benthic – Refers to the bottom sediments and biota in aquatic ecosystems. Biome – A regional ecosystem with distinctive climate, soil conditions and biota representing one of the world’s major communities. Columbia River Estuary (CRE) – The tidally influenced portion of the Columbia River from the mouth (rkm 0) to Bonneville Dam (rkm 235). The study area does not include the plume. Conceptual model – A graphical representation or a simple set of diagrams that illustrate a set of relationships among factors important to the function of an ecosystem or its subsystems. Connectivity – see “Habitat Connectivity.” Conservation – Maintenance of biodiversity (Meffe et al. 1994). Controlling factors – Physical and chemical processes that produce habitat structure and function. A component of a conceptual model. Creation – Bringing into being a new ecosystem that previously did not exist on the site (NRC 1992). Cumulative effects – the impact on the environment which results from the incremental impact of the action when added to other past, present, and reasonably foreseeable future actions regardless of what agency (Federal or non-Federal) or person undertakes such other actions (40 CFR § 1508.7). In the Columbia River estuary, the collective effects of multiple habitat restoration projects on ecological structures, functions, and processes and salmon population viability. Disturbance – Any relatively discrete event in time that disrupts or alters some portion or portions of an ecosystem. Ecosystem – A community of organisms in a given area together with their physical environment and its characteristic climate. Ecosystem function – Ecosystem function is defined as the role each plant or animal species plays in the ecosystem. It includes primary production, prey production, refuge, water storage, nutrient cycling, etc. Ecosystem process – Ecosystem processes are any interactions among physicochemical and biological elements of an ecosystem that involve changes in character or state.
xvii
Evaluating Cumulative Ecosystem Response to Restoration Projects in the Columbia River Estuary, 2004
Ecosystem structure – Ecosystem structure is defined as the types, distribution, abundances, and physical attributes of the plant and animal species comprising the ecosystem. Effectiveness monitoring – Activities designed and undertaken to assess how well a particular restoration project performs. Enhancement – Any improvement of a structural or functional ecosystem attribute (NRC 1992). Estuarine turbidity maxima – Circulation phenomena in an estuary that traps particles and promotes biogeochemical, microbial, and ecological processes that sustain a dominant pathway in the estuary's food web (from http://depts.washington.edu/cretmweb/). Estuary – See “Columbia River Estuary.” Flushing time – The rate at which the water in a water body is replaced. Freshet – High stream flow caused by rains or snow melt and resulting in the sudden influx of a large volume of freshwater in the estuary. Habitat – The physical, biological, and chemical characteristics of a specific unit of the environment occupied by a specific plant or animal. Habitat capacity – A category of habitat assessment metrics including "habitat attributes that promote juvenile salmon production through conditions that promote foraging, growth, and growth efficiency, and/or decreased mortality," for example, invertebrate prey productivity, salinity, temperature, and structural characteristics (cf. Simenstad and Cordell 2000). Habitat connectivity – A measure of how connected or spatially continuous are the habitats in a matrix. Habitat opportunity – A category of habitat assessment metrics that "appraise the capability of juvenile salmon to access and benefit from the habitat's capacity," for example, tidal elevation and geomorphic features (cf. Simenstad and Cordell 2000). Indicator – A characteristic of the system that is both relevant to a project objective and sensitive to predicted changes in the system. Indicators are often comprised of a suite of monitored attributes. Landscape – A mosaic where a cluster of local ecosystems is repeated in similar form over a kilometerswide area (Forman 1995). Level – Position in a hierarchical organization assigned by definition; scale-independent. Lower Columbia River – The Columbia River from McNary Dam to the mouth. Macrodetrital – Dead or dying matter from a plant or animal that is visible to the unaided eye, usually larger than 1-2 mm in diameter. Macrophyte – A macroscopic plant; examples include sedges and seaweeds. Microdetritus – Dead or dying matter from a plant or animal; usually smaller than 1-2 mm in diameter. Matrix – In landscape ecology, the background or habitats surrounding patches and corridors within any land mosaic. Monitored attribute – see “Attribute.” Monitoring protocol – see “Protocol.” xviii
Evaluating Cumulative Ecosystem Response to Restoration Projects in the Columbia River Estuary, 2004
Mosaic – A pattern of patches, corridors, and matrices, each composed of small, similar, aggregated objects (Forman 1995). Ocean-type life history – General life history pattern for salmon in which juveniles migrate to sea during their first year after emergence. Oligohaline – Water having low salinity. Otoliths –Calcareous nodules located in the inner ear of fishes and used for sound reception and equilibrium. Often analyzed to assess increments of growth. Pelagic – Refers to the water column and biota there. Performance indicator – see “Indicator.” Performance standard – Expressed as an absolute quantitative target, a range, or a change in condition from some baseline. Plume – The layer of Columbia River water in the nearshore Pacific Ocean. Population viability – Measure of the status of anadromous salmonids used by NOAA Fisheries and defined using four performance criteria: abundance, productivity, spatial distribution, and diversity. The latter two criteria are an “especially critical portion of the role of the estuary” (Fresh et al. 2004). Protocol – Standardized procedures of an assessment methodology to measure attributes of an ecological system. Realized function – A category of habitat assessment metrics that "includes any direct measures of physiological or behavioral responses that can be attributable to fish occupation of the habitat and that promote fitness and survival," for example, survival, habitat-specific residence time, foraging success, and growth (cf. Simenstad and Cordell 2000). Restoration – Return of an ecosystem to a close approximation of its previously existing condition. The term “restoration” generally refers to any or all of the five fundamental restoration approaches commonly reported in the literature: creation, enhancement, restoration, conservation, and protection (NRC 1992). Scale – Spatial proportion, as the ratio of length on a map to actual length; also, the level or degree of spatial resolution perceived or considered (Forman 1995). Semidiurnal – Occurring twice daily. Stream-type life history – General life history pattern for salmon in which juveniles migrate to sea after one year of rearing in their natal stream system. Stressor – A physical, chemical, or biological entity or process that induces effects on individuals, populations, communities, or ecosystems. A component of a conceptual model. Subarea – A portion of a larger area that has unique characteristics.
xix
Evaluating Cumulative Ecosystem Response to Restoration Projects in the Columbia River Estuary, 2004
Literature Cited Forman, R.T.T. 1995. Land Mosaics: The Ecology of Landscapes and Regions. Cambridge University Press, Cambridge. Fresh, K.L., E. Casillas, L.L. Johnson and D.L. Bottom. 2004. Role of the Estuary in the Recovery of Columbia River Basin Salmon and Steelhead: an Evaluation of Selected Factors on Population Viability. NOAA Technical Memorandum, May 2004, Northwest Fisheries Science Center, NOAA National Marine Fisheries Service, Seattle, Washington. Meffe, G.K., C.R. Carroll, and contributors. 1994. Principles of Conservation Biology. Sinauer Associates, Inc., Sunderland, Massachusetts. NRC 1992 National Research Council (NRC). 1992. Restoration of Aquatic Ecosystems. National Academy Press, Washington, D.C. Simenstad, C.A. and J.R. Cordell. 2000. Ecological Assessment Criteria for Restoring Anadromous Salmonid Habitat in Pacific Northwest Estuaries. Ecological Engineering 15:283-302.
xx
Evaluating Cumulative Ecosystem Response to Restoration Projects in the Columbia River Estuary, 2004
Contents Abstract ........................................................................................................................................................iii Preface .......................................................................................................................................................... v Executive Summary ....................................................................................................................................vii Acknowledgments......................................................................................................................................xiii Abbreviations and Acronyms ..................................................................................................................... xv Glossary ....................................................................................................................................................xvii 1.0
Introduction..................................................................................................................................... 1.1
1.1
Goals and Objectives .................................................................................................................. 1.1
1.2
Background................................................................................................................................. 1.2
1.3
Study Area .................................................................................................................................. 1.4
1.4
Literature Cited........................................................................................................................... 1.7
2.0
Cumulative Effects Research Methods: Literature Review and Synthesis for Habitat Restoration on the Columbia River Estuary....................................................................... 2.1
2.1
Introduction................................................................................................................................. 2.1
2.2
Restoration in the Columbia River Estuary ................................................................................ 2.2
2.3
Complexity of the Study Area .................................................................................................... 2.5
2.4
What Are Cumulative Effects and How Do We Measure Them? .............................................. 2.5
2.5
Cumulative Effects of Restoration in Land-Margin Ecosystems................................................ 2.6
2.6
Evaluating the Cumulative Effects of Restoration Efforts in Other Ecosystems ....................... 2.8
2.6.1 Watersheds .............................................................................................................................. 2.8 2.6.2 Fisheries .................................................................................................................................. 2.9 2.6.3 Wetlands................................................................................................................................ 2.11 2.6.4 Forests ................................................................................................................................... 2.11 2.6.5 Ecotoxicology........................................................................................................................ 2.12 2.6.6 Summary of Cumulative Effects Evaluation Methods in Related Disciplines...................... 2.13 2.7
Indicators and Measurement Methods for the Cumulative Effects of Estuarine Habitat Restoration ................................................................................................................... 2.14
2.7.1 Predicted Effects.................................................................................................................... 2.14 2.7.2 Indicators of Ecological Structure, Process, and Function.................................................... 2.17 2.7.3 Organic Matter Production .................................................................................................... 2.18 2.7.4 Nutrient Cycling .................................................................................................................... 2.19 2.7.5 Sedimentation........................................................................................................................ 2.20 2.7.6 Biodiversity ........................................................................................................................... 2.21
xxi
Evaluating Cumulative Ecosystem Response to Restoration Projects in the Columbia River Estuary, 2004
2.7.7 Habitat Opportunity and Allometry....................................................................................... 2.22 2.7.8 Salmon Habitat Usage and the Food Web............................................................................. 2.23 2.8
Synthesis and Proposed Approach............................................................................................ 2.26
2.8.1 Proposed Weight-of-Evidence Evaluation Approach............................................................ 2.26 2.8.2 Key Assessment Tools for a Weight-of-Evidence Approach................................................ 2.27 2.9
Conclusion ................................................................................................................................ 2.30
2.10 Literature Cited......................................................................................................................... 2.31 3.0
Columbia River Estuary Habitat Use by Juvenile Salmonids......................................................... 3.1
3.1 Juvenile Salmon Research in the Columbia River Estuary ............................................................. 3.1 3.1.1 Study Years 1914 - 1916 ......................................................................................................... 3.2 3.1.2 Study Year 1963...................................................................................................................... 3.2 3.1.3 Study Years 1966 - 1972 ......................................................................................................... 3.2 3.1.4 Study Years 1977 - 1983 ......................................................................................................... 3.3 3.1.5 Study Years 1980 - 1981 ......................................................................................................... 3.4 3.1.6 Study Years 1995 - Present ..................................................................................................... 3.5 3.1.7 Study Years 1997 - Present ..................................................................................................... 3.5 3.1.8 Study Years 2001 - Present ..................................................................................................... 3.6 3.2
Research, Restoration, and Recovery of Salmon Stocks ............................................................ 3.6
3.3
Literature Cited........................................................................................................................... 3.7
4.0
A Columbia River Estuary Conceptual Model ............................................................................... 4.1
4.1
Background................................................................................................................................. 4.1
4.2
Model Description ...................................................................................................................... 4.2
4.3
Conclusion .................................................................................................................................. 4.7
4.4
Literature Cited........................................................................................................................... 4.9
5.0
Standard Monitoring Protocols and Methods to Assess Restoration of Salmon Habitat in the Lower Columbia River and estuary.......................................................................... 5.1
5.1
Background................................................................................................................................. 5.1
5.2
Types of Restoration Strategies in the CRE ............................................................................... 5.2
5.2.1 Conservation............................................................................................................................ 5.4 5.2.2 Creation ................................................................................................................................... 5.4 5.2.3 Enhancement ........................................................................................................................... 5.4 5.2.4 Restoration .............................................................................................................................. 5.4 5.2.5 Protection ................................................................................................................................ 5.4 5.3
Minimum Monitored Metrics in the CRE................................................................................... 5.6
5.3.1 Metric Selection Criteria ......................................................................................................... 5.6 xxii
Evaluating Cumulative Ecosystem Response to Restoration Projects in the Columbia River Estuary, 2004
5.3.2 Metrics..................................................................................................................................... 5.7 5.4
Sampling Design......................................................................................................................... 5.9
5.4
Sampling Design......................................................................................................................... 5.9
5.5
Monitoring Protocols for Columbia River Estuary Habitat Restoration Projects..................... 5.13
5.6
Literature Cited......................................................................................................................... 5.33
6.0
Summary, Recommendations and Management Implications ....................................................... 6.1
6.1
Summary of Findings ................................................................................................................. 6.1
6.1.1 Objective 1. Review available scientific literature on evaluating cumulative ecosystem effects as it applies to the CRE and design an approach to develop cumulative effects assessment methods. .............................................................................................................. 6.1 6.1.2 Objective 2. Summarize knowledge on estuary habitat usage by juvenile salmon as it relates to habitat restoration efforts............................................................................................ 6.2 6.1.3 Objective 3. Provide a conceptual model of the Columbia River Estuary. ............................ 6.3 6.1.4 Objective 4. Draft standard protocols for monitoring habitat restoration projects.................. 6.3 6.2
Recommendations....................................................................................................................... 6.4
6.2.1 Field Studies in 2005............................................................................................................... 6.4 6.2.2 Multi-Year Study..................................................................................................................... 6.9 6.3
Management Implications ........................................................................................................ 6.10
6.3.1 Management Implication No. 1 – Decisions on Implementing CRE Habitat Restoration Projects......................................................................................................................... 6.11 6.3.2 Management Implication No. 2 – Evaluation of the CRE Habitat Restoration Effort ......... 6.11 6.3.3 Management Implication No. 3 – Water Resources Development Act: Restoration in the Columbia River Estuary..................................................................................... 6.12 6.3.4 Management Implication No. 4 – Effects on Listed Salmonids........................................... 6.13 6.3.5 Management Implication No. 5 – Columbia Basin-Wide Cumulative Effects Assessments ........................................................................................................................ 6.14 6.3.6 Management Implication No. 6 – Collaborative Planning for Large-Scale River Systems Restoration .............................................................................................................. 6.14 6.3.7 Summary .............................................................................................................................. 6.15 6.4
Literature Cited......................................................................................................................... 6.15
Appendix A - Proceedings of the Columbia River Estuary Restoration Project Managers’ Meeting on Restoration Monitoring .......................................................................................... A.1
xxiii
Evaluating Cumulative Ecosystem Response to Restoration Projects in the Columbia River Estuary, 2004
Figures Figure 1.1. Satellite Photograph of the Estuary Study Area ..................................................................... 1.5 Figure 4.1. Structure of the Conceptual Model......................................................................................... 4.3 Figure 4.2. Components of the Conceptual Model ................................................................................... 4.4 Figure 4.3. Home Page of the Conceptual Model..................................................................................... 4.6 Figure 4.4. Emergent Marsh Page of the Conceptual Model.................................................................... 4.7 Figure 5.1. Extent of restoration activities in the Columbia River Estuary. ............................................. 5.3
Tables Table 2.1. Restoration Measures and Potential Cumulative Effects.. ..................................................... 2.16 Table 2.2. Minimum and Higher Order Monitoring Metrics .................................................................. 2.29 Table 5.1. Restoration Strategies, Examples of Project Types, and Targeted Ecosystem Benefits for the CRE ....................................................................................................... 5.5 Table 5.2. Summary of Monitored Attributes for Lower Columbia River and Estuary Restoration Projects........................................................................................................................... 5.9 Table 5.3. The Sequence of Sampling Events in BACI Design.............................................................. 5.11 Table 6.1. Multi-Year Project Objectives and Tasks .............................................................................. 6.10
xxiv
Evaluating Cumulative Ecosystem Response to Restoration Projects in the Columbia River Estuary, 2004
1.0 Introduction Measurement of the cumulative effects of ecological restoration projects in the Columbia River estuary (CRE) will be formidable because of the size and complexity of the estuarine landscape. Despite the challenges, developing and implementing appropriate indicators and methods to measure cumulative effects is the best way to enable estuary managers to track the overall effectiveness of investments in estuarine restoration projects. In 2004, we developed a set of measurable parameters that restoration managers can apply at most if not all restoration project sites, and we are continuing to develop and test indicators, methods and a sampling design supporting an estuary-wide cumulative effects analysis and adaptive management framework.
1.1 Goals and Objectives The primary goal of this multi-year study is to develop a framework and methodology to measure and evaluate the cumulative effects of habitat restoration actions in the CRE aimed at increasing population levels of listed Columbia Basin salmon. This framework and methodology will ensure comparable data sets across multiple restoration monitoring efforts estuary-wide. The management implications of this research are two-fold in that it is expected to provide techniques that will allow decision-makers to 1) evaluate the ecological performance of the collective habitat restoration effort in the CRE and its effects on listed salmon, and 2) apply knowledge from comparable datasets for ongoing monitoring to prioritize future habitat restoration projects. The overall objectives of this multi-year study are to 1. Develop standard monitoring protocols and methods to prioritize monitoring activities that can be applied to CRE habitat restoration activities for listed salmon. 2. Develop the empirical basis for a cumulative assessment methodology, together with a set of metrics, a conceptual ecosystem model, and a conceptual framework depicting the cumulative effects of CRE restoration projects on key ecosystem functions supporting listed salmon. 3. Design and implement field evaluations of the cumulative effects methodologies. 4. Develop an adaptive management system including data management and dissemination to support decisions by the COE and others regarding CRE habitat restoration activities intended to increase population levels of listed salmon.
This report is organized by the following specific objectives of the 2004 study: •
Synthesize available scientific literature on evaluating cumulative ecosystem effects as it applies to the CRE (Chapter 2).
•
Describe estuary habitat usage by juvenile salmon (Chapter 3).
•
Provide a conceptual model for the estuary (Chapter 4).
1.1
Evaluating Cumulative Ecosystem Response to Restoration Projects in the Columbia River Estuary, 2004
•
Draft standard protocols for monitoring habitat restoration projects (Chapter 5 and Appendix A).
•
Summarize the management implications of the findings and recommend actions to standardize monitoring protocols and assess the cumulative effects of habitat restoration in the CRE (Chapter 6).
1.2 Background Under Congressional authorities in various Water Resource Development Acts, the U.S. Army Corps of Engineers and others are working to restore estuarine habitats in the Columbia River Estuary. For example, restoration activities are being considered that would reconnect backwater channels, sloughs, and oxbows through dike removal or tidegate modification. The vision is to improve CRE functionality through habitat restoration efforts to aid in rebuilding listed salmon stocks in the Columbia Basin. As the salmon habitat restoration effort grows, projects being implemented will require some level of monitoring and evaluation of effectiveness. Based on present information, there is little basis on which to assess whether the proposed restoration actions will have a net cumulative benefit to CRE health and functionality. It will not, however, be practical to intensively monitor the results of every project. Therefore, methods must be established to prioritize and manage limited monitoring budgets. In addition, data from numerous restoration monitoring efforts should be as comparable as possible to aid decisionmakers as they learn from the collective project-specific monitoring data. Standardized monitoring protocols are necessary to compare restoration effectiveness through time at a given project site and through space among multiple projects. Focused, prioritized, and standardized monitoring at the project level will support monitoring and evaluation at the landscape level that will ultimately help determine the success of the CRE salmon habitat restoration. Although it is relatively straightforward to measure the area of habitat restored, it is difficult to assess the cumulative effects of individual restoration projects on ecosystem function. Currently, a formal method does not exist for quantifying whether restoration of habitats will have a measurable effect on the health and functionality of the ecosystem or on the viability of salmon populations. Small projects, for example, may result in local improvements, confined to a relatively short distance from the restoration site. Many small projects may only improve conditions within a small area and not have any significant effect on the larger ecosystem. In contrast, it is possible that a mix of large and small projects, placed strategically within the system, containing the appropriate mix of habitats, and managed in a way to maximize success, may provide significant improvements to the estuary. The availability of land in the CRE for habitat restoration, however, will be an important factor affecting the size of projects to be implemented. Implementation of the methodology developed in this study will likely be affected by the types and sizes of potential projects and, therefore, the methodology must allow for objectively incorporating this variable. Most importantly, restoration actions in the CRE represent a unique opportunity to develop and employ science-based, defensible methods to evaluate the potential cumulative gains in ecosystem function provided by a suite of restoration projects in the system. Accounting for the total effect of multiple restoration actions on the functioning of the system is one of the most important challenges in restoration science. In theory, it is assumed that any improvement to a component (e.g., enhancement of a selected habitat attribute; Shreffler and Thom 1993) will contribute
1.2
Evaluating Cumulative Ecosystem Response to Restoration Projects in the Columbia River Estuary, 2004
to ecosystem improvement. However, the size, amount, number of projects, types of projects, etc., that will have the greatest benefit is unknown. In a situation where the state of the system has been altered, such as in the CRE, knowing how many, what type, and where to place projects to result in a reversal of degradation and measurable return to a former and less disturbed state would help guide restoration programs and justify the expenditures of funds directed toward restoration. The development of methods to detect and assess the cumulative net improvement toward a former system state is the focus of this research. Relevant to the proposed research, we paraphrase the definitions of cumulative impacts and cumulative effects in Leibowitz et al. (1992) as follows: •
Cumulative restoration impacts are the net sum of all changes in selected habitat metrics of all restoration projects occurring over time and space, including those in the foreseeable future of the development of these projects.
•
Cumulative restoration effects are the net change in ecosystem-wide metrics and ecosystem state resulting from cumulative restoration impacts.
The challenge of balancing the need for coastal economic development with enhancement of coastal ecosystems is among the top priorities for coastal planners and researchers this century (Thom et al. 2005). In this context, we introduced the concept of “net ecosystem improvement” of previously degraded sites, which is defined as “following development, there is an increase in the size and natural functions of an ecosystem or natural components of the ecosystem” (Thom et al. 2005). We argue that this concept is critical to meeting the sustainability of coastal systems as defined by the World Commission on Environment and Development (1987). The present study provides much needed data and guidance on the effects of habitat restoration intended to mitigate development in the Columbia River. The restoration of damaged ecosystems is fraught with uncertainty. The uncertainties can be grouped into two types: 1) general uncertainty about the response of the ecosystem to restorative actions and 2) uncertainty associated with random, uncontrollable events that can affect restoration outcomes (Diefenderfer et al. 2005). As a result, it is difficult to accurately predict when and if the ecosystem will meet restoration goals. Because of this, and the fact that restoration projects can be expensive, information that helps improve predictability is critically needed. Adaptive management can provide the framework for improving the predictability of restoration projects (Thom 1997, 2000). Hence, there is a growing awareness of the need to conduct restoration projects within an adaptive management framework in order to maximize the benefit to the ecosystem from the effort to restore the system. It is our intent in this multi-year study to develop an adaptive management framework for restoration of the CRE. The framework will include the most common components: goal statements, a conceptual model, a monitoring program, evaluation and decision guidance, and an information dissemination system (Diefenderfer et al. 2003; Thom and Wellman 1996). The framework will benefit from components either already developed or under development through this study and other programs in the CRE (i.e., general goals for the system as expressed by the Corps, the Bonneville Power Administration (BPA), the Lower Columbia River Estuary Partnership (LCREP) and other entities; conceptual model initiated in FY04; monitoring protocols initiated in FY04; existing research programs; and nearshore assessment initiated in FY05). The ultimate aims are to dramatically improve the success of restoration projects in the CRE and to contribute, by example, to the science of ecosystem restoration. 1.3
Evaluating Cumulative Ecosystem Response to Restoration Projects in the Columbia River Estuary, 2004
This study addresses the above issues and provides information that can be used to make management decisions primarily regarding cumulative effects of estuarine restoration that are designed to enhance ecological functions benefiting the estuarine ecosystem and its juvenile salmon inhabitants. The work is intended to provide a means to assess and quantify the cumulative improvements associated with restoration projects and to lay the foundation for the evaluation of the effectiveness of the restoration activities undertaken. Thus, this study examines the effects of habitat restoration in the CRE on a comprehensive, ecosystem basis. Assumptions guiding our efforts include the following: •
Standardization of monitoring methods will result in comparable data sets.
•
Monitoring efforts can be prioritized and designed strategically while maintaining statistical rigor.
•
The CRE must be viewed as a landscape to assess cumulative effects of actions designed to benefit salmon.
•
A conceptual model of the CRE, including the food web, provides organization and focus to the research and assessment.
•
Key attributes indicating ecosystem response to restoration will be developed.
•
A framework can be designed and applied to assess the cumulative effects for multiple restoration actions.
•
An adaptive management system based on project and ecosystem monitoring data will aid decision-makers in implementing salmon habitat restoration in the CRE.
1.3 Study Area A number of publications provide descriptive information about the estuary study area: the Salmon at River’s End report by Bottom et al. (2001); Fresh et al.’s (2004) Role of the Estuary in the Recovery of Columbia River Basin Salmon and Steelhead; the Biological Assessment for the Columbia River Channel Improvements Project by the COE (2004); the RPA Action 158 action plan by Berquam et al. (2003); the Reasonable and Prudent Alternative (RPA) Action 159 habitat restoration report by Johnson et al. (2003); and the Northwest Power and Conservation Council (NPCC) subbasin plan for the estuary (Lower Columbia Fish Recovery Board 2004). Important earlier compendiums include The Columbia River Estuary and Adjacent Ocean Waters by Pruter and Alverson (1972); “Columbia River Estuary” in Changes in Fluxes in Estuaries: Implications from Science to Management by Dyer and Orth (1994); and “Columbia River: Estuarine System” by Small (1990), which contains reviews of earlier work supported by the Columbia River Estuary Data Development Program (CREDDP) on physical and biological processes (CREDDP 1984a, 1984b). Another comprehensive environmental study of the lower Columbia River was the Bi-State Water Quality Study (TetraTech 1996; Fuhrer et al. 1996), completed as part of the process to include the Columbia River estuary in the U.S. Environmental Protection Agency (EPA)’s National Estuary Program. The brief study site description that follows draws from these major works and other literature to provide context for the CRE cumulative effects study.
1.4
Evaluating Cumulative Ecosystem Response to Restoration Projects in the Columbia River Estuary, 2004
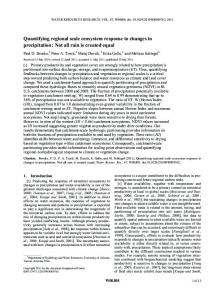
The Columbia River, with a drainage basin area of 660,480 km2 (Simenstad et al. 1990), has the fourth highest average discharge at mouth and the sixth largest watershed in the United States (USGS 1990; analysis includes Great Lakes/St. Lawrence and Yukon rivers and separates Mississippi, Missouri and Ohio rivers) (see Figure 1.1). The width of the Columbia River is less than 2 km some 84 rkm from the Pacific Ocean, nearly 15 km at rkm 32, and approximately 3 km at the jetties at the river mouth (Neal 1972). The river bottom is below sea level at Bonneville Dam and the estuary contains scattered deep areas, for example near 30 m at Grays Point (Neal 1972). Historically, unregulated flows were estimated to range from a minimum of 2,237 m3/s (79,000 cfs) in the fall to maximum flood flows of over 28,317 m3/s (1 million cfs) during spring freshets (Sherwood et al. 1990). Since the 1930s, however, the timing of the Columbia River’s discharge has been progressively regulated due to construction and operation of 28 major dams and approximately 100 minor dams on the river’s main stem and tributaries that reduce spring freshet flows and increase fall/winter flows. Hydrographic modeling estimated that the spring freshet (May-July) flow reduction attributable to flow regulation is 33.1%, and the total reduction in freshet mean flow when climate and water withdrawal are included is 43% of pre-1900 flows (Jay and
N
5
0
5
10
15 Miles
1:1077639
Figure 1.1. Satellite Photograph of the Estuary Study Area. (The map was made from LandSat data provided by R. Garano through the Estuary Partnership’s habitat mapping project funded by BPA and COE.) 1.5
Evaluating Cumulative Ecosystem Response to Restoration Projects in the Columbia River Estuary, 2004
Hickey 2001, as cited in Fresh et al. 2004). Alterations in the physical processes of the estuary that are attributable to human intervention include decreased freshwater discharge rates, tidal prism, and mixing; and increased flushing time and fine sediment deposition, resulting in a net accumulation of sediment (Sherwood et al. 1990). Despite alterations to river discharge patterns by the Federal Columbia River Power System (FCRPS) and other factors, the estuary is still river-dominated because of relatively high flow volumes. However, the semidiurnal tidal range in the estuary is relatively large at 3.6 m and oceanic tides affect water levels throughout the entire lower reach to Bonneville Dam (rkm 235) (Neal 1972; Sherwood and Creager 1990). Maximum seawater intrusion during low river flow is variable but less than 37 km (Neal 1972). Estuary flushing time has been calculated using several methods; calculations using a river flow of 15.5 x 10⁷ m3/tidal cycle (549 x 107 cu ft/tidal cycle) and maximum salinity intrusion of 35 km (19 nautical miles), for example, predict total flushing time ranging from 4.97 tidal cycles using the fraction-offreshwater method to 9.0 tidal cycles using the modified tidal-prism method (Neal 1972). As an extension of the estuary, the Columbia River plume is a dominant factor affecting the hydrography of Pacific Northwest coastal waters (Garcia-Berdeal et al. 2002; Hickey and Banas 2003). The Columbia River estuary, which occupies a drowned river valley, has been classified as a mesotidal estuary according to Sherwood and Creager (1990). According to Neal (1972), the Columbia River estuary resists classification by Pritchard’s (1955) approach based on mixing characteristics because of temporal and regional variability between three of the classes: vertically stratified, partially mixed, and well mixed. Thus, the study area defined for this study is too broad to allow for a discreet classification. The landscape context of the estuary may be described by its representative ecoregions, according to the EPA classification (Omernik and Gallant 1986): Coast Range, Puget Lowland, Willamette Valley, and Cascades. The classification on the Oregon side has been refined for the purpose of water quality management to include Coastal Mountains, Coastal Lowlands, Willamette Valley Plains, and Western Cascades (Clarke et al. 1991). The study area, broadly defined for the purposes of terrestrial ecology and plant communities, contains five physiographic provinces: the Southern Washington Cascades, Western Cascades, Puget Trough, Willamette Valley, and Coast Ranges (Franklin and Dyrness 1988). Estuarine landcover is shown by maps using LandSat and compact airborne spectrographic imaging. Several categories of herbaceous wetlands, shrub-scrub wetlands, and coniferous and deciduous forest wetlands have been identified (Garono and Robinson 2003). For the purpose of a change analysis from 1870 to present, Thomas (1983) found that only five habitat types could be delineated. In order by elevation from highest to lowest, these are tidal swamps, tidal marshes, shallows and flats, medium-depth water, and deep water. He assessed the change in these habitat types in seven subareas: the river mouth, mixing zone, Youngs Bay, Baker Bay, Grays Bay, Cathlamet Bay, and the upper estuary. Habitat loss and habitat conversion are documented in Thomas’ maps (1983). Perhaps the most critical findings for salmon are that below Puget Island, the area of tidal swamps has been reduced by 77%, and 65% of the 1870 tidal marshes have been lost while new marshes totaling about 22% of the original area have been formed (a net loss of 43%) (Thomas 1983). The study also showed net losses of medium and deep water habitats (35% and 7%, respectively), and a gain of shallows and flats caused mostly by shoaling in formerly deeper water areas (10%).
1.6
Evaluating Cumulative Ecosystem Response to Restoration Projects in the Columbia River Estuary, 2004
Because the metropolitan areas of Vancouver, WA, and Portland, OR, as well as smaller cities such as Longview, WA, and Astoria, OR, span the Columbia River estuary, many pressures from urban development are currently present or have existed in the past. Modifications to riparian areas, tributaries, and the main stem of the river via activities associated with dredging, bridge construction, and port development have dramatically altered the characteristics of the river and estuary. The direct impacts of these physical alterations to juvenile salmon and other biota are largely unknown.
1.4 Literature Cited Berquam, T.B., B.D. Ebberts, and J. Wilcox. 2003. Action Plan to Implement the FCRPS Biological Opinion in the Columbia River Estuary. Submitted to NOAA National Marine Fisheries Services, September 30, 2003, by U.S. Army Corps of Engineers and Bonneville Power Administration, Portland, Oregon. Bottom, D.L., C.A. Simenstad, A.M. Baptista, D.A. Jay, J. Burke, K.K. Jones, E. Casillas, and M. Schiewe. 2001. Salmon at River's End: The Role of the Estuary in the Decline and Recovery of Columbia River Salmon. DRAFT by NOAA National Marine Fisheries Services, Seattle, Washington. Clarke, S.E., D. White and A.L. Schaedel. 1991. “Oregon, USA, Ecological Regions and Subregions for Water Quality Management.” Environmental Management 15(6): 847-856. Columbia River Estuary Data Development Program (CREDDP). 1984a. Index to CREDDP Data. Compiled by H.T. Mercier. S. Bell, ed. Columbia River Estuary Study Taskforce, Astoria, Oregon. Columbia River Estuary Data Development Program (CREDDP). 1984b. Abstracts of Major CREDDP Publications. Compiled by D. Fox. Columbia River Estuary Study Taskforce, Astoria, Oregon. Diefenderfer, H.L., R.M. Thom and K.D. Hofseth, 2005. “A framework for risk analysis in ecological restoration projects.” In Economics and Ecological Risk Assessment: Applications to Watershed Management, R.J.F. Bruins and M.T. Heberling (Eds), CRC Press, Boca Raton, Florida. Diefenderfer, H.L., R.M. Thom and J.E. Adkins. 2003. A Systematic Approach to Coastal Ecosystem Restoration. PNWD-3237 prepared for the National Oceanic and Atmospheric Administration Coastal Services Center by Battelle, Richland, Washington. Dyer, K.R. and R.J. Orth, eds. 1994. Changes in Fluxes in Estuaries: Implications from Science to Management. Proceedings of ECSA22/ERF Symposium, 13-18 September 1992, Institute of Marine Studies, University of Plymouth. Olsen & Olsen, Fredensborg, Denmark. Franklin, J.F. and C.T. Dyrness. 1988. Natural Vegetation of Oregon and Washington. OSU Press. Corvallis, Oregon. Fresh, K.L., E. Casillas, L.L. Johnson and D.L. Bottom. 2004. Role of the Estuary in the Recovery of Columbia River Basin Salmon and Steelhead: an Evaluation of Selected Factors on Population Viability. NOAA Technical Memorandum, May 2004Northwest Fisheries Science Center, National Marine Fisheries Service, NOAA National Marine Fisheries Service, Seattle, Washington.
1.7
Evaluating Cumulative Ecosystem Response to Restoration Projects in the Columbia River Estuary, 2004
Fuhrer, G.J., D.Q. Tanner, J.L. Morace, S.W. McKenzie and K.A. Skach. 1996. Water Quality of the Lower Columbia River Basin: Analysis of Current and Historical Water Quality Data through 1994. U.S. Geological Survey Water-Resources Investigations Report 95-4294, prepared in cooperation with the Lower Columbia River Bi-State Water-Quality Program, Portland, Oregon. Available URL: www.lcrep.org Garano, R.J. and R. Robinson. 2003. Estuarine Landcover along the Lower Columbia River Estuary Determined from Compact Airborne Spectrographic Imager (CASI) Imagery. Final Report submitted to Lower Columbia River Estuary Partnership, Portland, Oregon, October 2003. Garcia-Berdeal, I., B. Hickey, and M. Krause. 2002. “Influence of wind stress and ambient flow on a high discharge river plume.” Journal of Geophysical Research 107: 3130. Hickey, B. and N. Banas. 2003. “Oceanography of the U.S. Pacific Northwest coastal ocean and estuaries with application to coastal oceanography.” Estuaries 26: 1010-1031. Jay, D.A., and B.M. Hickey. 2001. “Non-stationary internal tides in the Columbia River plume area.” In preparation. J. Geophys. Res. Johnson G.E., R.M. Thom, A.H. Whiting, G.B. Sutherland, T. Berquam, B.D. Ebberts, N.M. Ricci, J.A. Southard, and J.D. Wilcox. 2003. An Ecosystem-Based Approach to Habitat Restoration Projects with Emphasis on Salmonids in the Columbia River Estuary. PNNL-14412, Final report submitted to the Bonneville Power Administration, Portland, Oregon, November 2003, by Pacific Northwest National Laboratory, Richland, Washington. Leibowitz, S.G., B. Abbruzzese, P.R Adamus, L.E. Hughes, and J.T. Irish. 1992. A Synoptic Approach to Cumulative Impact Assessment: A Proposed Methodology. EPA/600/R-92/167. U.S. Environmental Protection Agency, Environmental Research Laboratory, Corvallis, Oregon. Lower Columbia Fish Recovery Board. 2004. Lower Columbia Salmon and Steelhead Recovery and Subbasin Plan. Volume I and II. Draft report prepared for the Northwest Power and Conservation Council, May 28, 2004. Available URL: http://www.nwcouncil.org/fw/subbasinplanning/lowerColumbia/plan/. National Research Council (NRC). 1992. Restoration of Aquatic Ecosystems. National Academy Press, Washington, D.C. Neal, V.T. 1972. “Physical Aspects of the Columbia River and Its Estuary.” In The Columbia River Estuary and Adjacent Ocean Waters: Bioenvironmental Studies. Pruter, A.T. and D.L. Alverson, (eds). University of Washington Press, Seattle, Washington. Omernik, J.M. and A.L. Gallant. 1986. Ecoregions of the Pacific Northwest States. EPA/600/3-86/033, U.S. Environmental Protection Agency Environmental Research Laboratory, Corvallis, Oregon. Pritchard, D. W. 1955. “Estuarine circulation patterns.” Proc. American Society of Civil Engineering 81: 717/1–717/11. Pruter, A.T. and D.L. Alverson (eds.). 1972. The Columbia River Estuary and Adjacent Ocean Waters: Bioenvironmental Studies. University of Washington Press, Seattle, Washington. Sherwood, C.R. and J.S. Creager. 1990. “Sedimentary geology of the Columbia River estuary.” Progress in Oceanography 25: 15-79. Sherwood, C.R., D.A. Jay, R.B. Harvey, P. Hamilton and C.A. Simenstad. 1990. “Historical changes in
1.8
Evaluating Cumulative Ecosystem Response to Restoration Projects in the Columbia River Estuary, 2004
the Columbia River estuary.” Progress in Oceanography 25: 299-352. Shreffler, D. K. and R.M. Thom. 1993. Restoration of Urban Estuaries: New Approaches for Site Location and Design. Battelle/Marine Sciences Laboratory, Sequim, Washington. Simenstad, C.A., L.F. Small, C.D. McIntire, D.A. Jay and C Sherwood. 1990. “Columbia River estuary studies: An introduction to the estuary, a brief history, and prior studies.” Progress in Oceanography 25: 1-13. Small, L.F. (ed.). 1990. “Columbia River: Estuarine System.” Progress in Oceanography, Vol. 25, no. 1-4. TetraTech. 1996. The health of the river 1990-1996: integrated technical report. Report TC 0253-01, prepared by Tetra Tech for the Lower Columbia River Bi-State Program, May 20, 1996. Thom, R.M. 1997. “System-development matrix for adaptive management of coastal ecosystem restoration projects.” Ecological Engineering 8:19-232. Thom, R.M. 2000. “Adaptive management of coastal ecosystem restoration projects.” Ecological Engineering 15:365-372. Thom, R.M. and K. Wellman. 1996. Planning Aquatic Ecosystem Restoration Monitoring Programs. Institute of Water Resources report 96-R-23, U.S. Army Corps of Engineers, Alexandria, Virginia, and Waterways Experiment Station, U.S. Army Corps of Engineers Vicksburg, Mississippi. Thom, R.M., G.W. Williams, and H.L. Diefenderfer. 2005. “Balancing the need to develop coastal areas with the desire for an ecologically functioning coastal environment: Is net ecosystem improvement possible?” Restoration Ecology 13(1): 193-203. Thomas, D.W. 1983. Changes in the Columbia River estuary habitat types over the past century. Columbia River Estuary Data Development Program. 51 (Available from Columbia River Estuary Study Taskforce. P.O. Box 175, Astoria, OR 97103). USGS (United States Geological Survey). 1990. “Largest rivers in the United States, in discharge, drainage area, or length.” Open-File Report 87-242, Reston, Virginia. World Commission on Environment and Development. 1987. Our Common Future. Oxford University Press, New York.
1.9
Evaluating Cumulative Ecosystem Response to Restoration Projects in the Columbia River Estuary, 2004
1.10
Evaluating Cumulative Ecosystem Response to Restoration Projects in the Columbia River Estuary, 2004
2.0 Cumulative Effects Research Methods: Literature Review and Synthesis for Habitat Restoration on the Columbia River Estuary 2.1 Introduction One response to the listing of endangered salmon in the Columbia River has been to increase the investment of federal, state, other governmental, and private funds into habitat restoration efforts within the Columbia River estuary. Federal agencies, including the U.S. Army Corps of Engineers (Corps), are funding habitat restoration in part to earn mitigation credits to offset the effects of the Federal Columbia River Power System (FCRPS). In addition to habitat restoration efforts in the Columbia River estuary (CRE) associated with Endangered Species Act (ESA) listings, the Corps has water resource development authorities to direct efforts toward habitat restoration actions within the CRE. Other habitat restoration actions are being undertaken by a variety of governmental and nongovernmental entities, with funding from multiple sources. Furthermore, a variety of methods are being pursued to achieve very different goals, some of which are not salmon related. With respect to the evaluation process, no single set of monitoring protocols has been generally accepted by researchers working in estuaries. Therefore, there is a need to measure the effectiveness of these multiple habitat restoration actions aimed at improving salmon population viability and estuarine environmental conditions. The ecological benefits of habitat restoration in the estuary must be demonstrated and cannot be assumed. Challenges such as these, associated with multi-jurisdictional environments, are typical issues faced by the Corps in river basin and coastal systems planning. A recent analysis by the National Research Council (NRC) clarifying the Corps’ ecosystem restoration mission demonstrates the complexity of factors that need to be considered (NRC 2004a-d). In order to restore the hydrologic and geomorphic processes of large river and coastal systems, the NRC recommended the Corps adopt strategies including the following: integrated large-scale systems planning, adaptive management methods, expanded postproject evaluations, and a collaborative approach. These recommendations will help guide the effort to assess the cumulative effects of restoration in the Columbia River estuary. In addition to the complexities posed by the human landscape, the natural variability of ecosystem structures, processes, and functions throughout the 235-km estuary in the Columbia Basin is not well understood (Bottom et al. 2001). Nor are the specific roles of the estuary’s habitats in supporting the various endangered salmon stocks that utilize estuarine habitats during different portions of their life cycles. The endangered stocks exhibit different life histories, broadly evidenced by the seasons of their migrations (Burke 2004, Rich 1920). The stocks have been categorized into two general groups – stream type and ocean type – each of which exhibits a different general pattern of estuarine habitat usage (see Chapter 3). The need to include salmon as part of the evaluation of estuarine restoration efforts complicates the assessment process. Salmon are anadromous fishes that spend significant portions of their lives in nonestuarine habitats: the tributaries and the ocean. Thus the geographic scope of the habitats featuring in population-level analyses of the status of the endangered stocks is quite large. For any given population, 2.1
Evaluating Cumulative Ecosystem Response to Restoration Projects in the Columbia River Estuary, 2004
the scope includes a subbasin of the Columbia River, the mainstem Columbia River, the Columbia River plume, the Columbia estuary, and the Pacific Ocean. Modeling by Karieva et al. (2000) suggested that habitat improvements in the estuary have the potential to increase survival and therefore salmon population viability; these modeling results emphasize the importance of including a larger spatial scale in restoration efforts than the specific site being restored. Although salmon population viability modeling is important, the focus of this study is to develop an objective basis for measuring and analyzing the effect of estuarine habitat improvement on salmon population viability. The objectives of this chapter are to 1) describe restoration on the CRE and the complexity of the study area, 2) review existing approaches for evaluating cumulative effects for their relevance to restoration projects in the estuary, 3) review potential indicators and associated measurable attributes of the ecosystem that may be useful to monitor during a cumulative effects evaluation, and 4) synthesize the results of these reviews to propose an approach for such an evaluation in the estuary. The goal is not to create a plan for monitoring the status and trends of habitats in the estuary, but rather to identify a means to measure the effectiveness of multiple restorative actions. Evaluating the “success” of coastal habitat restoration projects is a challenge and a variety of methods have been developed to assess whether a project has been successful or not (Wilber et al. 1998). To increase the usefulness of the evaluation process, we suggest it is important to distinguish between evaluating “success” and evaluating “effects.” In the case of the Columbia River estuary, performance objectives for salmon populations and for restored habitat acreage have not been quantified, in part due to the uncertainty concerning the relationships between the estuary habitats and the endangered stocks. Thus the aim here is to quantify effects, and in so doing to augment our knowledge about the fundamental ecological processes and species-habitat relationships in the estuary. This paper does not comprehensively review the state of the science regarding fisheries and habitats in the estuary. It does, however, draw from Columbia River estuary-specific literature as well as literature from multiple disciplines when they illuminate approaches that would be useful to consider incorporating into evaluation processes for estuarine restoration. The review of literature on cumulative effects in this chapter begins with that most specific to the problem – the cumulative effects of multiple estuarine restoration projects. Finding a dearth of similar investigations, we then proceeded to explore related literature in a search for relevant approaches: approaches to evaluate the cumulative effects of various disturbances on ecosystem degradation; the cumulative effects of ecological restoration projects in other ecosystems; and responsive indicators of the effects of restoration actions in estuarine habitats. This leads to a synthesis of the literature and a proposed approach to cumulative effects assessment.
2.2 Restoration in the Columbia River Estuary Ecological processes in the estuary have been modified by the construction of numerous dams in the Columbia Basin, resulting in regulated flow of water (Figure 1.1; see Simenstad et al. 1992). Ecological processes have further been modified by the construction of dikes and levees to control flooding within the floodplain of the CRE, which can alter water velocities (Hendry et al. 2003). In fact, one modeling analysis showed that diking has reduced shallow water habitat area during the spring freshet by 52% while flow cycle alteration reduced it by 29% (Kukulka and Jay 2003a,b). The estuary also evinces the 2.2
Evaluating Cumulative Ecosystem Response to Restoration Projects in the Columbia River Estuary, 2004
effects of legacy land uses that have altered these environments including wholesale conversion to other land uses (e.g., urbanization, intensive agriculture/forestry) in portions of the floodplain and contributing subbasins. The very definition of the Columbia River estuary is affected by the presence of Bonneville Dam, which marks the upstream extent of the tidally influenced portion of the Columbia River at 235 km from the river’s mouth. Changes in both floodplain land use and the dynamics of the water supply have directly contributed to changes in the quantity and distribution of habitats in the estuary since the late 1800s. These changes have been documented in Thomas (1983) for the lower 74 km of the estuary and include a 77% loss of tidal swamps and a 43% loss of tidal marshes prior to 1980 in the lower 74 km alone. Thomas (1983) also documented that almost 150 km2 of estuary habitat was converted to diked floodplain, uplands, and nonestuarine wetlands. These high rates of land use change and land conversion are symptomatic of global trends that are now bringing biome-level losses in temperate and Mediterranean systems at levels rivaling the high rates of species extinctions initially reported in the early 1960s and through the 1970s in tropical rainforests (Sala et al. 2000). Given these developments in the Columbia River basin, it may be useful to view the estuary as an engineered system in which it is highly unlikely that historical ecosystem structures, processes, and functions will be regained in their entirety. Due to the presence of the FCRPS and society’s need for flood control in portions of the estuary, it is unlikely that a typical restoration goal such as “a close approximation of the historical estuarine ecosystem” will be implemented. Such infrastructure restrictions also exist in other large-scale restoration programs involving wetlands, such as the Louisiana coastal wetlands and Florida Everglades (Louisiana Coastal Wetlands Conservation and Restoration Task Force 2001, NRC 2003). This perspective helps to clarify the meaning of the term “restoration” as applied in the estuary. The NRC recently recommended that the Corps’ primary environmental mission be “to restore hydrologic and geomorphic processes in large river and coastal systems” (NRC 2004d). A realistic goal for the Columbia River estuary, proposed in response to the listing of salmonids under the Endangered Species Act, is “to conserve and restore estuary habitats to improve the viability of endangered and threatened salmonid populations” (Johnson et al. 2004). The maintenance of such habitats will depend on hydrologic and geomorphic processes that will continue to be affected by the FCRPS. Juvenile salmon pass through the Columbia River estuary on their seaward migration, using estuarine habitats for rearing, refuge and physiological transition from freshwater riverine habitats to oceanic conditions (See Chapter 3). Historically, Chinook salmon have exhibited numerous life-history types, each utilizing the estuary differently (Bottom et al. 2001, Burke 2004, Rich 1920). Ocean-type Chinook salmon (those that migrate as 0+ fry) have been shown to use estuaries most heavily (from one month to a year) by foraging along emergent marshes in tidal channels on decapods, insects, amphipods, and other crustacea (Healey 1982). Magnusson and Hilborn (2003) show Chinook salmon estuarine dependence to be much more profound than that of coho salmon, and degraded estuaries have lower Chinook salmon survival estimates than those with intact natural habitat. Because the estuary represents a critical stage in the life history of Pacific salmon, specifically Chinook salmon, efforts to protect intact habitat and restore degraded habitat are of paramount importance.
2.3
Evaluating Cumulative Ecosystem Response to Restoration Projects in the Columbia River Estuary, 2004
Flow changes have direct effects on salmon as well as indirect effects via habitat-forming processes, yet restoration efforts in the estuary do not presume a change in flow management as a tool to build habitat or otherwise support salmon in the estuary at this time. As summarized by Hendry et al. (2003), the physical effects of flow changes on salmonids throughout their life histories include 1) temporal and spatial changes to availability of flow for migration, 2) changes to water velocity, wetted area, and water depth, affecting the availability and distribution of habitats used during different life stages, 3) direct effects on channel morphology and resulting habitat changes, and 4) changes to sediment dynamics, including load, distribution, and deposition. In general, in Pacific Northwest salmon habitat restoration, restoring access to habitats is considered high priority because, although such restoration measures are local, their benefits are high in terms of gains in habitat area and smolt production (Beechie et al. 1996; Roni et al. 2002). Restoration of habitatforming processes by restoring connectivity is expected to bring the distribution of habitats in the estuary closer to its prehistoric condition despite continuing anthropogenic modifications. Proposed habitat restoration actions in the estuary consist primarily of dike and levee breaches and removals and associated re-grading and revegetation to restore emergent marsh, swamp, shallow water, and tidal channel habitats. Other projects include tide gate and culvert replacements and projects with revegetation objectives. Many of these proposed projects are intended to functionally restore the hydrological connectivity of habitats in the estuary and thus to increase the available habitat area for salmon. Salmon are adapted to the range of watershed conditions that existed prior to major anthropogenic modifications and restoring the processes that create such a range of habitats to the extent possible is generally considered an appropriate restoration goal (Beechie and Bolton 1999; Roni et al. 2002). In addition to the research and restoration efforts directed toward salmon population viability improvement, estuarine restoration efforts with broader habitat and ecosystem goals are also underway in the CRE. These efforts have focused research on other species such as waterfowl and the Columbia white-tailed deer (Lower Columbia River Estuary Program 1999). The mosaic of habitats required by these species is not always congruent with the habitat requirements of salmonids. For instance, managers using dikes and water-control structures to maintain freshwater wetland habitats on the CRE for waterfowl also study juvenile salmonid use of such habitats and passage through various control structures in order to help maximize benefits for threatened and endangered fishes (Baker and Miranda 2003). In general, the predicted direct effects of habitat restoration for salmonids in the estuary are to 1) increase the area and improve the quality of available shallow-water habitats such as marshes and swamps and associated small tidal channels, 2) improve the conditions of riverine forests and other riparian conditions of the estuary’s tributaries within the floodplain and of the tidal freshwater portion of the mainstem estuary, and 3) reconnect wetland habitats in the estuary. This chapter reviews approaches for evaluating the cumulative effects of the diverse restoration actions occurring throughout the 235-km Columbia River estuary, including indirect effects of significance to threatened salmon populations. To the extent that the evaluation of cumulative effects depends on project-specific evaluations, the information gained may also be able to contribute to the refinement and prioritization of restoration projects in the estuary in an adaptive management process (e.g., Steyer and Llewellyn 2000; Steyer et al. 003).
2.4
Evaluating Cumulative Ecosystem Response to Restoration Projects in the Columbia River Estuary, 2004
2.3 Complexity of the Study Area While monitoring programs often aim to measure simple attributes that are tightly linked to indicators of interest, the CRE evinces features of a “complex system” and characteristics of “biocomplexity” that must be considered in the development of an approach to cumulative effects evaluation. The study area is an open system consisting of the estuary, defined in space by the extent of tidal influence on the Columbia River and not including the plume. As a river-dominated estuary characterized by high-volume fluctuating inputs and outputs (e.g., water, sediment, salmon), it is inadvisable to view the CRE as an equilibrium system even over short timeframes. This estuary may be viewed as a “complex system” in that it is an open system that displays properties such as emergence, non-linear relationships, relationships with feedback loops, and nested complex adaptive systems. Estuaries display emergent properties such as the export of organic matter to offshore waters (Odum 1980) and the estuarine turbidity maxima (Simenstad et al. 1994.) Non-linear relationships in the estuary include the exponential relationship between river flow and sediment transport (Sherwood et al. 1990). As this study attempts to link the changing pattern and quality of habitats in the estuary with the changing viability of salmon populations, it deals with the topic of “biocomplexity.” This requires assessing how site-specific changes following restoration affect habitat availability and quality relative to multiple life-history strategies of salmon that exhibit differing spatial and temporal scaling. Since it is not possible to measure every feature of the study area, the challenge is to identify key measurable linkages between habitats and salmon that are sensitive to proposed restoration. Those emergent properties of the estuarine ecosystem that support salmon need to be monitored during recovery. Ecologists have been measuring the complexity of ecosystems since long before the terms “complex system” and “biocomplexity” came into wide use. The tools used to measure complexity tend to reduce measurements from a large number of features to a unitless index. For example, the Czekanowski index is used in plant community analysis to estimate similarity in species composition and cover (Bray and Curtis 1957, Thom et al. 2002). The index of biotic integrity (IBI) is used to assess the condition of aquatic resources (Karr 2002). More recently, fractal dimension has been used to characterize systems ranging from spatio-temporal plankton patterns (Medvinsky et al. 2001) to complex geological structures such as the features of river channels (Nestler and Sutton 2000).
2.4 What Are Cumulative Effects and How Do We Measure Them? In the National Environmental Policy Act (NEPA) of 1969, as amended (42 USC §§ 4321 et seq.), “cumulative effects” is defined as the impact on the environment which results from the incremental impact of the action when added to other past, present, and reasonably foreseeable future actions regardless of what agency (Federal or non-Federal) or person undertakes such other actions (40 CFR § 1508.7). Relative to this definition, the “action” under consideration in the Columbia River estuary is the set of restoration measures described earlier, which will be implemented by various entities at project locations dispersed throughout the floodplain over a likely temporal scale of multiple years or even decades. This 2.5
Evaluating Cumulative Ecosystem Response to Restoration Projects in the Columbia River Estuary, 2004
action is, of course, aimed at restoration, whereas cumulative effects analysis under NEPA is carried out to predict and evaluate the potential for negative environmental effects to derive from proposed projects. Despite the difference, we view the methods developed to facilitate cumulative effects analyses under NEPA as a resource for future analyses of large-scale restoration efforts; both efforts share the challenge of defining wide spatial and temporal boundaries, an emphasis on providing decision support for agencies implementing actions within complex social and ecological systems, and an ultimate interest in resource sustainability. Tools and methods utilized in cumulative effects analyses have included conceptual models, matrices, checklists, modeling, trends analysis, geographic information systems, carrying capacity analysis, and ecosystem analysis (Council on Environmental Quality (CEQ)1 1997). Although no framework for cumulative effects analysis has been universally adopted, practitioners have identified the ways that effects can accumulate: •
frequent and repetitive effects on an environmental system (time crowding)
•
delayed effects (time lags)
•
high spatial density of effects on an environmental system (space crowding)
•
effects occur away from the source (cross-boundary)
•
change in landscape pattern (e.g., fragmentation or the reverse)
•
effects arising from multiple sources or pathways (compounding effects)
•
secondary effects (indirect effects)
•
fundamental changes in system behavior or structure (triggers and thresholds) (CEQ 1997).
Cumulative effects analysis is complicated by the potential relationships that may be additive, synergistic, or countervailing and that may occur between effects themselves or between effects and the receiving biota. The relative importance of a cumulative effect may be thought of in terms of a) the difference from the historical or current baseline, b) progress toward restoration objectives for estuary habitats and salmon, or c) its relationship to a known environmental threshold beyond which significant change in ecological processes and functions will occur. As we monitor the cumulative effects of habitat restoration actions in the estuary over the coming years, we predict that other actions affecting the estuary subbasin, such as land conversion for suburban development, flow regulation, forestry, and agriculture, will continue to generate cumulative effects that may complicate the evaluation of restorative actions.
2.5 Cumulative Effects of Restoration in Land-Margin Ecosystems Although little information exists on assessing the cumulative effects of multiple estuarine restoration projects, monitoring plans have been developed for large-scale restoration programs. Examples exist where multiple projects are being implemented in land-margin ecosystems, for example the Florida
1
The Council on Environmental Quality was established by Congress, in the Executive Office of the President, by the National Environmental Policy Act of 1969 (NEPA).
2.6
Evaluating Cumulative Ecosystem Response to Restoration Projects in the Columbia River Estuary, 2004
Everglades and Louisiana coastal wetlands (Louisiana Coastal Wetlands Conservation and Restoration Task Force 2001, NRC 2003). In estuaries, which are characterized as essential transitional areas especially for anadromous fish, only recently have studies focused on landscape scale patterns and functional needs (Kneib 2003, Simenstad et al. 2000, Simenstad and Cordell 2000, Gray et al. 2002) and the overall benefit of multiple projects occurring in the same landscape remains unaddressed. Maintaining and/or restoring landscape connectivity in a system will often rely on multiple conservation and restoration projects, especially if degradation is widespread. Yet, assessing the success of even individual restoration projects has been cited as a continuing difficulty by many researchers (Neckles et al. 2002, Short et al. 2000), especially when restoration goals are not clearly defined at the outset. In several cases, multiple restoration projects have been undertaken within a particular estuarine system (e.g., Salmon River, Oregon, and Great Bay, New Hampshire); however, sites were evaluated independently for specific metrics such as fish and invertebrate abundance, fish diet, vegetation occurrence/abundance, and/or water quality. In these cases, evaluating the cumulative benefits of the restoration projects on the whole was beyond the scope of the given projects. Neckles et al. (2002) point out that the first step in region-wide monitoring, such as monitoring all of the local projects occurring throughout the Gulf of Maine, is to develop a protocol for use in the region. Regional performance curves can be developed when a protocol is applied consistently across many sites in order to assess restoration efforts. An example of such a protocol is the Estuarine Habitat Assessment Protocol, which is in wide use in Puget Sound (Simenstad et al. 1991). However, the implementation of standard protocols is hampered by the existence of multiple objectives and methods of performing restoration in a given region, with differing entities providing the financial and logistical support. Thus, monitoring is often piecemeal, carried out with differing protocols and for limited time spans, generally less than five years. Varying restoration goals within a given system increase the difficulty of detecting cumulative effects. Typical monitoring efforts are often employed to detect the proximal effects of restoration actions; these efforts may not capture the ultimate effects of restoration projects on the entire estuarine system. In contrast to more piecemeal monitoring efforts, an extensive investment has been made into developing monitoring systems and adaptive management processes for restoration in the Louisiana coastal wetlands and Florida Everglades. A statistical sampling design is at the heart of the approach for evaluating wetland restoration trajectories in Louisiana (Steyer et al. 2003). The design was developed in the context of an adaptive management program with established feedback loops (Steyer and Llewellyn 2000) and a Congressionally mandated program of regular public reporting (Louisiana Coastal Wetlands Conservation and Restoration Task Force 2001). Louisiana’s “Coast-Wide Reference Monitoring System” draws on EPA Environmental Monitoring and Assessment Program (EMAP) and hydrogeomorphic (HGM) approaches in creating relatively homogenous classes of coastal wetlands, selecting reference sites representing the range of ecological responses, and identifying reference standards (Steyer et al. 2003). The statistical design is derived from BACI (Underwood 1991; 1992; 1994) but uses multiple reference and project sites. An extensive effort was undertaken to evaluate the variability of the system and select the appropriate sample size. Sample
2.7
Evaluating Cumulative Ecosystem Response to Restoration Projects in the Columbia River Estuary, 2004
size was estimated by analyzing a coastal vegetation database representing 6,298 stations distributed along the coast using three approaches: central limit theorem, power analysis of water salinity data, and Monte-Carlo type resampling of existing vegetative composition data (Steyer et al. 2003). This resulted in the selection of 700 random reference sites from the larger database. The Florida Everglades restoration plan uses computer-based decision-support systems that incorporate mathematical models of the system at local and regional scales (NRC 2003). The hydrologic and water-quality modeling is comprehensive in contrast to the population dynamic model, which includes only a few species. NRC recommended improving the ecological components of these models (NRC 2003). The NRC recommended incorporating the following models to improve the ecological data used in assessments: the Marine Biological Laboratory General Ecosystem Model (MBL-GEM) to establish cause and effect relationships between stressors and tree growth (Rastetter et al. 1991), the spatially explicit ATLSS model (Curnutt et al. 2000), and linked hydrologic and habitat-suitability-index models (Tarboton et al. 2003). Although multiple restoration projects in single estuaries have not, to our knowledge, previously been evaluated in a cumulative manner, the application of a consistent protocol throughout a region appears to be an important step toward achieving this objective. The Florida Everglades and Louisiana coastal wetlands studies provide examples of statistical sampling designs and decision-support modeling systems covering large geographic scales.
2.6 Evaluating the Cumulative Effects of Restoration Efforts in Other Ecosystems In the absence of existing literature describing the evaluation of the cumulative effects of multiple ecological restoration projects in estuaries, it is appropriate to seek ideas, models, and methods that may have been applied in other fields or to other ecosystems. In this section, we examine cumulative effects literature on watersheds, fisheries, wetlands, forests, and ecotoxicology.
2.6.1 Watersheds Research into the cumulative effects of anthropogenic influences in watersheds on ecological processes, structures, and functions has been driven by the degradation of water quality, endangered species, and other losses. Detecting anthropogenic impacts on rivers has typically relied on measures of water chemistry and biotic indices, hydrologic/hydraulic methods, or physical habitat measures, but has more recently included landscape indicators (Gergel et al. 2002). Landscape indicators that have shown promise for detecting nonlinear relationships to aquatic system attributes include the width and connectivity of riparian buffers, percent impervious surface, and percent of agriculture and forest in a watershed (Gergel et al. 2002). The challenge for scientists is to elucidate such relationships between the landscape indicators, so they can be measured using spatial data and response variables of interest in the river-floodplain system. Another key study area of interest with respect to both degradation and restoration is identifying additional relationships where thresholds can be detected, i.e., the non-linear relationship between the landscape indicator “percent impervious surface” and changes in fish and invertebrate communities (Paul and Meyer 2001). Logistic regression models have been developed that classify benthic environmental
2.8
Evaluating Cumulative Ecosystem Response to Restoration Projects in the Columbia River Estuary, 2004
quality as a function of the sum of all human land uses and percent wetland area; high-low benthic community index as a function of percent riparian urban, riparian wetlands, and agriculture on steep slopes; and total number of bottom-dwelling benthic macroinvertebrates and fishes as a function of percent wetlands, riparian wetlands, and riparian agriculture (Hale et al. 2004). The distribution of freshwater fish in Pennsylvania has been predicted with average accuracy of 73% using five landscape variables linked to a geographic information system (GIS) (Argent et al. 2003). Decision support systems for resource management have been developed that link spatial data with hydrological and landscape ecological models in GIS (Aspinall and Pearson 2000). In evaluating the effects of watershed restoration, a focus on habitat-forming processes has become accepted as the approach to follow to avoid pitfalls such as performance measures that are suited to some but not all parts of a study area, the restoration of stable structures at the expense of the dynamic functions that maintain a mosaic of habitats, or the restoration of habitat for one species at the expense of another (Beechie et al. 1994; Beechie et al. 1996; Beechie and Bolton 1999; Reeves et al. 1991; Roni et al. 2002). This focus is particularly relevant to a spatially complex region such as the estuary and to spatially and temporally complex populations such as salmon. It shifts the focus of restoration objectives and prioritization to disruptions of processes such as sediment supply and stream shading, requiring an understanding of historical and current dynamics and the mechanisms by which they have been changed by land use (Beechie and Bolton 1999). This approach can also be applied to monitoring and evaluating the effects of restoration, by evaluating changes to land use and processes instead of or in addition to evaluating the conditions of habitats and biological indicators within the mosaic.
2.6.2 Fisheries Cumulative impacts on fisheries take many shapes: fishing pressure and associated hatchery practices, habitat degradation, climate change, introduction of invasive species, and anthropogenic chemical stressors/pollution, among others. As a common resource, fisheries are susceptible to more cumulative pressures than other resources because there is a distinct lack of ownership (Hardin 1968). Additionally, because fisheries are so widespread, existing in inland waters and the oceans, there are a large number of organizations and jurisdictions exercising control over fisheries management. While the factors mentioned above, especially fishing pressure and habitat degradation, each are manifested by cumulative impacts, collectively they combine to create multiplicative pressures on the resource. Jackson et al. (2001) wrote that human disturbance results in synergistic effects for fisheries, resulting in impacts where the sum of the whole is greater than the individual components (hypoxia, eutrophication, harvest, etc.). The results of these cumulative impacts have been the collapse, degradation, or depression of over 60% of the world’s fisheries (Garcia and Newton 1997). The cumulative impacts of fishing pressure on the world’s fisheries have been extensively documented, especially pertaining to overfishing and collapsed fisheries (Botsford et al. 1997, Coleman et al. 2004, Hilborn et al. 2004a, Hilborn et al. 2003, Jackson et al. 2001, as examples). Cumulative impacts of overfishing are manifested in population declines, changes in fish size for a given species, changes in catch composition, and lower catch per unit effort for fishermen. Cumulative impacts may extend beyond a target species to other species caught as by-catch or to other species with trophic linkages to the target species. Because many fish targeted for commercial purposes are long-lived and late maturing, the impacts of overfishing are especially profound; efforts made to reverse population declines may take 2.9
Evaluating Cumulative Ecosystem Response to Restoration Projects in the Columbia River Estuary, 2004
years to become effective (Botsford et al. 1997). According to Jackson et al. (2001), overfishing gives way to a number of other symptoms of human disturbance (e.g., eutrophication, disease outbreak, introduction of invasive species) because it initially disrupts the ecological balance. While the negative impacts of over-harvesting have been well documented and general consensus exists on causal factors, the management actions needed to reverse the downward trends are less clear (Hilborn et al. 2004a). Ecosystem-based management has gained credence in the scientific community because it takes into account more than just a single target species (Pikitch et al. 2004). However, the complexity of such management plans often precludes timely application. Another effort to recover fisheries is through the establishment of marine protected areas (MPAs). MPAs take the form of reserves or no-take zones and are seen as a way to protect habitat that supports fisheries. The extent of spill-over benefits to areas adjacent to MPAs is unclear (Roberts et al. 2001). It has been difficult to quantify the effects of no-take marine reserves on fish populations outside of reserves; however, a study of a reserve in the Philippines created in 1983 found that the indicators “biomass” and “catch” of coral reef fish were responsive (Russ et al. 2004). Short-term area closures are another management tool (Dinmore et al. 2003). Benthic organisms, as well as fish stocks, derive the benefits of relaxed pressure resulting from MPAs and area closures. While often not the target of harvest, benthic organisms may be the basis of the food web for pelagic and demersal fish species. Hilborn et al. (2004b) caution that marine reserves are not a panacea for fisheries management problems and must be considered to be one item in a toolbox for restoring productive fisheries and addressing cumulative impacts to fisheries. Ecosystem considerations, such as habitat condition, have been incorporated into fisheries management in recent years (Murawski 2000). Habitat degradation is of serious concern to fisheries managers, especially in inland waters and estuaries where fish and shallow water habitats are tightly linked and where development is threatening biological function of these areas (Aarts et al. 2004, Pess et al. 2003). However, habitat degradation is also of concern in marine fisheries, where trawling and dredging have led to decreased benthic productivity (Collie et al. 1997). Habitat destruction in marine fisheries has been considered collateral damage (Chuenpagdee et al. 2003), since the main stress is on the fishery itself, but fishing gear adversely impacts habitat as well. The cumulative impacts of habitat loss and degradation have resulted in diminished fisheries resources (Aarts et al. 2004, Rose 2000). Isolating the impacts of habitat destruction from harvest and other stressors is difficult, though it is likely a contributor (Rose 2000). In the case of Pacific salmon, for example, large-scale habitat destruction has resulted from forestry practices and burgeoning development, leading to declining stocks (Feist et al. 2003, Nehlsen et al. 1991). Thus, the cumulative impacts of unchecked growth and the resulting habitat loss have had profound effects on the fishery. The result of this decline has been an increased focus on watershed plans and restoration plans in salmon-bearing watersheds (Rieman et al. 2000, Wissmar and Beschta 1998). The combination of overfishing and habitat loss/degradation has weakened fisheries such that other anthropogenic and environmental factors have added to population declines. For example, urban and suburban development in estuarine landscapes has led to the increase in nutrient supply to estuaries and has resulted in eutrophication (Lee et al. 2004). Vitousek et al. (1997) show that increased nitrogen input, as a result of anthropogenic activities, has resulted in long-term declines in coastal and marine fisheries. Additionally, natural variation in recruitment (such as that which results from large-scale climate change 2.10
Evaluating Cumulative Ecosystem Response to Restoration Projects in the Columbia River Estuary, 2004
and/or more localized flux), may have more dramatic impacts when the integrity of a fishery is already compromised (Jurado-Molina and Livingston 2002). Evaluating the sum of impacts to fisheries is necessary to adequately manage stocks and maintain ecosystem balance.
2.6.3 Wetlands In wetlands, Gosselink and Lee (1989) outline a three-part approach for cumulative impact assessment and management consisting of goal-setting, planning, and assessment. This approach is applied to riparian forested wetlands in a case study with an objective to “improve ecological functions by enhancing the spatial pattern” (Gosselink et al. 1990). Gosselink and Lee (1989) define “landscape indices” as “simple, measurable properties that integrate ecological processes over large areas.” For example, the case study identifies phosphorus and nitrogen as indices and utilizes forest patch size, frequency distribution matrices, and charting the decrease in forested edge as means to integrate ecological processes (Gosselink et al. 1990). Techniques for cumulative impacts assessment reviewed by the authors include “checklists of characteristics or processes to be considered in the analysis; matrices of interactions among human activities and environmental conditions; nodal networks that depict likely impacts from disturbances; simulation models of ecosystems and responses to human activities” (Gosselink et al. 1990). Similiarly, the qualitative synoptic assessment used in permitting and development (Abbruzzese and Leibowitz 1997) links landscape indicators (e.g., agricultural area) to synoptic indices (typically mathematical functions) of values, functions, and effects that are of interest in specific cases (e.g., nonpoint source nitrate load) (Leibowitz et al. 1992). The method was designed to evaluate the cumulative effects of multiple wetland impacts in a landscape or to be applied to prioritize areas for restoration and protection (Leibowitz et al. 1992). It produces comparative rank data for large-scale (e.g. statewide) management analyses as opposed to a quantitative assessment (Leibowitz et al. 1992). Habitat models, some of which are semiquantitative, used in assessing potential impacts can also be used to predict or assess the function of wetland restoration sites (Orth 1993, Diefenderfer et al. 2005). Well-known examples include the hydrogeomorphic approach (HGM) and the Habitat Evaluation Procedure (HEP) (Brinson 1993, U.S. Fish and Wildlife Service 1980). Both methods index multiple features or functions. HEP assigns relative weights to the habitat quality and quantity provided to one or more selected species in a habitat suitability index (HSI). This index value is then multiplied by the geographical area of the habitat potentially used to calculate a weighted score in “habitat units” for the species-habitat subsystem. The HGM utilizes functional capacity indices for hydrogeomorphic and habitat-related functions and yields indices that can be used to evaluate wetland functions. It is not absolute but relative to regional reference sites and, like the HSI, is dimensionless. In comparison with the HSI models, which have a single-species focus, the HGM focuses on a suite of co-occurring species that inhabit a particular system.
2.6.4 Forests Traditionally, forest scientists were interested in the cumulative effects of harvesting on the sustained yield of timber. In the latter part of the 20th century, the effects of harvest on ecosystem processes, endangered species, ecological services, landscape pattern, and forest health also came under study. Such changes in research direction have occurred due to legislation such as NEPA and the Endangered Species
2.11
Evaluating Cumulative Ecosystem Response to Restoration Projects in the Columbia River Estuary, 2004
Act (ESA), large-scale disturbances such as pest infestations and wildfires, and increasing recognition of the roles played by late-successional and old-growth forests. Most recently, with the implementation of conservation plans for endangered species, measuring the effects of combined conservation and harvest activities on the recovery of endangered species has become a research interest. Implementation of the Northwest Forest Plan by the U.S. Departments of Agriculture and Interior (FEMAT 1993, USDA and USDI 1994a,b) led to the development of effectiveness monitoring strategies for the northern spotted owl (Strix occidentalis), marbled murrelet (Brachyramphus marmoratus), latesuccessional and old-growth forests, and aquatic and riparian ecosystems (Mulder et al. 1999). The forest and aquatic and riparian ecosystem plans are both responsive to the concept that the condition of landscape units is dynamic in response to disturbance processes and not all units can be expected to be in an optimal condition, thus recommending an analysis of frequency distributions to show increases in targeted forest types or habitat conditions (Naiman et al. 1992, Reeves et al. 1995, Hemstrom et al. 1998, Reeves et al. 2004).
2.6.5 Ecotoxicology The science of ecotoxicology – the study of harmful effects of chemicals upon ecosystems (Walker et al. 1996) – has developed systematic approaches to assess existing and potential impacts of stressors on ecosystems. Ecotoxicologists deal with “complex stressors” such as mixtures of chemicals or combinations of potential chemical and habitat factors, which can include complex arrays of habitat alterations independent of chemical stressors (Dorward-King et al. 2001). For the purpose of studying the cumulative effects of habitat alterations in the estuary, it will be useful to adopt the simplifying assumption that changes are occurring independent of chemical stressors. Dorward-King et al. (2001) suggest initiating an analysis with the simplest of models, assuming zero interaction between stressors, adding only “necessary and sufficient causes” to achieve an effective diagnosis with the minimum number of interactions. They also suggest that “in the absence of evidence concerning the nature of interactions among factors, it is generally appropriate to begin by assuming additive action for factors with same/similar modes of action and independent action for others.” Their description of the weight of evidence approach for inferring causation in ecoepidemiology is, in our view, also applicable to cumulative effects analysis on the Columbia estuary in that using multiple lines of evidence strengthens confidence in a verification approach to establishing cause and effect through the following means: •
strength of association
•
consistency of association
•
specificity of cause/effect
•
temporality
•
biological gradient
•
complete exposure pathway
•
plausibility
2.12
Evaluating Cumulative Ecosystem Response to Restoration Projects in the Columbia River Estuary, 2004
•
experimental studies
•
analogous cases
•
predictive performance
•
consistency of evidence
•
coherence of evidence.
Some relevant tools used in ecotoxicology were summarized at a Society of Environmental Toxicology and Risk Assessment Pellston workshop in September 1999 in the context of deducing the population-level consequences of individual-level effects (Baird et al. 2001; Maltby et al. 2001). These tools are directly applicable to and increasingly widely used in fisheries and wetlands science: 1) population viability measures such as time to extinction, minimum viable population, minimum area requirement, quasi-extinction, and critical abundance (both theoretical and model based); 2) bioenergetics and vital rates; 3) extrapolation from behavioral information and from biomarkers; and 4) a food web approach using stable isotope analysis (C isotopes for defining the source of food resources and N isotopes for defining trophic position).
2.6.6 Summary of Cumulative Effects Evaluation Methods in Related Disciplines The sciences contributing to the studies of watersheds, fisheries, wetlands, forests, and ecotoxicology all have evoked cumulative effects research and evaluation methods that are applicable to the study of habitat restoration in the CRE. These methods augment those discussed in earlier sections on land-margin ecosystems and general cumulative effects assessment. Major categories of these methods concern landscape indicators, ecosystem processes, and a weight-of-evidence approach. Use of landscape indicators to monitor changing watersheds, forests, or wetlands requires understanding the relationships between ecological processes and selected landscape indicators. Examples of landscape indicators of aquatic ecosystem attributes are discussed by Gergel et al. (2002) for watersheds, and Gosselink and Lee (1989) and Leibowitz et al. (1992) for wetlands. Cumulative effects assessment tools include 1) the frequency analysis of patch types for forested wetlands as discussed by Gosselink et al. (1990) and several other more recent authors in response to the Northwest Forest Plan (Section 2.6.4); and 2) the relationship modeling between aquatic ecosystem attributes and landscape indicators as discussed by Paul and Meyer (2001) and Hale et al. (2004) for watersheds and Gosselink et al. (1990) for forested wetlands. With sufficient data, which does not currently exist for the CRE, modeling has the potential to detect thresholds for change in system behavior or structure. Numerous potential habitat restoration projects throughout the 235 km CRE provide an opportunity to assess restoration at a landscape scale (effects of project arrangement and size), in relation to project and habitat types. Once an understanding of the relevant factors is developed through cumulative effects assessment, coordinated improvements in estuarine ecological function will transcend the outcomes of specific projects alone. Analyses similar to the case study by Gosselink et al. (1990), could be performed in the estuary, for example using patches of continuous tidal channels instead of forest patch size, and charting for increase in linear vegetated tidal channel edge (a key component of juvenile salmonid habitat) instead of decrease in forested edge. Specific features of landscape indices that would be useful in this study of the CRE include sensitivity to habitat restoration actions and correlation to salmon recovery. 2.13
Evaluating Cumulative Ecosystem Response to Restoration Projects in the Columbia River Estuary, 2004
In order to meet the objectives of this study, it will be necessary to take another step in the biological hierarchy beyond the relationships between landscape indices and ecosystem processes, that is, to measures of habitats that directly affect salmonid population viability. The Columbia River Estuary Conceptual Model (Chapter 4) helps to specify some of the relationships between ecosystem processes and salmonid production. The sciences of fisheries and ecotoxicology provide us with tools to make this connection, such as bioenergetics and stable isotopes for food web analysis (Baird et al. 2001; Maltby et al. 2001). Fisheries scientists have also documented synergisms between anthropogenic impacts on the environment that produce 1) direct effects on fish populations whether by detrimental mechanisms such as hypoxia (Jackson et al. 2001) or 2) augmentative effects such as marine protected areas or harvest restrictions (Russ et al. 2004, Dinmore et al. 2003). Similar challenges exist in the CRE, where any positive trends resulting from multiple restoration actions, whether additive or synergistic, will likely occur within a larger context of natural and anthropogenic ecosystem variability and thus be difficult to detect and source. The CRE environment is complex not only in ecological terms but also in the human landscape. Numerous researchers are collecting data on the estuary to meet various objectives and implementing measures that will affect the system at any given time. The weight-of-evidence approach favored in ecotoxicology (Section 2.6.5) provides a framework within which data from various lines of evidence can be integrated in one assessment. As typically used, a study is designed to provide sufficient data on various lines of evidence contributing to assessment endpoints, i.e., on whether an exposure pathway is completed resulting in detrimental effects on an ecological receptor. However, viewed broadly, the approach is flexible enough to accommodate various sources of data such as those currently being generated on the estuary and thus to augment data generated in a cumulative effects study to make conclusions more robust. This proposal will be discussed more fully in Section 2.8.1. First, we will explore suitable indicators of ecosystem processes, salmonid populations, and the estuarine landscape in the following section.
2.7 Indicators and Measurement Methods for the Cumulative Effects of Estuarine Habitat Restoration Indicators and measurable attributes of ecological change provide the most relevant information when they are tightly linked to the objectives of the restoration project (Thom and Wellman 1996). In the case of a cumulative effects assessment, indicators should therefore be linked to the predicted effects of the multiple restoration measures undertaken. Thus, for the CRE it is beneficial to first specify the predicted effects, and second describe suitable indicators of change and measurement methods.
2.7.1 Predicted Effects The goal of most restoration activities on the CRE is to repair habitat connectivity and function, and thereby allow fish to regain benefits that have been shown to accrue from estuarine rearing areas on the U.S. Pacific Coast (e.g., Reimers 1973; Healey 1980, Healey 1982; Levy and Northcote 1982, Levings et al. 1986; Levings et al. 1991, Levings 1994, Magnusson and Hilborn 2003). As discussed in Section 2.2 and further in Chapter 5, the site-specific actions of the majority of restoration projects being implemented on the CRE fall into two categories: hydrological reconnection and vegetation management. The hydrological reconnection projects are dike breaches and removals, tide gate and culvert removal and 2.14
Evaluating Cumulative Ecosystem Response to Restoration Projects in the Columbia River Estuary, 2004
replacement, and grading and channel excavation. Tidal inundation will be restored in an attempt to restore the habitats worst affected by the historical construction of dikes and levees on the CRE: forested wetlands and associated riparian conditions, and marshes and associated small tidal channels (Thomas 1983). In general, we predict an increase in the area, and improvement of the quality, of available shallow-water habitats and, at the landscape scale, the reconnection of these wetlands. To consolidate the predicted measurable effects of restoration projects in the CRE, we adapted a matrix from one prepared for the U.S. Forest Service (USFS) Pacific Yew Environmental Impact Statement (1993) (Table 2.1). As discussed in Sections 2.4 and 2.6, matrices are a commonly used method for determining cumulative effects (Council on Environmental Quality 1997). In its original form, the matrix was designed to compare the direct, indirect, and cumulative effects of a set of alternatives in the typical structure of an EIS. Here, it is altered for application to the potential for positive cumulative effects to result from multiple restoration actions in the CRE. Instead of evaluating a different proposed alternative in each row, the matrix lists a different restoration measure in each row. In this way, while it may be used to compare the effects of different restoration measures, it also becomes a tool to help analyze the sum of all potential cumulative effects including potential synergisms. This added level of analysis is important in the CRE because all of the restoration measures are being implemented, and in that sense they are not “alternatives.” As a further complication for the analysis, the measures are being implemented across wide spatial and temporal scales, often at multiple times and places. We have also added a column to the USFS matrix, to categorize the potential effects on salmonid fishes, using the categories of habitat assessment metrics proposed by Simenstad and Cordell (2000): “habitat opportunity,” “habitat capacity,” and “realized function.” Increased habitat opportunity and capacity may bring about increased “realized function,” or measurable benefit to fish populations. Thus these categories contribute to the framework for summing cumulative effects shown in Table 2.1.
2.15
Evaluating Cumulative Ecosystem Response to Restoration Projects in the Columbia River Estuary, 2004
Table 2.1. Restoration Measures and Potential Cumulative Effects. Typical restoration measures on the CRE may be categorized as hydrological reconnection, vegetation management, waste management, and/or land use change. Restoration Measure
Direct Effects
Indirect or Long-Term Effects
Dike Breach and Dike Removal
Tidal inundation, Fish access and usage (Williams and Zedler 1999), Land use (Williams & Orr 2002)
Tidegate and Culvert Installation and Replacement
Tidal inundation, Fish passage
Vertical accretion (Callaway 2001, Cornu 2005a, Frenkel & Morlan 1991), Plant community and detritus (Frenkel & Morlan 1991, Thom et al. 2002), Soils (Callaway 2001, Frenkel & Morlan 1991, Portnoy 1999), Channel morphology (Callaway 2001, Frenkel & Morlan 1991), Hydrodynamics (Williams & Orr 2002), Macroinvertebrate and fish community (Williams and Desmond 2001) Plant community and detritus (Warren et al. 2002), Soils, Hydrodynamics, Macroinvertebrate and fish community (Raposa 2002, Swamy et al. 2002)
Channel Excavation and Site Grading
Channel area, Tidal inundation, Fish access and usage (Miller & Simenstad 1997)
Channel morphology, Plant community and detritus (Craft et al. 2002, Simenstad et al. 1993), Soils (Craft et al. 2002)
Invasive Plant Species Removal
Cumulative Effects
Total wetted area and hydroperiod (Williams & Orr 2002), Fluxes (e.g., organic matter, nutrients, manmade chemicals) (San Francisco Estuary Project 2000), Food web, Channel allometry (Coats et al. 1995, Williams et al. 2002), Fish rearing and forage habitat mosaics (Williams and Desmond 2001)
Total wetted area and hydroperiod (Warren et al. 2002), Fluxes (e.g., organic matter, nutrients, manmade chemicals), (San Francisco Estuary Project 2000), Food web, Channel allometry (Coats et al. 1995), Fish rearing, forage and spawning habitat mosaics Total wetted area and hydroperiod (Williams & Orr 2002), Fluxes (e.g., organic matter, nutrients, manmade chemicals) (San Francisco Estuary Project 2000, Simenstad et al. 1993), Food web (Simenstad et al. 1993), Channel allometry (Coats et al. 1995, Williams et al. 2002), Fish rearing and forage habitat mosaics (Miller & Simenstad 1997) Organic matter flux, Food web
SalmonSpecific Effect* Habitat Opportunity Habitat Capacity Realized Function
Habitat Opportunity Habitat Capacity Realized Function Habitat Opportunity Habitat Capacity Realized Function
Reduced Colonization by the same or other species (Reeder Habitat competition and Hacker 2004) Capacity (Reeder and Realized Hacker 2004) Function Riparian or Bank Plant community (Josselyn & Buchholz 1984), Organic matter flux, Food web, Fish habitat area Habitat Wetland stabililization, Overhanging vegetation, Shade, Large woody (Miller & Simenstad 1997) Capacity Revegetation Competition with debris, Soils (Morgan & Short 2002) Realized invasives Function * “Habitat capacity,” “habitat opportunity,” and “realized function” are categories of habitat assessment metrics relevant to salmonid fishes. (Simenstad and Cordell 2000).
2.16
Evaluating Cumulative Ecosystem Response to Restoration Projects in the Columbia River Estuary, 2004
2.7.2 Indicators of Ecological Structure, Process, and Function Monitoring restoration and reference sites is crucial for assessing the effects of restoration measures on the CRE (Kentula et al. 1992, Thom 1997, Thom 2000). A substantial body of literature has been developed on the West Coast regarding the selection of appropriate minimum indicators for estuarine and wetland restoration monitoring (Simenstad et al. 1991, Kentula et al. 1992, Callaway et al. 2001, Rice et al. 2005). The essential features of a minimum set of indicators have also received a great deal of consideration (NRC 1992). In particular, the long time frames over which restored ecological systems develop necessitate limiting the number of metrics in favor of investment in long term monitoring in order to adequately capture change (Thom et al. 2002). However, to assess a system as complicated and datapoor as the CRE, the value of information gained from long-term monitoring of minimum indicators can be augmented by focused studies on fundamental ecological processes relevant to the predicted cumulative effects of restoration. Thus, the weight-of-evidence approach described in Section 2.8 proposes combining standardized monitoring of a small number of fundamental metrics at multiple project and reference sites throughout the CRE, with research to reduce uncertainties in our understanding of key estuarine processes on the Columbia River. Both endeavors can contribute to the cumulative effects assessment. The selection of minimum metrics for project monitoring, described in Chapter 5, relied primarily on four criteria: 1) metrics encompass controlling factors, structural factors, and functional factors (NRC 1992), 2) metrics directly correspond to commonly held goals among the restoration projects; 3) metrics are potentially applicable to all sites, with measurements that result in comparable datasets relevant to both present and future investigations; and 4) measurement methods must be feasible for the wide variety of organizations implementing restoration projects. These criteria will facilitate the development of a consistent database permitting estuary-wide analyses of restoration trajectories. While we are comfortable recommending a set of minimum indicators based on existing understanding of predicted system responses (Chapter 5), the development of “higher-order” indicators requires further research. Thus we consider the higher-order indicators under consideration in the following sections to be candidates, pending field research. The minimum indicators include four physical metrics (water elevation, water quality, landscape features, and bathymetry/topography), and metrics of the plant and fish communities. “Higher-order” indicators, as envisioned for this cumulative effects assessment, typically measure ecological processes fundamental to estuaries in general or landscape indicators that integrate processes. In some cases they can be assessed by further analyses of the collective minimum biological and physical indicators, while in others they require new data collection. Shallow water habitats in the CRE such as marshes, swamps, flats, and shallow channels combine to form a shifting mosaic of habitats (Sherwood et al. 1990, Thomas 1983) utilized by a wide variety of fish and wildlife (Beccasio et al. 1981) and plant species including some 165 vascular plants in the lower 64 rkm (Small et al. 1990, Thomas 1984). These shallow-water habitats perform a set of processes within the broader ecosystem. For example, marshes trap sediments, attenuate flooding events through temporary water storage, produce organic matter, and cycle nutrients (Mitsch and Gosselink 2000, Small et al. 1990). The rate and net effect of these processes can be quantified. Some of the anthropogenic drivers of changes to these processes, such as dams and diking, have been identified, although in most cases the net changes resulting from these drivers have not been quantified due to a lack of baseline information at the 2.17
Evaluating Cumulative Ecosystem Response to Restoration Projects in the Columbia River Estuary, 2004
time changes were initiated (Sherwood et al. 1990). Thus, measurements of these processes to document a baseline for the purpose of describing net changes resulting from restoration will generally be required. While some fundamental estuarine processes in portions of the CRE have been studied (Pruter and Alverson 1972, Small et al. 1990, Dyer and Orth 1994), to the best of our knowledge no published research has linked the restoration of hydrological processes and plant communities to effects on estuarine processes in the CRE, although fish and invertebrate surveys were reported associated with jetty breaching at Trestle Bay (rkm 11.3) (Hinton and Emmett 2000) and restoration monitoring is underway at various project sites (Appendix A). We would predict, for example, that an increase in tidal marsh area would result in increased marsh vegetation biomass and associated salmonid insectoid prey reaching the CRE, on the theory that, in general, the larger the proportion of wetlands in a system the greater the influence on the system through these processes. Likewise, increasing the opportunity for salmonids to use marsh habitat, would, we predict, increase realized functions such as growth for foraging fish. However, ecological processes vary at different scales, and the appropriate spatial scale for measurement may range from site specific to estuary wide. Below we describe functions and processes that would predictably be affected by restoration of shallow water habitats in the CRE based on our understanding of ecological processes fundamental to estuaries in general. We specifically discuss these functions and processes in light of potentially employing them in evaluating ecosystem-scale cumulative effects, and we identify appropriate measurement methods. Where possible, we identify specific links between ecological processes and salmon and available means of detecting the effects of habitat degradation or restoration on associated fish.
2.7.3 Organic Matter Production A key function of Pacific Northwest tidal wetlands is the production of organic matter (Eilers 1975, Jefferson 1975, Levings and Moody 1976). Data from the lower portion of the CRE indicate that marsh and swamp productivity rates are substantial, although total productivity of these systems has been reduced by the reduction in habitat area (Small et al. 1990). While the relative productivities of various plant types in Pacific Northwest systems are highly variable, in the CRE, marsh productivity is second only to phytoplankton (Thom 1987). As a whole, Columbia River discharge contains substantially lower carbon concentrations (total, dissolved, and particulate) than the Mississippi (Dahm et al. 1981). Maximum vascular plant above-ground biomass is, however, comparable to that of marshes in the Fraser River estuary in British Columbia (Kistritz et al. 1983, Small et al. 1990.) The fate of organic matter produced in marshes and swamps includes respiratory losses, herbivory, burial in the soil, and export to other locations in the system. Burial of organic matter in the soil contributes to both the overall nutrient cycling and maintenance of productivity of the marsh and accretion of the marsh. It is the export process that provides the primary link from the marshes and swamps to the broader aquatic ecosystem (Kistritz et al. 1983). Particulate and dissolved organic matter moves from the sites of production to the flats, channels, and deeper areas of the CRE. Particulate organic carbon from the Columbia River is dominated by gymnosperm woody and non-woody angiosperm tissues (Hedges and Mann 1979). In terms of evaluating cumulative effects, key factors to consider include area of marsh or swamp restored, rate of organic matter production, rate and pattern of development of the systems from present
2.18
Evaluating Cumulative Ecosystem Response to Restoration Projects in the Columbia River Estuary, 2004
state to restored state, and the exchange rate and capacity between these restored systems and the CRE. We would predict that increases in all of these factors would result in an increase in the contribution of marsh macrodetritus and other forms of marsh-derived organic matter to the broader ecosystem. The relationships for these processes can be characterized as follows: GAPP – R = NAPP NAPP – (H + B) = NAPPE NAPP x A = TotNAPP TotNAPP – (H + B) = TotNAPPE TotNAPPE = ƒ(AT, F, S) where, GAPP = Gross aerial primary production (kg carbon m-2 y-1) R = Respiratory losses (kg carbon m-2 y-1) NAPP = Net aerial primary production (kg carbon m-2 y-1) H = Herbivory rate (kg carbon m-2 y-1) B = Burial rate at production site (kg carbon m-2 y-1) NAPPE = Amount of NAPP that is exported offsite (kg carbon m-2 y-1) A = Area (m2) of the site TotNAPP = Total NAPP for a site (kg carbon y-1) TotNAPPE = Amount of TotNAPP exported offsite (kg carbon y-1) AT = Area of tidal inundation on the site F = Net flow rate offsite (m3 d-1) S = Season. Based on the above simplified relationships, increasing macrodetritus flux into the broader estuarine system would require removing impediments to the flow of materials, enhancing tidal inundation of a site, increasing macrodetritus production rate, reducing respiratory losses, herbivory, and burial. Increasing macrodetritus input is not straightforward. For example, in order to make the site a net exporter of materials, outflows must exceed inflows on average. Since most sites available for restoration may be slight net importers of material because of weak outflow rates, the hydrodynamics of a site and the type and location of restoration actions must be carefully considered. Even marshes that were productive historically may not attain the same level of productivity through restoration, because of changes to ecological processes that may not be reengineered. Sites that are more open may be more susceptible to erosion, and thus would be difficult to maintain.
2.7.4 Nutrient Cycling Nutrient cycling refers to the processes that involve the uptake of inorganic nutrients in the formation of organic matter, and the process involved in degradation of organic matter back into inorganic nutrients 2.19
Evaluating Cumulative Ecosystem Response to Restoration Projects in the Columbia River Estuary, 2004
and other compounds. Nutrient and energy budgets and mass-balance approaches are tools for quantifying net fluxes between compartments, and continuous measurements may be necessary to adequately capture the rapidly changing estuarine environment (Kremer et al. 2000). Nutrient cycling occurs in essentially all aquatic habitats, but wetlands are known to cycle massive amounts of nutrients relative to unvegetated habitats (Mitsch and Gosselink 2000). In general, the plants in the system utilize nutrients to support their growth (i.e., NAPP). Nutrients are remineralized during the breakdown of marsh material. Because nutrients can be in excess, and thus create undesirable (eutrophic) conditions in aquatic systems, wetlands can serve to remove some portion of these excess nutrients and convert the nutrients to organic matter. This matter is then buried, consumed, or exported. In theory, the loss of massive amounts of wetlands in a system could result in a loss in the capacity of that system to take up nutrients.
Nutrient cycling can be characterized as follows: N = NI – (NU + NE) N x A = TotN TotN – (B) = TotNE TotNE = ƒ(NAPP, AT, F, S) where, N = Nutrients retained (g m-2) NI = Nutrients imported (g m-2) NU = Nutrients taken up in the site (g m-2) NE = Nutrients exported (g m-2) TotN = Total nutrients remaining in the site (g). Again, the cumulative effects of increasing nutrient storage would be dictated by the size of the site, plant uptake, season, and export processes. Export of nutrients to deeper areas offsite via export of macrodetritus would mean that nutrient processing and remineralization would be moved from the wetland to the deep areas. Whether this results in a net loss of nutrients from the broader estuary or not is an important question. Large sites, where inputs exceed export, would tend to remove nutrients from the broader system.
2.7.5 Sedimentation Estuaries are natural zones of sedimentation because of reduced water flow rates induced by the flat topography and the influence of tides, although rates can be highly variable (Pasternack and Brush 1998). In addition, aquatic macrophytes can cause flows to be even further reduced, encouraging settlement of the finest particles of suspended sediment. Tidal wetlands and seagrasses trap sediment along with particulate organic matter and can also release them when aboveground biomass is destroyed (Naiman and Sibert 1978, Lucotte and D’Anglejan 1986). Through this process, these habitats increase organic matter content, build (accrete) upward, and prograde outward (Callaway 2001; Reed 2000). Accretion and progradation ultimately result in expansion of tidal wetlands and uplands. West Coast estuaries have high sedimentation rates and tidal fluctuations, leading to extensive areas of mud flats (Emmett et al. 2000). By
2.20
Evaluating Cumulative Ecosystem Response to Restoration Projects in the Columbia River Estuary, 2004
removing suspended sediments, these habitats contribute to increasing the clarity of the water, and thus improve conditions for both water column and benthic primary production. The amount of sediment retained in the estuary through these processes can be characterized as follows: S = SI – SE S x A = TotS TotS = ƒ(V, AT, F, S) where, S = Amount of sediment retained (kg m-2 y-1) SI = Amount of sediment imported (kg m-2 y-1) SE = Amount of sediment exported (kg m-2 y-1) TotS = Amount of sediment retained in the site (kg y-1) V = Standing stock of macrophytic vegetation (kg). Improving sediment retention follows the same principles that affect organic matter flux rate. The size of the site, hydrodynamics, and vegetation mass all increase the potential retention of sediments.
2.7.6 Biodiversity Focusing on diversity brings insight to the stability and resilience of systems such as estuaries in which species are adapted to live in relatively dynamic hydrological conditions and water chemistries. In a recent review of a long-standing question in ecology, McCann (2000) concluded that “ecosystem stability depends on the ability for communities to contain species, or functional groups, that are capable of differential response.” The habitats in the CRE are subjected to wide-ranging variations in river flow and tidal inundation (Sherwood et al. 1990). Present conditions of flow regulation have probably resulted in a more stable condition. Since differences between coexisting species permit the use of different niches in an ecosystem (Purvis and Hector, 2000), prior to flow regulation diversity may have been higher or more variable. Biodiversity can also be affected by invasive species, a serious threat in West Coast estuaries (Emmett et al. 2000). Non-native species can occupy niches of native species, predate on natives, and reduce the overall suitability of that area to other native species or negatively affect processes in the area. Ecosystem processes are responsive to plant diversity. For example, Hooper and Vitousek (1997) showed that variation in production and nitrogen dynamics was explained by differences in plant composition. Light penetration, plant total nitrogen, plant percent nitrogen, and plant productivity are also explained by functional composition and functional diversity (Tilman et al. 1997). Temporal variability in ecological processes is likely reduced by large numbers of species, but the ability to scale up experimental results to landscape levels and to generalize results for ecosystem types remains in question (Loreau et al. 2001). To use biodiversity as an indicator, the relationships to ecological processes and disturbance in a region must be well-understood.
2.21
Evaluating Cumulative Ecosystem Response to Restoration Projects in the Columbia River Estuary, 2004
One of the most important relationships known is that biodiversity increases with size of the area, limited by the number of species in the local species pool that are adapted to utilize the area (MacArthur and Wilson 1963). Biodiversity is driven by the following main factors: B = ƒ(A, H, D, I) where, B = number of species in an area A = area H = number of different habitat types D = disturbance levels I = invasive species.
The natural (i.e., unaltered) marshes and swamps in the estuary appear to contain a large number of plant species (Thomas 1984, Elliot 2004). With the massive loss of area recorded for marshes and swamps, it is possible that restoration of significant areas would result in an increase in the total estuarine biodiversity or an increase in the spatial extent of some species. There are many unknowns associated with this assumption including the rate of recovery of restored systems, the availability of species to colonize the restored areas, the distribution of invasive exotics, and the overall effect on the food web, sediment trapping, and nutrient dynamics of the ecosystem.
2.7.7 Habitat Opportunity and Allometry The most dominant historical change to habitat in the estuary that is not hydrosystem-related is the installation of dikes, tide gates, and other barriers to fish passage. In some cases, such barriers significantly altered habitats on both sides, in addition to preventing passage (Simenstad and Feist 1996; Hood 2004). It is expected, therefore, that habitat restoration actions in the estuary will improve habitat opportunity for listed salmonids. More specifically, the area of estuarine habitat currently accessible within a given geographic area is expected to increase toward the area of estuarine habitat that was historically accessible. Additionally, the connectivity of habitats provides multiple opportunities for rearing during emigration downstream. Furthermore, the length of tidal channel edge that is available to listed salmonids is expected to increase toward pre-settlement levels. However, these length and area values vary temporally with water level in an estuary, which in turn varies with flow in the regulated Columbia River. “Habitat opportunity” or available habitat for endangered salmon populations can be described using indicators of hydraulic geometry. At this time, an accepted method for measuring these important indicators in the Columbia River estuary does not exist. Key hydraulic geometry indicators include the length of tidal channel edge, density of tidal channels, sinuosity of tidal channels, and tidal channel surface area. These indicators can be measured in the field or by applying analytical methods to remotely sensed data using geographic information systems for the purpose of extracting measures (e.g., Desmond et al. 2000). Coats et al. (1995) and Williams et al. (2002) identified bifurcation ratios, channel order, and 2.22
Evaluating Cumulative Ecosystem Response to Restoration Projects in the Columbia River Estuary, 2004
other variables to monitor regarding tidal channels. The characteristic hydraulic geometry is variable throughout the estuary; for example, on the fringes of the lower estuary marshes, flats and swamps naturally predominated, while in the tidal freshwater or upper portion of the estuary, riverine systems are more characteristic. Habitat opportunity depends on several variables, for example passage barriers and tidal channel edge, density, and sinuosity. Measuring the area of habitat restored, if it is defined by wetted area, depends on temporal scale or the period of year in which habitat is available. Data sources include diking district records; for example, “diked area,” “tidal area,” and “nontidal area” classes can be calculated and subjected to change analysis. Habitat availability is associated with the floodplain topography and inundation regime, which in turn are associated with habitat conditions and hydrodynamics indicators including water velocity and geomorphic features such as the total edge and penetration of tidal channels (Simenstad and Cordell 2000). Finally, these physical parameters of hydraulic geometry have been correlated with ecological processes in studies of allometry (Hood 2002). Hood showed a linear relationship between area of slough and size of tidal channel in another Pacific Northwest estuary.
2.7.8 Salmon Habitat Usage and the Food Web Although salmon are the target of much of the restoration activity in the estuary, their population abundances show large interannual variability and therefore require long-term monitoring to detect a response to restoration (Bisson et al. 1992; Reeves et al. 1997; Roni et al. 2002; See Chapter 3). Additionally, as highly motile fish, salmon move from habitat to habitat rapidly and make use of numerous habitat types. Presence alone does not indicate that salmon are deriving an advantage (energetic or otherwise) from a particular habitat. Mark-recapture studies can be used to determine fish habitat usage, residency, growth, survival, and movement (Guy et al. 1996; See Chapter 3). Fish can be marked with dye, external tags, fin clips, or pigment injected into fins. Because the recapture rate of highly motile fish, such as salmon, is quite low, mark-recapture studies necessitate the marking of thousands of fish in hopes of recapturing a few. In an open system, such as the Columbia River estuary, recapture sites need to be widespread to account for fish movement. These studies tend to be logistically difficult, intensive efforts performed over a limited spatial scale but they can provide meaningful data regarding fish behavior, movement, and habitat usage. The advent of newer technology, such as coded wire tags, passive integrated transponder (PIT) tags, and radio and acoustic tags has allowed for more effective tagging and improved results (Guy et al. 1996). Coded wire and PIT tags allow for the marking of numerous fish very efficiently (Ledgerwood et al. 2004). They have been used increasingly to estimate migration rates, mortality, and survival; however, they do not allow for the detection of small-scale movement patterns in an open system. Acoustic tags allow for an archival record of a fish’s position through time (Ehrenberg and Steig 2003). Specific habitat usage and movement patterns can be detected, but the tags are expensive, have limited battery life, and are cumbersome, making deployment in small fish, such as sub-yearling salmon, difficult. Acoustic tags allow for an understanding of residency and may be of increasing use as the technology develops. Currently, a large-scale juvenile Chinook salmon tagging program is underway in the Columbia River. In all cases, substantial numbers of fish must be tagged before inferences can be made regarding their position and behavior.
2.23
Evaluating Cumulative Ecosystem Response to Restoration Projects in the Columbia River Estuary, 2004
Collecting fish that have been using a known area (e.g., collecting fish from a marsh channel on a falling tide by fyke net or by using enclosure nets) and analyzing diet can provide some indication of the benefit a fish is deriving from a given habitat. When samples for prey availability (benthic cores, plankton or neuston tows, etc.) are collected concurrently, food web structure can be described; additionally habitat structure and occurrence of prey resources can be related (Hampel et al. 2003). Foodweb linkages can provide some indication of whether or not a restoration site has reached a functional level. A bioenergetics approach to evaluating salmonid success in restored habitats may provide some indication of how, cumulatively, projects are impacting salmon. However, there are limitations to bioenergetics modeling, based on the fact that model elements are difficult to obtain and models are inherently problematic in complex systems. The parameters of any model would need to be calibrated to the unique conditions in the lower Columbia River. Bioenergetics models are mass balance equations often used to predict growth and/or the consumption necessary to achieve an observed growth (Hanson et al. 1997). The crux of the model can be summed up in a simple equation: C=G+M+W where G = growth (both somatic and gonadal), M = metabolism (including activity costs and specific dynamic action), W = waste (scaled from consumption), and C = the consumption necessary to satisfy the observed growth plus the other costs (Beauchamp 1999, Kitchell et al. 1977). The model can be reversed to solve for growth, if there is a known consumption rate. Since metabolism, and thus consumption, is highly dependent upon thermal experience, water temperatures are used to determine costs and growth, with growth only being attainable once costs have been met. Additionally, it’s important to note that both maximum consumption (Cmax) and metabolism (M) are functions of body mass in addition to temperature. The model is generally used to model growth, where growth is driven by consumption. Therefore, accurate records of fish consumption (diet) and the caloric content of prey items are needed for the best results. The model can account for both somatic and gonadal growth; however, in the case of juvenile fish, gonadal growth is not applicable. Because growth is modeled daily in the model, seasonal effects (e.g., change in temperature), which can be very strong, are eliminated (although data points should capture both periods of rapid and slow growth). However, because estuarine rearing juvenile salmon are thought to experience such rapid growth, the parameters in the model for metabolic costs need to be evaluated. Additionally, rapid changes in osmoregulation may result in changing metabolic rates. Stewart and Ibarra (1991) created a model for juvenile salmon in the Great Lakes that could be a starting point for any bioenergetics work conducted in the estuary; however the only way to ensure that the parameters are
2.24
Evaluating Cumulative Ecosystem Response to Restoration Projects in the Columbia River Estuary, 2004
similar to those experienced by outmigrating salmonids in the Columbia River is to validate the measurements in laboratory studies. Several bioenergetics studies with salmon or in marsh habitats exist. Madon et al. (2001) used the model to determine the benefits of salt marsh access for foraging killifish in California estuaries. Gray (unpublished) used a bioenergetics approach with juvenile salmonids to evaluate restoration success at several sites in the Salmon River, Oregon. Additionally, Peterson and Kitchell (2001) used a bioenergetics approach to look at climate change and the impact of predation rates on juvenile salmon in the Columbia River. In both the Salmon River and Southern California estuaries, the model has been used to determine the functional success of restoration sites. Given accurate growth and consumption measurements, as well as strong parameter calibration, the bioenergetics approach provides for a relatively strong detection of realized function. It should be noted that this approach is highly site specific and restoration projects are likely to achieve different success scenarios. Given that true consumption rates are difficult to obtain, especially in an estuary, the model could result in skewed results, especially due to propagation error, if comprehensive data are not applied. However, components of the model, when taken independently, may provide data adequate for assessing realized function. For example, given recent advances in acoustic technologies, it may be possible to track uniquely identified fish across a landscape for a period of time. By capturing these fish, diet analysis would provide a description of the prey items they obtained while in that habitat. Growth estimates (either with in situ measurements or by otolith studies) could also be obtained and could be compared to fish at other sites, both restored and reference (Miller and Simenstad 1997). Additional sampling to determine the capacity of restored systems may further enhance the ability to make inferences about cumulative benefits. Otoliths and scales can be used to determine residence time in a given habitat. The microstructure of otoliths (sagittae) is examined for chemical and physical signatures. Saline water leaves a particular signal (Sr) on the scale or otolith and back-calculating daily growth rings can provide an estimate of the time the fish spent while outmigrating. The growth rate of an individual can also be calculated in this manner. Secor et al. (1995) used otolith microchemistry (Sr:Ca ratios) to determine migratory schedules and habitat usage by striped bass. Due to the differing water chemistry of riverine and marine waters, it may be possible to detect residence time in specific habitats, especially those with varying salinity and temperature. Life history patterns may be elucidated (time in river vs. estuary, ocean) from adult fish using microchemistry as well, though annual growth rings may compress daily rings at older life stages, making discrimination difficult (Secor et al. 1995). In highly dynamic environments, small-scale movement patterns between environments of one salinity and another (5 ppt to 10 ppt) are unlikely to be captured on the otolith record; vertical stratification in an environment may also impede Sr marks on otoliths. The food web includes all the species that produce and consume organic matter in the system and the linkages between these species. The food web for the tidal saltwater portion of the CRE has been diagramed (Weitkamp 1994) and a shift from marsh macrodetrital production to microdetritus favoring zooplankton production over benthic production has been proposed (Simenstad, C. pers. comm.). Additionally, flow regulation may have created habitats and thermal regimes advantageous to non-native
2.25
Evaluating Cumulative Ecosystem Response to Restoration Projects in the Columbia River Estuary, 2004
species, such as American shad (Alosa sapidissima), which have subsequently altered food web dynamics. Food web analysis incorporates the exchange of matter, and more importantly, energy within a system. Removal of a species in the food web can result in a catastrophic breakdown in the food web, or can be of little consequence. The degree of impact depends on the ability of the web to compensate through redundancy and recovery. Removal or reduction in the contribution of a primary producer can shift the food web such that certain species are lost and other species are favored. Finally, removal of predators (e.g., through overfishing) can have significant effects on lower trophic levels. Focusing attention on the cumulative effects of restoration aimed at shifting the food base back toward historical conditions should be evaluated, although the effort required to eradicate established invasive species would likely be extensive. Food web structure can be assessed using stable isotopes to ascertain signatures of various components. Weinstein et al. (2000) used isotopes in determining trophic pathways of bay anchovy and white perch in Delaware Bay. Isotopic signatures were a function of location within the bay and possibly an indicator of marsh restoration trajectory in restoring marshes. Kwak and Zedler (1997) used isotopes to describe trophic linkages between salt marsh and channel habitats and to determine sources of primary production in a California estuary. Stable isotope analysis (C, N, and S) is being used in current NOAA studies to provide a diagnostic approach to foodweb structure in the estuary and has the potential to show linkages and possible competitive overlaps between species. However, because of the large size of the estuary relative to the area proposed for restoration, it is unlikely that such a tool would detect the cumulative impacts of restoration at an estuary-wide scale. Isotope analysis would however be likely to indicate site-specific changes in trophic dynamics. Combining a number of tools is the most likely approach to successfully assessing use of habitats by juvenile salmon and evaluating any benefit that may be derived from these habitats. A combination of mark-recapture studies, diet analysis, and growth rate may provide an indication of the success of restoration sites as salmon habitat. By assessing juvenile mortality rates, it may be possible to determine if increased habitat availability is having a positive effect on juveniles rearing in the estuary.
2.8 Synthesis and Proposed Approach This review has summarized analytical approaches from a variety of disciplines as well as indicators of fundamental estuarine processes that are applicable to the analysis of the cumulative effects of multiple restoration projects in the Columbia River estuary. Elements that may be derived from this review and applied to generating a simple conceptual model for the assessment of cumulative effects include simplifying assumptions such as 1) assume affects are additive until shown otherwise, and 2) assume that pollution or other habitat degradation is not a countervailing factor (Section 2.6.5). Below, we propose an approach and key assessment tools for implementation.
2.8.1 Proposed Weight-of-Evidence Evaluation Approach A weight of evidence approach analogous to that used in ecotoxicology and risk assessment (Section 2.6.5), while not unequivocally establishing causation, will at a minimum allow the region to describe trends in the estuary’s habitats, processes, and fish as restoration advances throughout the
2.26
Evaluating Cumulative Ecosystem Response to Restoration Projects in the Columbia River Estuary, 2004
estuary. At the same time, such an approach will bound the risks that a) these trends are not caused by restoration, and b) confounding factors (such as increasing urbanization, climate change, or disturbance) are disrupting the analysis. Many existing research projects in the estuary (summarized in Johnson et al. 2004) can contribute information to the weight of evidence analysis in addition to the cumulative effects research project itself. Based on this literature review, four lines of evidence appear to be the most applicable to cumulative effects evaluation in the estuary: 1) statistically based estuary-wide sampling for minimum structural and functional (process) indicators at project and reference sites (Section 2.7.2 and Chapter 5), 2) spatial data processed in GIS including changes in land use (impervious surface, agriculture, etc.) and hydrological information (bathymetry, topography, water elevation) to form a multi-layer GIS model system (Section 2.5, 2.6, and 2.7.8), 3) focused research into data gaps to characterize appropriate “higher-order” indicators of fundamental processes in the system, such as organic matter export and the relationships between elevation and vegetation (Section 2.7.3-2.7.7), and 4) research into fish via some mark/recapture technology for presence/absence, source, residence time, and a growth module from the bioenergetics model (Section 2.7.9). It is also expected that over time numerical models of salmon population viability, estuarine and oceanic productivity, and hydrology will provide improved estimates that can be employed in analyses of the cumulative effects of estuarine restoration. Although it is clear that each of these lines of evidence can contribute to the evaluation of trajectories of development in the estuary, significant uncertainties remain and therefore we do not recommend strict numerical weighting of the lines of evidence. As research results from this and other projects accumulate, it is anticipated that uncertainties will be reduced and it may become possible to refine the weight of evidence system. Until that time, however, each line of evidence must be developed and evaluated independently and the results presented as four cases describing the status and trends of estuary attributes.
2.8.2 Key Assessment Tools for a Weight-of-Evidence Approach We have paraphrased the definitions of cumulative impacts and cumulative effects of Leibowitz et al. (1992) as follows: •
Cumulative restoration impacts are the net sum of all changes in selected habitat metrics of all restoration projects occurring over time and space, including those in the foreseeable future of the development of these projects.
•
Cumulative restoration effects are the net change in ecosystem-wide metrics and ecosystem state resulting from cumulative restoration impacts.
Viewing the proposed weight-of-evidence approach through this lens, it is clear that while the first line of evidence documents cumulative restoration impacts, the second and third contribute to elucidating cumulative restoration effects. This is a simplified view, however, in that the data collected in support of the first line of evidence can be used for analyses within the second and third. Finally, the fourth line of evidence concerns establishing levels of predictability in salmon-habitat relationships in the estuary.
2.27
Evaluating Cumulative Ecosystem Response to Restoration Projects in the Columbia River Estuary, 2004
The objectives of the first line of evidence, statistically based estuary-wide sampling for minimum structural and functional (process) indicators at project and reference sites, are to a) permit estuary-wide analyses of trends in the minimum indicators, b) provide the necessary baseline and trend data on reference sites for project-specific evaluations, and c) provide the basis of an analysis of variability in the minimum indicators throughout the estuary in order to refine future sampling plans (See Chapter 5). When combined with the data generated on fundamental processes via the third line of evidence, the systematic evaluation of projects throughout the estuary should help to answer key questions that will inform the process of adaptive management: 1) the comparative effect of large versus small habitat restoration projects (scaling, allometry); 2) the comparative effect of restoration of various habitat types (brackish and freshwater marshes and swamps including tidal channels); and 3) the comparative effect of location of restoration project (distance upriver, distance up tributary). The objective of the second line of evidence, spatial data processed in GIS, is to provide information on available wetted area and the presence of each endangered stock in each reach over the course of the year, so that trends associated with recovery can be assessed. Today, there is not enough information about fish and habitat available to populate such layers; however, it should be an objective because it provides information critical to a) flow management, b) prioritization of restoration sites, and c) the evaluation of the effectiveness of restoration. The most relevant work to date documents the availability of shallow water habitat area between rkm-50 and rkm-90 from 1974 to 1998 (Kukulka and Jay 2003a, b). However, the real-time analysis of such information with respect to the timing of migrations of endangered stocks has not yet become available. With respect to prioritization, for example, if such a system shows that endangered stocks are present in a certain reach at a time when little wetted area is available, then restoring habitats in this reach at sites that will be wetted during this timeframe would be a high priority. With respect to flow management, if endangered stocks are present and little wetted area is available, consideration may be made for this in dam operations. The cumulative effects of restoration actions can be evaluated with respect to the change in available habitat for endangered stocks in specific reaches. Once information like this is available, the potential effects of different flow regimes can be accurately predicted in terms of increased and decreased habitat opportunity by stock and reach, and trade-offs could be more accurately negotiated. The third and fourth lines of evidence help to reduce uncertainties in our understanding of fundamental ecological processes in the estuary, including species-habitat relationships. In so doing, they improve our ability to quantify the effects that restoration projects have on fundamental estuarine processes and salmon populations. 2.8.2.1
Metrics of Cumulative Effects
Based on this literature review, it is possible that cumulative effects can be expressed and measured through one of the candidate “higher-order” metrics of cumulative effects in Table 2.2. These warrant evaluation through systematic data collection and analysis. Much of the evaluation of higher-order metrics may consist of conducting additional analyses on data collected on minimum indicators at multiple restoration project sites (Table 2.2 and Chapter 5) to meet the requirements of the first line of evidence; only a small proportion of the higher-order metrics require additional data collection in the field.
2.28
Evaluating Cumulative Ecosystem Response to Restoration Projects in the Columbia River Estuary, 2004
Table 2.2. Minimum and Higher Order Monitoring Metrics Minimum Project-Specific Monitoring Metrics (See Chapter 5) Hydrology (Water elevation) Water Quality (Temperature, Salinity, Dissolved Oxygen) Bathymetry and Topography Landscape Features Vegetation Changes Resulting from Tidal Reconnection Success Rate of Vegetation Plantings
Candidate “Higher Order” Metrics Hydraulic geometry relationships Hydrological and flood storage modeling Correspondence between plant community and elevation Sedimentation and accretion Productivity of swamp and marsh macrophytes Organic matter export and fate Species-area curves Nutrient cycling Salmonid growth and residence time Salmonid prey Species-area curves
Fish Temporal Presence, Size/age-structure, and Species Composition
2.8.2.2 Methods for Synthesizing Information Available methods for synthesizing information on the four lines of evidence include spatial, field monitoring, and modeling tools. 2.8.2.2.1 Spatial Methods Habitat opportunity may be measured in terms of wetted area using a GIS platform and existing public information on water elevation, bathymetry, and topography. If available digital elevation models lack sufficient resolution to show dikes or other barriers, sources such as diking district maps may be used to augment the data. From wetted area data, inferences can also be made concerning biodiversity, vegetation, and the food web. 2.8.2.2.2
Field Monitoring Function
A statistically based sampling design can be implemented to evaluate functional parameters at early (“pilot”) restoration project sites, at near-pristine (“reference”) sites, and throughout the estuary. Habitat capacity may be evaluated by a) establishing the dynamics of some of the fundamental characteristics of the system related to restoration, including species-area curves, productivity, and hydraulic geometry relationships for tidal marsh channels, and b) weighting the available habitat (calculated through the GIS platform described above) according to its capacity. Realized function for salmon may be evaluated by establishing the residence times and growth in the available habitat types in each reach. 2.8.2.2.3
Numerical Modeling
Population models may be used to calculate the effects of increased mortality at the reach scale; previous modeling has treated the estuary as a whole (Kareiva et al. 2000). Primary productivity may be linked to secondary productivity (e.g., salmon) using standard oceanic models.
2.29
Evaluating Cumulative Ecosystem Response to Restoration Projects in the Columbia River Estuary, 2004
While all four lines of evidence contribute uniquely to the assessment, it is not recommended that they be explicitly weighted for the purposes of analysis. The remaining uncertainties are too large to permit the development of an appropriate scheme for weighting lines of evidence at this time. The third line of evidence, focused research into data gaps, is nonstandard in a weight-of-evidence approach but critical in that it will contribute to reducing uncertainties in the overall approach. The “higher-order” indicators identified for research under the third line of evidence describe fundamental ecological processes, and one or more of these may be identified through further study to be important to long-term monitoring of the cumulative restoration effects on the Columbia River estuary.
2.9 Conclusion Establishing a causal relationship between changes in estuarine habitats after implementation of restoration measures throughout the estuary and changes in the population viability of endangered salmon species is a great challenge for two primary reasons: 1) Pacific Northwest salmon traverse a very large region during their lifetimes and as a result, substantial contributions to their population viabilities are made by tributary habitats, upper mainstem habitats, estuarine habitats, and ocean habitats, and 2) the measurement of changes in estuarine habitat conditions and of the ways that estuarine habitats support salmon is a science still under development and significant gaps in our knowledge of the Columbia River estuary remain. Therefore, based on the review of analytical approaches from a variety of disciplines and indicators of fundamental estuarine processes, we offer the weight of evidence approach as a means of reducing the risk of mistakenly attributing causation. The development and examination of data in support of the four separate lines of evidence as proposed here may be expected to reduce uncertainties regarding the likely cumulative effects of multiple habitat restoration projects in the estuary on endangered salmon. Based on this literature review, the four lines of evidence proposed encompass 1) statistically based estuary-wide sampling for minimum structural and functional (process) indicators at project and reference sites, 2) spatial data processed in GIS including changes in land use and hydrological information, 3) focused research into data gaps to characterize appropriate indicators of fundamental processes in the system, such as organic matter export, and the relationships between elevation and vegetation, and 4) research into fish-habitat relationships via a mark/recapture technology. Further information about juvenile salmon use of estuary habitats will be particularly important to assessment of the cumulative effects of restoration actions. The standardization and widespread dissemination of monitoring protocols is also of time-critical importance, because restoration projects are currently being implemented in the estuary. Regional performance curves can be developed when a protocol is applied consistently across many sites in order to assess restoration efforts. Since habitat restoration actions are being undertaken by a variety of governmental and nongovernmental entities, and are being funded by multiple sources, a collaborative approach to the implementation of restoration monitoring will be the most effective. The results of standardized monitoring can be applied to the continual refinement of the conceptual model presented in Chapter 4. Through this adaptive process, as our understanding of the linkages between controlling factors, ecosystem structures and processes, and habitat functions for salmon increases, restoration methods can be improved and prioritized.
2.30
Evaluating Cumulative Ecosystem Response to Restoration Projects in the Columbia River Estuary, 2004
2.10 Literature Cited Aarts, B.G.W., F.W.B. Van den Brink, and P.H. Nienhuis, 2004. Habitat loss as the main cause of the slow recovery of fish faunas of regulated large rivers in Europe: The transversal floodplain gradient. River Res. and Appl. 20(1): 3-23. Abbruzzese, B., and S.G. Leibowitz. 1997. A synoptic approach for assessing cumulative impacts to wetlands. Environmental Management 21(3):457-475. Argent, D.G., J.A. Bishop, J.R. Stauffer, Jr., R.F. Carline, and W.L. Myers, 2003. Predicting freshwater fish distributions using landscape-level variables. Fisheries Research 60:17-32. Aspinall, R. and D. Pearson, 2000. Integrated geographical assessment of environmental condition in water catchments: linking landscape ecology, environmental modeling and GIS. Journal of Environmental Management 59:299-319. Baird, D.J., T.C.M. Brock, P.C. de Ruiter, A.B.A. Boxall, J.M. Culp, P. Eldridge, U. Hommen, R.G. Jak, K.A. Kidd, and T. DeWitt, 2001. The food web approach in the environmental management of toxic substances. In: D.J. Baird and G.A. Burton, Jr. (Eds), Ecological Variability: Separating Natural from Anthropogenic Causes of Ecosystem Impairment, SETAC Press, Pensacola, FL, pp. 83-122. Baker, C. and R. Miranda, 2003. Fish monitoring at floodplain wetland restoration sites in the Pacific Northwest U.S.A.: 2002 annual report to NOAA Fisheries. Ducks Unlimited, Inc., Vancouver, Washington. Beauchamp, D. 1999. Modeling food web interactions: A conceptual framework and applications for managing native-nonnative salmonids. in Symposium on management implications of co-occuring native and introduced fishes. NOAA National Marine Fisheries Service and Oregon Department of Fish and Wildlife, Portland, OR. Beechie, T., E. Beamer, B. Collins, and L. Benda, 1996. Restoration of habitat-forming processes in Pacific Northwest watersheds: a locally adaptable approach to salmonid habitat restoration. In: D.L. Peterson and C.V. Klimas (Eds), The Role of Restoration in Ecosystem Management. Society of Ecological Restoration. Available at http://216.119.67.178/index.htm.. Beechie, T., E. Beamer, and L. Wasserman, 1994. Estimating coho salmon rearing habitat and smolt production losses in a large river basin, and implications for restoration. North American Journal of Fisheries Management 14:797-811. Beechie, T. and S. Bolton, 1999. An approach to restoring salmonid habitat-forming processes in Pacific Northwest watersheds. Fisheries 24(4):6-15. Bisson, P.A., T.P. Quinn, G.H. Reeves, and S.V. Gregory, 1992. Best management practices, cumulative effects, and long-term trends in fish abundance in Pacific Northwest river systems. In: R.J. Naiman (Ed), Watershed Management: Balancing Sustainability and Environmental Change, SpringerVerlag, New York, pp.189-232. Botsford, L.W., J.C. Castilla, and C.H. Peterson, 1997. The management of fisheries and marine ecosystems. Science 277: 509-515.
2.31
Evaluating Cumulative Ecosystem Response to Restoration Projects in the Columbia River Estuary, 2004
Bottom, D.L., C.A. Simenstad, A.M. Baptista, D.A. Jay, J. Burke, K.K. Jones, E. Casillas, and M. Schiewe. 2001. Salmon at River's End: The role of the estuary in the decline and recovery of Columbia River salmon. DRAFT by NOAA National Marine Fisheries Service. Seattle, Washington. Bray, J. and J. Curtis, 1957. An ordination of the upland forest community of southern Wisconsin. Ecological Monographs 27:325-349. Brinson, M.M., 1993. A hydrogeomorphic classification for wetlands, Wetlands Research Program Technical Report WRP-DE-4, U.S. Army Corps of Engineers, Waterways Experimental Station, Vicksburg, MS. Burke, J.L., 2004. Life histories of juvenile Chinook salmon in the Columbia River Estuary, 1916 to the present. Thesis, Oregon State University, Corvallis, Oregon. Callaway, J.C., 2001. Hydrology and substrate. In: J.B. Zedler (Ed.), Handbook for Restoring Tidal Wetlands, CRC Press, Boca Raton, Florida, pp. 89-117. Callaway, J.C., G. Sullivan, J.S. Desmond, G.D. Williams, and J.B. Zedler. 2001. Assessment and monitoring. In J.B. Zedler (ed.) Handbook for restoring tidal wetlands. CRC Press, Boca Raton, Florida. pp.271-335. Chuenpagdee R, and L.E. Morgan, S.M. Maxwell, E.A. Norse, and D. Pauly, 2003. Shifting gears: assessing collateral impacts of fishing methods in US waters. Front. Ecol. Environ. 1(10): 517-524. Coats, R.N., P.B. Williams, C.K. Cuffe, J.B. Zedler, D. Reed, S.M. Watry and J.S. Noller. 1995. Design guidelines for tidal channels in coastal wetlands. Report prepared for U.S. Army Corps of Engineers Waterways Experiment Station, Catalog. No. TA7W343.D47, Vicksburg, MS. Coleman, F.C., W.F. Figueira, J.S. Ueland, and L.B. Crowder, 2004. The impact of United States recreational fisheries on marine fish populations. Science 305: 1958-1960. Collie, J.S., G.A. Escanero, and P.C. Valentine, 1997. Effects of bottom fishing on the benthinc megafauna of Georges Bank. Mar. Ecol. Prog. Ser. 155: 159-172. Council on Environmental Quality, 1997. Considering Cumulative Effects under the National Environmental Policy Act. Executive Office of the President, Washington, D.C. Available URL: http://ceq.eh.doe.gov/nepa/nepanet.htm Craft, C., S. Broome, and Carlton Campbell, 2002. Fifteen years of vegetation and soil development after brackish-water marsh creation. Restoration Ecology 10(2):248-258. Curnutt, J.L., J. Comiskey, M.P. Nott, and L.J. Gross, 2000. Landscape-based spatially explicit species index models for Everglades restoration. Ecological Applications 10(6):1849-1860. Desmond, J.S., J.B. Zedler and G.D. Williams, 2000. Fish use of tidal creek habitats in two southern California salt marshes. Ecological Engineering 14: 233-252. Diefenderfer, H.L., Thom, R.M. and K.D. Hofseth, 2005. A framework for risk analysis in ecological restoration projects. In: R.J.F. Bruins and M.T. Heberling (Eds), Economics and Ecological Risk Assessment: Applications to Watershed Management, CRC Press, Boca Raton, Florida.
2.32
Evaluating Cumulative Ecosystem Response to Restoration Projects in the Columbia River Estuary, 2004
Dinmore, T.A., D.E. Duplisea, B.D. Rackham, D.L. Maxwell, and S. Jennings, 2003. Impact of a largescale area closure on patterns of fishing disturbance and the consequences for benthic communities. ICES J. Mar. Sci. 60(2): 371-380. Dorward-King, E.J., G.W. Suter II, L.A. Kapustka, D.R. Mount, D.K. Reed-Judkins, S.M. Cormier, S.D. Dyer, M.G. Luxon, R. Parrish, G.A. Burton, Jr, 2001. Distinguishing among factors that influence ecosystems. In: D.J. Baird and G.A. Burton, Jr. (Eds), Ecological Variability: Separating Natural from Anthropogenic Causes of Ecosystem Impairment, SETAC Press, Pensacola, FL, pp. 1-26. Dyer, K.R. and R.J. Orth, eds., 1994. Changes in Fluxes in Estuaries: Implications from Science to Management. Proceedings of ECSA22/ERF Symposium, 13-18 September 1992, Institute of Marine Studies, University of Plymouth. Olsen & Olsen, Fredensborg, Denmark. Ehrenberg J.E. and T.W. Steig. 2003, Improved techniques for studying the temporal and spatial behavior of fish in a fixed location. ICES Journal of Marine Science 60 (3): 700-706. Eilers, H., 1975. Plants, plant communities, net production and tide levels: the ecological biogeography of the Nehalem salt marshes, Tillamook County, Oregon. Ph.D. Thesis, Oregon State University. Elliot, C. 2004. Environmental and historical factors driving plant communities on Russian Island, Columbia River Estuary. Presentation at International Society of Wetland Scientists 25th Anniversary Conference, Seattle, Washington, July 18-23, 2004. Unpublished master’s thesis, University of Washington, Seattle, Washington. Emmett, R., R. Llanso, J. Newton, R. Thom, M. Hornberger, C. Morgan, C. Levings, A. Copping, and P. Fishman, 2000. Geographic signatures of North American West Coast estuaries. Estuaries 23(6):765792. Feist, B.E., E.A. Steele, G.R. Pess, and R.E. Bilby, 2003. The influence of scale on salmon habitat restoration priorities. Anim. Conserv. 6: 271-282. Forest Ecosystem Management Assessment Team (FEMAT), 1993. Forest ecosystem management: an ecological, economic, and sockal assessment. U.S. Department of Agriculture, U.S. Department of the Interior, and others, Portland, Oregon. Forman, R.T.T., 1995. Land mosaics: The ecology of landscapes and regions. Cambridge UP, Cambridge. Frenkel, R.E. and J.C. Morlan, 1991. Can we restore our salt marshes? Lessons from the Salmon River, Oregon. The Northwest Environmental Journal 7:119-135. Garcia, S. and S. Newton, 1997. Current situation, trends, and prospects in world capture fisheries. In: E.K. Pikitch, D.D. Huppert, and M.P. Sissenwine (Eds), Global trends: fisheries management, American Fisheries Society Symposium 20, Bethesda, MD, pp. 3–27. Gergel, S.E., M.G. Turner, J.R. Miller, J.M. Melack, and E.H. Stanley, 2002. Landscape indicators of human impacts to riverine systems. Aquatic Sciences 64:118-128. Gosselink JG., and LC Lee. 1989. Cumulative Impact Assessment in Bottomland Hardwood Forests. Wetlands 9:89-174. Gosselink JG, LC Lee, and TA Muir. 1990. The regulation and management of bottomland hardwood forest wetlands: implications of the EPA-sponsored workshops" In Ecological processes and 2.33
Evaluating Cumulative Ecosystem Response to Restoration Projects in the Columbia River Estuary, 2004
cumulative impacts: illustrated by bottomland hardwood wetland ecosystems, eds. JG Gosselink, LC Lee, and TA Muir, pp. 638-671. Lewis Publishers, Inc., Chelsea, Michigan. Gray, A., C.A. Simenstad, D.L. Bottom, and T.J. Cornwell, 2002. Contrasting functional performance of juvenile salmon habitat in recovering wetlands of the Salmon River estuary, Oregon, U.S.A. Restoration Ecology 10(3):514-526. Guy, C.S., H.L. Blankenship, and L.A. Nielsen. 1996, Tagging and Marking. Pages 353-383, in B.R. Murphy and D.W. Willis, Eds., Fisheries Techniques, 2nd Edition. American Fisheries Society, Bethesda, MD. Hale, S.S., J.F. Paul, and J.F. Heltshe, 2004. Watershed landscape indicators of estuarine benthic condition. Estuaries 27(2):283-295. Hampel, H., A. Cattrijsse, and M. Vincx, 2003, Habitat value of a developing estuarine brackish marsh for fish and macrocrustaceans. ICES Journal of Marine Science 60 (2): 278-289. Hanson, P.C., Johnson, T.B., Schindler, D.E., and Kitchell, J.F. 1997. Fish Bioenergetics 3.0. University of Wisconsin Sea Grant Inst., Madison, Wis. Hardin, G.J., 1968. The tragedy of the commons. Science 162: 1243-1248. Healey, M.C. 1980. Utilization of the Nanaimo River estuary by juvenile Chinook salmon, Oncorhynchus tshawytscha), Fisheries Bulletin 77:653-668. Healey, M. C. 1982. Juvenile Pacific salmon in estuaries: the life support system. In V. S. Kennedy, (editor), Estuarine Comparisons, p. 315-341. Academic Press, New York. Hedges, J.I. and Mann, D.C., 1979. The lignin geochemistry of marine sediments from the southern Washington coast. Geochimica et Cosmochimica Acta 43:1809-1818. Hemstrom, M., T. Spies, C. Palmer, R. Kiester, J. Teply, P. McDonald, and R. Warbington. 1998. Latesuccessional and old-growth forest effectiveness monitoring plan for the Northwest Forest Plan. General Technical Report PNW-GTR-438. U.S. Department of Agriculture, Forest Service, Pacific Northwest Research Station, Portland, OR. Hendry, K., D. Cragg-Hine, M. O’Grady, H. Sambrook, and A. Stephen, 2003. Management of habitat for rehabilitation and enhancement of salmonid stocks. Fisheries Research 62:171-192. Hilborn, R., A.E. Punt, and J. Oresanz, 2004a. Beyond band-aids in fisheries management: Fixing world fisheries. Bull. Mar. Sci. 74(3): 493-507. Hilborn R, K. Stokes, J.J. Maguire, T. Smith, L.W. Botsford, M. Mangel, J. Orensanz, A. Parma, J. Rice, J. Bell, K.L. Cochrane, S. Garcia, S.J. Hall, G.P. Kirkwood, K. Sainsbury, G. Stefansson, and C. Walters, 2004b. When can marine reserves improve fisheries management? Ocean and Coast. Manage. 47(3-4): 197-205. Hilborn, R., T.A. Branch, B. Ernst, A. Magnusson, C.V. Minte-Vera, M.D. Scheurell, and J.L. Valero, 2003. State of the world’s fisheries. Annu. Rev. Environ. Resour. 28: 359-399. Hinton, S. and R.L. Emmett, 2000. Biological surveys of the Trestle Bay enhancement project 1994, 1996-97. NOAA Technical Memorandum NMFS-NWFSC-39, NOAA National Marine Fisheries Service Northwest Fisheries Science Center, Fish Ecology Division, Hammond, Oregon. 2.34
Evaluating Cumulative Ecosystem Response to Restoration Projects in the Columbia River Estuary, 2004
Hood, W.G., 2002. Landscape allometry: from tidal channel hydraulic geometry to benthic ecology. Can. J. Fish. Aquat. Sci. 59: 1418-1427. Hood, W.G., 2004. Indirect environmental effects of dikes on estuarine tidal channels: Thinking outside of the dike for habitat restoration and monitoring. Estuaries 27(2):273-282. Hooper, D.U. and P.M. Vitousek, 1997. The effects of plant composition and diversity on ecosystem processes. Science 277:1302-1305. Jackson, J.B.C., M.X. Kirby, W.H. Berger, K.A. Bjorndal, LW. Botsford, BJ. Bourque, RH. Bradbury, R. Cooke, J. Erlandson, J.A. Estes, T.P. Hughes, S. Kidwell, C.B. Lange, H.S. Lenihan, J.M. Pandolfi, C.H. Peterson, R.S. Steneck, M.J. Tegner, and R.R. Warner, 2001. Historical overfishing and the recent collapse of coastal ecosystems. Science 293: 629-637. Jefferson, C.A., 1975. Plant communities and succession in Oregon coastal salt marshes. Ph.D. Thesis, Oregon State University. Johnson, G., H. Diefenderfer, T. Berquam, B. Ebberts, C. Tortorici, and J. Wilcox. 2004. Plan for research, monitoring, and evaluation of salmon in the Columbia River estuary. Final draft prepared by the Pacific Northwest National Laboratory for the Bonneville Power Administration. PNNL14632. August 10, 2004. Josselyn, M. and J. Buchholz, 1984. Marsh restoration in San Francisco Bay: A guide to design and planning. Technical Report 3, Tiburon Center for Environmental Studies, San Francisco State University. Jurado-Molina, J. and P. Livingston, 2002. Climate-forcing effects on trophically linked groundfish populations: implications for fisheries management. Can. J. Fish. Aquat. Sci. 59(12): 1941-1951. Kareiva, P., M. Marvier, and M. McClure, 2000. Recovery and management options for spring/summer Chinook salmon in the Columbia River basin. Science 290:977-979. Karr, J. R., 2002. Understanding the consequences of human actions: Indicators from GNP to IBI. In: P. Miller and L. Westra (Eds), Just Ecological Integrity: The Ethics of Maintaining Planetary Life, Rowman and Littlefield, Lanham, MD, pp. 98-110. Kentula, M.E., R.P. Brooks, S.E. Gwin, C.C. Holland, A.D. Sherman and Jj.C. Sifneos. 1992. An approach to improving decision making in wetland restoration and creation. EPA/600/R-92/150, U.S. Environmental Protection Agency Environmental Research Laboratory, Corvallis, Oregon. Kistritz, R.U., K.J. Hall and I. Yesaki, 1983. Productivity, detritus flux, and nutrient cycling in a Carex lyngbyei tidal marsh. Estuaries 6(3):227-236. Kitchell, J.F., Stewart, D.J., and Weininger, D. 1977. Applications of a bioenergetics model to yellow perch (Perca flavescens) and walleye (Stizostedion vitreum vitreum). J. Fish. Res. Board Can. 34: 1922–1935. Kneib, R. T., 2003. Bioenergetic and landscape considerations for scaling expectations of nekton production from intertidal marshes. Marine Ecology Progress Series 264:279-296. Kremer, J.N., W.M. Kemp, A.E. Giblin, I. Valiela, S.P. Seitzinger, and E.E. Hofmann, 2000. Linking biogeochemical processes to higher trophic levels. In J.E. Hobbie (Ed.), Estuarine Science: A Synthetic Approach to Research and Practice. Island Press, Washington, D.C., pp. 299-341. 2.35
Evaluating Cumulative Ecosystem Response to Restoration Projects in the Columbia River Estuary, 2004
Kukulka, T. and D.A. Jay, 2003a. Impacts of Columbia River discharge on salmonid habitat: 1. a nonstationary fluvial tide model. Journal of Geophysical Research 108(C9):3293. Kukulka, T. and D.A. Jay, 2003b. Impacts of Columbia River discharge on salmonid habitat: 2. changes in shallow-water habitat. Journal of Geophysical Research 108(C9):3294. Kwak, T. J. and J. B. Zedler. 1997. Food web analysis of southern California coastal wetlands using multiple stable isotopes. Oecologia 110:262-277. Ledgerwood R.D., B.A. Ryan, E.M. Dawley, E.P. Nunnallee, and J.W. Ferguson. 2004, A surface trawl to detect migrating juvenile Salmonids tagged with passive integrated transponder tags. North American Journal of Fisheries Management 24 (2): 440-451. Lee K.S., F.T. Short, and D.M. Burdick, 2004. Development of a nutrient pollution indicator using the seagrass, Zostera marina, along nutrient gradients in three New England estuaries. Aquat. Bot. 78(3): 197-216. Leibowitz, S.G., B. Abbruzzese, P.R Adamus, L.E. Hughes, and J.T. Irish. 1992. A Synoptic Approach to Cumulative Impact Assessment: A Proposed Methodology. EPA/600/R-92/167. U.S. Environmental Protection Agency, Environmental Research Laboratory, Corvallis, Oregon. Levings, C.D. 1994. Feeding behavior of juvenile salmon and significance of habitat during estuary and early sea phase. Nordic Journal of Freshwater Research 69:7-16. Levings, C.D., K. Conlin and B. Raymond. 1991. Intertidal habitats used by juvenile Chinook salmon (Oncorhynchus tshawytscha) rearing in the North Arm of the Fraser River Estuary. Marine Pollution Bulletin 22(1):20-26. Levings, C.D., C.D. McAllister, and B.D. Chang. 1986. Differential use of the Campbell River estuary, British Columbia, by wild and hatchery-reared juvenile Chinook salmon (Oncorhynchus tshawytscha). Can. J. Fish. Aquat. Sci. 43(7):1386-1397. Levings, C.D., and A.E. Moody, 1976. Studies of intertidal vascular plants, especially sedge (Carex lyngbei) on the disrupted Squamish River delta. B.C. Fish. Mar. Serv. Report No. 606. Levy, D.A. and T.G. Northcote. 1982. Juvenile salmon residency in a marsh area of the Fraser River Estuary. Canadian Journal of Fisheries and Aquatic Sciences 39:270-276. Loreau, M., S. Naeem, P. Inchausti, J. Bengtsson, J.P. Grime, A. Hector, D.U. Hooper, M.A. Huston, D. Raffaelli, B. Schmid, D. Tilman, and D.A. Wardle, 2001. Biodiversity and ecosystem functioning: current knowledge and future challenges. Science 294:804-808. Louisiana Coastal Wetlands Conservation and Restoration Task Force. 2001. The 2000 evaluation report to the U.S. Congress on the effectiveness of Louisiana coastal wetland restoration projects. Louisiana Department of Natural Resources, Baton Rouge, Louisiana. Lower Columbia River Estuary Program. 1999. Lower Columbia River Estuary Plan, Comprehensive Conservation and Management Plan, Volume I. Portland, Oregon. Lucotte, M. and B. D’Anglejan, 1986. Seasonal control of the Saint-Lawrence maximum turbidity zone by tidal-flat sedimentation. Estuaries 9(2):84-94.
2.36
Evaluating Cumulative Ecosystem Response to Restoration Projects in the Columbia River Estuary, 2004
MacArthur, R.H. and E.O. Wilson, 1963. An equilibrium theory of insular zoography. Evolution 17:373387. Madon, S. P., G. D. Williams, J. M. West, and J. B. Zedler. 2001. The importance of marsh access to growth of the California killifish, Fundulus parvipinnis, evaluated through bioenergetics modeling. Ecol. Model. 136: 149–165. Magnusson A. and R. Hilborn. 2003. Estuarine influence on survival rates of Coho (Oncorhynchus kisutch) and Chinook salmon (Oncorhynchus tshawytscha) released from hatcheries on the US Pacific Coast. Estuaries 26 (4B): 1094-1103. Maltby, L., T.J. Kedwards, V.E. Forbes, K. Grasman, J.E. Kammenga, W.R. Munns Jr., A.H. Ringwood, J.S. Weis, and S.N. Wood, 2001. Linking individual-level responses and population-level consequences. In: D.J. Baird and G.A. Burton, Jr. (Eds), Ecological Variability: Separating Natural from Anthropogenic Causes of Ecosystem Impairment, SETAC Press, Pensacola, FL, pp. 27-82. McCann, K.S., 2000. The diversity-stability debate. Nature, 405:228-233. Medvinsky, A.B., I.A. Tikhonova, S.V. Petrovskii, H. Malchow, and E. Venturino, 2001. Chaos and order in spatially structured plankton dynamics. A theoretical study. In: W. Sulis and I Trofimova (Eds), Nonlinear Dynamics in the Life and Social Sciences, IOS Press, Amsterdam. Miller, J.A. and C.A. Simenstad, 1997. A comparative assessment of a natural and created estuarine slough as rearing habitat for juvenile Chinook and Coho salmon. Estuaries 20(4):792-806. Mitsch, W.J. and J.G. Gosselink, 2000. Wetlands. John Wiley & Sons, Inc., New York. Morgan, P.A. and F.T. Short, 2002. Using functional trajectories to track constructed salt marsh development in the Great Bay estuary, Maine/New Hampshire, U.S.A. Ecological Restoration 10(3):461-473. Mulder, B.S., B.R. Noon, and T.A. Spies et al., 1999. The strategy and design of the effectiveness monitoring program for the Northwest Forest Plan. Gen. Tech. Rep. PNW-GTR-437. U.S. Department of Agriculture, Forest Service, Pacific Northwest Research Station, Portland, OR. Murawski, S.A., 2000. Definitions of overfishing from an ecosystem perspective. ICES J. Mar. Sci. 57(3): 649-658. Naiman, R.J., T.J. Beechie, L.E. Benda, D.R. Berg, P.A. Bisson, L.H. MacDonald, M.D. O’Connor, P.L. Olson, and E.A. Steel, 1992. Fundamental elements of ecologically healthy watersheds in the Pacific Northwest Coastal Ecoregion. In: R.J. Naiman (Ed), Watershed Management: Balancing Sustainability and Environmental Change, Springer-Verlag, New York, pp. 127-189. Naiman, R.J. and J.R. Sibert, 1978. Transport of nutrients and carbon from the Nanaimo River to its estuary. Limnol. Oceanogr. 23(6):1183-1193. National Research Council (NRC), 1992. Restoration of aquatic ecosystems: science, technology, and public policy. National Academic Press, Washington, D.C. National Research Council (NRC), 2003. Adaptive monitoring and assessment for the comprehensive Everglades restoration plan. The National Academies Press, Washington, DC.
2.37
Evaluating Cumulative Ecosystem Response to Restoration Projects in the Columbia River Estuary, 2004
National Research Council (NRC), 2004a. Adaptive management for water resources project planning. Panel on Adaptive Management for Resource Stewardship, Committee to Assess the U.S. Army Corps of Engineers Methods of Analysis and Peer Review for Water Resources Project Planning, The National Academies Press, Washington, DC. National Research Council (NRC), 2004b. Analytical methods and approaches for water resources project planning. Panel on Methods and Techniques of Project Analysis, Committee to Assess the U.S. Army Corps of Engineers Methods of Analysis and Peer Review for Water Resources Project Planning, The National Academies Press, Washington, DC. National Research Council (NRC), 2004c. River basins and coastal systems planning within the U.S. Army Corps of Engineers. Panel on River Basin and Coastal Systems Planning, Committee to Assess the U.S. Army Corps of Engineers Methods of Analysis and Peer Review for Water Resources Project Planning, The National Academies Press, Washington, DC. National Research Council (NRC), 2004d. U.S. Army Corps of Engineers water resources planning: a new opportunity for service. Coordinating Committee, Committee to Assess the U.S. Army Corps of Engineers Methods of Analysis and Peer Review for Water Resources Project Planning, The National Academies Press, Washington, DC. Neckles, H. A., M. Dionne, D.M. Burdick, C.T. Roman, R. Buchsbaum, and E. Hutchins, 2002. A monitoring protocol to assess tidal restoration of salt marshes on local and regional scales. Restoration Ecology 10(3):556-563. Nehlsen, W., J.E. Williams, and J.A. Lichatowich, 1991. Pacific salmon at the crossroads—stocks at risk from California, Oregon, Idaho, and Washington. Fisheries 16(2): 4-21. Nestler, J. and V.K. Sutton, 2000. Describing scales of features in river channels using fractal geometry concepts. Regul. Rivers: Res. Manage. 16(1): 1-22. NOAA Fisheries. 2004. Biological Opinion on Operation of the Federal Columbia River Power System. State/Tribal review draft. Log Number F/NWR/2004/00727. September 8, 2004. Odum, E.P., 1980. The status of three ecosystem-level hypotheses regarding salt marsh estuaries. Tidal subsidy, outwelling and detritus based food chains. In: V.S. Kennedy (Ed), Estuarine Perspectives, Academic Press, New York, pp. 485-495. Orth, K., 1993. Using habitat suitability index models in plan formulation. CEWRC-IWR-P, U.S. Army Corps of Engineers Institute for Water Resources, Alexandria, VA. Pasternack, G.B. and G.S. Brush, 1998. Sedimentation cycles in a river-mouth tidal freshwater marsh. Estuaries 21(3):407-415. Paul M.J. and J.L. Meyer, 2001. Streams in the urban landscape, Annual Review of Ecology and Systematics 32: 333-365. Pess, G., D.R. Montgomery, T.J. Beechie, and L. Holsinger, 2003. Anthropogenic alterations to the biogeography of Puget Sound Salmon. In: D.R. Montgomery, S. Bolton, D.B. Booth, and L. Wall (Eds), Restoration of Puget Sound Rivers, University of Washington Press, Seattle, WA, pp. 129-154.
2.38
Evaluating Cumulative Ecosystem Response to Restoration Projects in the Columbia River Estuary, 2004
Peterson JH and J.F. Kitchell, 2001. Climate regimes and water temperature changes in the Columbia River: Bioenergetic implications for predators of juvenile salmon. Canadian Journal Fish.Aquat.Sci., 58. 1831-1841. Pikitch, E.K., C. Santora, E.A. Babcock, A. Bakun, R. Bonfil, D.O. Conover, P. Dayton, P. Doukakis, D. Fluharty, B. Heneman, E.D. Houde, J. Link, P.A. Livingston, M. Mangel, M.K. McAllister, J. Pope, and K.J. Sainsbury, 2004. Ecosystem-Based Fishery Management. Science 305: 346-347. Portnoy, J.W., 1999. Salt marsh diking and restoration: Biogeochemical implications of altered wetland hydrology. Environmental Management 24(1):111-120. Pruter, A.T. and D.L. Alverson (eds.). 1972. The Columbia River Estuary and Adjacent Ocean Waters: Bioenvironmental Studies. University of Washington Press, Seattle, Washington. Purvis, A. and A. Hector, 2000. Getting the measure of biodiversity. Nature 405:212-219. Raposa, K., 2002. Early responses of fishes and crustaceans to restoration of a tidally restricted New England salt marsh. Restoration Ecology 10(4):665-676. Rastetter, E. B., M. G. Ryan, G. R. Shaver, J. M. Melillo, K. J. Nadelhoffer, J. E. Hobbie and J. D. Aber, 1991. A general biogeochemical model describing the responses of the C and N cycles in terrestrial ecosystems to changes in CO2, climate and N deposition. Tree Physiology 9:101-126. Reed, D.J., 2000. Coastal biogeomorphology: an integrated approach to understanding the evolution, morphology, and sustainability of temperate coastal marshes. In J.E. Hobbie (Ed.), Estuarine Science: A Synthetic Approach to Research and Practice. Island Press, Washington, D.C., pp.347-361. Reeder, T.G. and S.D. Hacker, 2004. Factors contributing to the removal of a marine grass invader (Spartina anglica) and subsequent potential for habitat restoration. Estuaries 27(2):244-252. Reeves, G.E, J.D. Hall, T.D. Roelofs, T.L. Hickman, and C.O. Baker, 1991. Rehabilitating and modifying stream habitats. Pages 519-558 in: W.R. Meehan (ed.). Influences of forest and rangeland management on salmonid fishes and their habitats. American Fisheries Society Special Publication 19. Bethesda, Maryland. 751 p. Reeves, G.H., L.E. Benda, K.M. Burnett, P.A. Bisson, and J.R. Sedell, 1995. A disturbance-based ecosystem approach to maintaining and restoring freshwater habitats of evolutionarily significant units of anadromous salmonids in the Pacific Northwest. American Fisheries Society Symposium 17:334-349. Reeves, G.H., D.B. Hohler, B.E. Hansen, F.H. Everest, J.R. Sedell, T.L. Hickman, and D. Shively, 1997. Fish habitat restoration in the Pacific Northwest: Fish Creek of Oregon. In: J.E. Williams, C.A. Wood, and M.P. Dombeck (Eds), Watershed Restoration: Principles and Practices, American Fisheries Society, Bethesda, Maryland. Reeves, G.H., D.B. Hohler, D.P. Larsen, D.E. Busch, K. Kratz, K. Reynolds, K.F. Stein, T. Atzet, P. Hays, and M. Tehan, 2004. Effectiveness monitoring for the aquatic and riparian component of the Northwest Forest Plan: conceptual framework and options. Gen. Tech. Rep. PNW-GTR-577. U.S. Department of Agriculture, Forest Service, Pacific Northwest Research Station, Portland, OR. Reimers, P. E. 1973. The length of residence of juvenile fall Chinook salmon in Sixes River, Oregon. Oregon Fish Comm. Res. Rep. 4, 43 p.
2.39
Evaluating Cumulative Ecosystem Response to Restoration Projects in the Columbia River Estuary, 2004
Rice, C.A., L.L. Johnson, P. Roni, B.E. Feist, W.G. Hood, L.M. Tear, C.A. Simenstad, and G.D. Williams, 2005. Monitoring rehabilitation in temperate North American estuaries. In: P. Roni (Ed.), Monitoring Stream and Watershed Restoration. American Fisheries Society, Bethesda, Maryland, pp. 165-204. Rich, W.H., 1920. Early history and seaward migration of Chinook salmon in the Columbia and Sacramento rivers. Bulletin of the U.S. Bureau of Fisheries 37. Rieman B.E., D.C. Lee, R.F. Thurow, P.F. Hessburg, and J.R. Sedell, 2000. Toward an integrated classification of ecosystems: Defining opportunities for managing fish and forest health. Environ. Manage. 25(4): 425-444. Roberts, C.M., J.A. Bohnsack, F. Gell, J.P. Hawkins, and R. Goodridge, 2001. Effects of Marine Reserves on Adjacent Fisheries. Science 294: 1920-1923. Roni, P., T.J. Beechie, R.E. Bilby, F.E. Leonetti, M.M. Pollock, and G.R. Pess, 2002. A review of stream restoration techniques and a hierarchical strategy for prioritizing restoration in Pacific Northwest Watersheds. North American Journal of Fisheries Management 22:1-20. Rose, K.A., 2000. Why are quantitative relationships between environmental quality and fish populations so elusive? Ecol. Appl. 10(2): 367-385. Russ GR, Alcala AC, Maypa AP, et al.2004. Marine reserve benefits local fisheries. Ecological Applications 14(2): 597-606. Sala, O.E., F.S. Chapin III, J.J. Armesto, E. Berlow, J. Bloomfield, R. Dirzo, E.Huber-Sanwald, L.F. Huenneke, R.B. Jackson, A. Kinzig, R. Leemans, D.M. Lodge, H.A. Mooney, M. Oesterheld, N.L. Poff, M.T. Sykes, B.H. Walker, M. Walker, and D.H. Wall, 2000. Global biodiversity scenarios for the year 2100. Science 287:1770-1774. San Francisco Estuary Project, 2000. Restoration primer: San Francisco Bay, Sacramento-San Joaquin River Delta Estuary. Proceedings of the State of the Estuary (SOE) conference, March, 1999. San Francisco Estuary Project, Oakland, CA. Secor, D.H., A. Henderson-Arzapalo, and P.M. Piccoli. 1995. Can otolith microchemistry chart patterns of migration and habitat utilization in anadromous fishes? Journal of Experimental Marine Biology and Ecology 192: 15-33. Secor D.H., J.R. Rooker, E. Zlokovitz, V.S. Zdanowicz. 2001, Identification of riverine, estuarine, and coastal contingents of Hudson River striped bass based upon otolith elemental fingerprints. Marine Ecology Progress Series 211: 245-253. Sherwood, C.R., D.A. Jay, R.B. Harvey, P. Hamilton, and C.A. Simenstad, 1990. Historical changes in the Columbia River estuary. In: K.R. Dyer and R.J. Orth (Eds), Changes in Fluxes in Estuaries: Implications from Science to Management (ECSA22/ERF symposium, Plymouth, September 1992), Olsen and Olsen, Fredensborg, Denmark, pp. 299-352. Short, F. T., D.M. Burdick, C.A. Short, R.C. Davis, and P.A. Morgan, 2000. Developing success criteria for restored eelgrass, salt marsh and mud flat habitats. Ecological Engineering 15(3-4):239-252. Simenstad, C.A. and J.R. Cordell. 2000. Ecological assessment criteria for restoring anadromous salmonid habitat in Pacific Northwest estuaries. Ecological Engineering 15:283-302. 2.40
Evaluating Cumulative Ecosystem Response to Restoration Projects in the Columbia River Estuary, 2004
Simenstad, C.A., J.R. Cordell, J.A. Miller, W.G. Hood, and R.M. Thom, 1993. Ecological status of a created estuarine slough in the Chehalis River estuary: Assessment of created and natural estuarine sloughs, January-December 1992. FRI-UW-9305, prepared for U.S. Army Corps of Engineers, Seattle District, by Fisheries Research Institute, University of Washington School of Fisheries. Simenstad, C.A. and B.E. Feist. 1996. Restoration potential of diked estuarine wetlands: inferring fate and recovery rate of historically-breached sites. U.S. Environmental Protection Agency Office of Ecosystems & Communities, EPA 910/R-96-005, July 1996, Seattle, Washington. Simenstad, C.A., W.G. Hood, R.M. Thom, D.A. Levy, and D.L. Bottom, 2000. Landscape structure and scale constraints on restoring estuarine wetlands for Pacific Coast juvenile fishes. In: M.P. Weinstein and D.A. Kreeger (Eds), Concepts and Controversies in Tidal Marsh Ecology, Kluwer Academic Publishing, Dordrecht, pp. 597-630. Simenstad, C.A., D.A. Jay and C.R. Sherwood, 1992. Impacts of watershed management on land-margin ecosystems: the Columbia River estuary as a case study. In: R.J. Naiman (Ed), Watershed Management: Balancing Sustainability and Environmental Change, Springer-Verlag, New York, pp. 266-306. Simenstad, C.A., C.A. Morgan, J.R. Cordell, and J.A. Baross, 1994. Flux, passive retention, and active residence of zooplankton in the Columbia River estuarine turbidity maximum. In: K.R. Dyer and R.J. Orth (Eds), Changes in Fluxes in Estuaries: Implications from Science to Management (ECSA22/ERF symposium, Plymouth, September 1992), Olsen and Olsen, Fredensborg, Denmark, pp. 473-482. Simenstad, C.A., C.D. Tanner, R.M. Thom and L.L. Conquest. 1991. Estuarine habitat assessment protocol. EPA 910/9-91-037. Prepared for U.S. EPA, Region 10, Office of Puget Sound, Seattle, WA. Small, L.F. (ed.), 1990. “Columbia River: Estuarine System.” Special Issue. Progress in Oceanography, Vol. 25, no. 1-4. Small L.F., Mcintire C.D., Macdonald K.B., Laralara J.R., Frey B.E., Amspoker M.C., Winfield T. 1990. Primary Production, Plant and Detrital Biomass, and Particle-Transport in the Columbia River Estuary. Progress in Oceanography 25 (1-4): 175-210. Stewart, D. and M. Ibarra. 1991. Predation and production by salmonine fishes in Lake Michigan, 19781988. Canadian Journ. Fish. Aquat. Sci.. 48:909-922. Steyer, G.D. and D.W. Llewellyn, 2000. Coastal Wetlands Planning, Protection, and Restoration Act: a programmatic application of adaptive management. Ecological Engineering 15:385-395. Steyer, G.D., C.E. Sasser, J.M. Visser, E.M. Swenson, J.A. Nyman, and R.C. Raynie, 2003. A proposed coast-wide reference monitoring system for evaluating wetland restoration trajectories. Journal of Environmental Monitoring and Assessment 81:107-117. Swamy, V., P.E. Fell, M. Body, M.B. Keaney, M.K. Nyaku, E.C. McIlvain, and A.L. Keen., 2002. Macroinvertebrate and fish populations in a restored impounded salt marsh 21 years after the reestablishment of tidal flooding. Environmental Management 29(4):516-530.
2.41
Evaluating Cumulative Ecosystem Response to Restoration Projects in the Columbia River Estuary, 2004
Tarboton, K., D. Loucks, S. Davis, and J. Obeysekera, 2003. Habitat suitability indices for evaluating water management alternatives. Technical Report. South Florida Water Management District, West Palm Beach, Florida. Thom, R.M., 1987. The biological importance of Pacific Northwest estuaries. Northwest Environmental Journal 3(1):23-41. Thom, R.M., 1997. “System-development matrix for adaptive management of coastal ecosystem restoration projects.” Ecological Engineering 8:19-232. Thom, R.M. 2000. “Adaptive management of coastal ecosystem restoration projects.” Ecological Engineering 15:365-372. Thom, R.M. and K.F. Wellman, 1996. Planning aquatic ecosystem restoration monitoring programs, IWR Report 96-R-23, prepared for Institute for Water Resources, U.S. Army Corps of Engineers, Alexandria, VA and Waterways Experimental Station, U.S. Army Corps of Engineers, Vicksburg, MS. Thom, R.M., R. Zeigler and A.B. Borde, 2002. Floristic development patterns in a restored Elk River estuarine marsh, Grays Harbor, Washington. Restoration Ecology 10(3):487-496. Thomas, D.W. 1983. Changes in Columbia River estuary habitat types over the past century. Columbia River Estuary Data Development Program, Columbia River Estuary Study Taskforce, Astoria, Oregon. Thomas, D.W. 1984. The vascular flora of the Columbia River estuary. Wasmann Journal of Biology 42:92-106. Tilman, D., J. Knops, D. Wedin, P. Reich, M. Ritchie and E. Siemann, 1997. The influence of functional diversity and composition on ecosystem processes. Science 277:1300-1302. Underwood, A.J., 1991. Beyond BACI: experimental designs for detecting human environmental impacts on temporal variation in natural populations. Australian Journal of Marine and Freshwater Restoration 42:569-587. Underwood, A.J., 1992. Beyond BACI: the detection of environmental impacts on populations in the real, but variable world. Journal of Experimental Marine Biology and Ecology 161:145-178. Underwood, A.J., 1994. On beyond BACI: sampling designs that might reliably detect environmental disturbances. Ecological Applications 41:3-15. U.S.D.A. Forest Service and U.S.D.I. Bureau of Land Management, 1994a. Final supplemental environmental impact statement on management of habitat for late-successional and old-growth forest related species within the range of the northern spotted owl. Portland, Oregon. U.S.D.A. Forest Service and U.S.D.I. Bureau of Land Management, 1994b. Record of decision for amendments to Forest Service and Bureau of Land Management planning documents within the range of the northern spotted owl (place of publication unknown). 74 p. U.S. Fish and Wildlife Service, 1980. Habitat evaluation procedures handbook, 870 FW-1, U.S. Fish and Wildlife Service, Washington, D.C.
2.42
Evaluating Cumulative Ecosystem Response to Restoration Projects in the Columbia River Estuary, 2004
U.S. Forest Service, 1993. Pacific Yew Final Environmental Impact Statement, USDA, Forest Service, Pacific Northwest Regional Office, Portland, OR. Vitousek P.M., J.D. Aber, R.W. Howarth, G.E. Likens, P.A. Matson, D.W. Schindler, W.H. Schlesinger, and D.G. Tilman, 1997. Human alteration of the global nitrogen cycle: Sources and consequences. Ecol. Appl. 7(3): 737-750. Walker, C.H., S.P. Hopkin, R.M. Sibly, and D.B. Peakall, 1996. Principles of Ecotoxicology, Taylor & Francis Ltd., London. Warren, R.S., P.E. Fell, R. Rozsa, A.H. Brawley, A.C. Orsted, E.T. Olson, V. Swamy, and W.A. Niering, 2002. Salt marsh restoration in Connecticut: 20 years of science and management. Restoration Ecology 10(3):497-513. Weinstein MP, S.Y. Litvin, K.L. Bosley, C.M. Fuller, and S.C. Wainright, 2000. The role of tidal salt marsh as an energy source for marine transient and resident finfishes: A stable isotope approach Transactions of the American Fisheries Society 129 (3): 797-810. Weitkamp, L.A. 1994. A review of the effects of dams on the Columbia River estuarine environment, with special reference to salmonids. Report funded by Bonneville Power Administration, Portland, OR and National Marine Fisheries Service, Seattle, WA. Wilber P, G Thayer, M Croom, and G Mayer. 2000. "Goal Setting and Success Criteria for Coastal Habitat Restoration." Ecological Engineering, Special Issue 15(3-4):165. Williams, G.D. and J. S. Desmond, 2001. Restoring assemblages of invertebrates and fishes. In: J.B. Zedler (Ed.), Handbook for Restoring Tidal Wetlands, CRC Press, Boca Raton, Florida, pp. 235-269. Williams, P.B., M.K. Orr and N.J. Garrity. 2002. Hydraulic geometry: a geomorphic design tool for tidal marsh channel evolution in wetland restoration projects. Restoration Ecology 10(3): 577-590. Williams, G.D. and J.B. Zedler, 1999. Fish assemblage composition in constructed and natural tidal marshes of San Diego Bay: Relative influence of channel morphology and restoration history. Estuaries 22:702-716. Wissmar, R.C. and R.L. Beschta, 1998. Restoration and management of riparian ecosystems: a catchment perspective. Freshwat. Biol. 40(3): 571-585.
2.43
Evaluating Cumulative Ecosystem Response to Restoration Projects in the Columbia River Estuary, 2004
2.44
Evaluating Cumulative Ecosystem Response to Restoration Projects in the Columbia River Estuary, 2004
3.0 Columbia River Estuary Habitat Use by Juvenile Salmonids The diversity and abundance of salmonid populations in the Columbia River Basin have declined through the past 150 years in association with increased harvest and alterations to the environment, especially degradation and loss of spawning and rearing areas, changes in river flows, and impediments to juvenile and adult migration (Fulton 1968; Mullan et al. 1992; Weitkamp 1994). Physical modifications of the estuary such as filling, diking, and dredging have resulted in the loss of shallow water habitat including most tidal swamps and marshes (Thomas 1983, Kukulka and Jay 2003a, b). Changes in the timing and magnitude of river flow by dam construction have affected water depth and velocity, sedimentation rates and locations, and salinity intrusion (Sherwood et al. 1984, Kukulka and Jay 2003a, b). Mitigation, including hatchery supplementation of stocks and corrective measures to recover from the many anthropogenic impacts, has been attempted throughout the 20th century; however, even together with fisheries harvest management actions, it has been insufficient to maintain fish stocks at high abundances (Mighetto and Ebel 1995; Lichatowich 1999; ISG 2000). Until recently, there have been few attempts to restore lost or degraded habitats. As a result, negative effects on juvenile salmonids during rearing and migration through the estuary continue to occur. The focus for estuary restoration is to enhance the recovery of Endangered Species Act (ESA)-listed salmonid stocks by providing a greater landscape of critical habitat previously lost through anthropogenic alterations. Historically, salmon stocks are believed to have expressed a wide diversity of life history patterns within and between species, important for mitigating environmental variability in freshwater and ocean rearing zones. Today this diversity is absent or much reduced (Burke 2004; Bottom et al. in press). Dam construction eliminated many stocks of salmon from the upper Snake and Columbia Rivers (Nehlsen et al. 1991; Lichatowich 1999; ISG 2000; NOAA 2004). Additionally, hatchery production, now providing the majority of outmigrating juveniles, has substantially diminished the diversity of life histories by suppressing volitional migration (NOAA 2004; Bottom et al. in press). Because of these factors, life history diversity at historic levels may not be achievable. However, estuarine restoration can facilitate recovery of surviving evolutionarily significant units (ESUs) by increasing habitat opportunity for underrepresented life history types. Based on a model of long-term population data, Kareiva et al. (2000) predicted “modest reductions in first year or estuarine mortality would reverse current population declines.” Work is currently underway to document correlations between specific habitat features and use by juvenile salmonids, with the goal of understanding which habitat features enhance growth, survival, and diversity (Bottom 2004). Below, we provide a brief historical review of the research on juvenile salmonid migration and habitat use in the Columbia River estuary (CRE) that forms the foundation of our understanding of the CRE’s role in the life histories of ESA-listed anadromous fish.
3.1 Juvenile Salmon Research in the Columbia River Estuary Through the past 95 years, a tremendous amount of research has been conducted on juvenile salmon in the Columbia River Estuary. The major studies addressing migration characteristics were documented 3.1
Evaluating Cumulative Ecosystem Response to Restoration Projects in the Columbia River Estuary, 2004
by Rich (1920), Reimers and Loeffel (1967), Bottom et al. (1984), Dawley et al. (1986), Ledgerwood et al. (2004), Schreck et al. (2004), and Roegner et al. (2004). Temporal distributions, migration timing and behavior, relative survival, and feeding traits were assessed for the various species, races, and stocks of salmonids captured using beach and purse seines, traps, trawls, and hooks and line or tracked using radio and acoustic tags. That research provides direction for estuarine restoration assessments regarding the groups of fish, dates, and to some extent, areas of greatest habitat use prior to migration to the ocean.
3.1.1 Study Years 1914 - 1916 Rich (1920) intermittently sampled juvenile salmon in the lower Columbia River and estuary to assess the temporal distribution, sex, size, and age of yearling (river type) and subyearling (ocean type) Chinook salmon. About 1,000 unmarked fry and fingerlings were captured using a beach seine and hook and line at 12 sites from Columbia River Kilometer (rkm) 9 to 260. Body size and scale growth were utilized to assess age and residence duration at various locations in the lower river and estuary. Data and descriptions provide the following conclusions: • • • •
Once fish entered the main river they steadily migrated to the ocean. Thus, samples collected at successive months were made up of entirely different groups of fish. Fish grew throughout the migration period and had accelerated growth in the estuary associated with salt water residence. Yearling Chinook salmon entered the estuary in the months of April and May and exited the estuary by June. Subyearling Chinook salmon appeared to utilize the estuary for extended periods of time, and their temporal distribution in the estuary ranged from initiation of sampling on 31 March through the termination of sampling on 8 December.
3.1.2 Study Year 1963 Reimers and Loeffel (1967) seined and trapped subyearling fall Chinook in several salmon-bearing tributaries of the Columbia River estuary. Sampling began in June, after the majority of Chinook had migrated, and continued through early November with three samples collected each month. In several tributaries, portions of the fish population continued residence through the summer and into October and November, well beyond the date of emigration for the majority of fish. Based on about 500 sets of forklength and scale data from juveniles and scale data from returning adults, the researchers evaluated dates of saltwater entrance and inferred duration of estuarine residence for juveniles. Data and descriptions provide the following conclusions: • •
Fall Chinook remaining in tributaries after early June were the smallest individuals of each population. Following protracted tributary residence, Lower Columbia Fall Chinook migrated to the ocean during autumn of the first year of life or the spring of the second year. Thus, a portion of this stock and probably portions of other stocks resided in the estuary for a period of time prior to entering the ocean.
3.1.3 Study Years 1966 - 1972 Sims and Durkin (reported in Dawley et al. 1986) used beach and purse seines, trap nets, and trawls at 44 sites throughout the estuary below rkm 75. Juvenile salmonids (~1,000,000 unmarked and ~30,000
3.2
Evaluating Cumulative Ecosystem Response to Restoration Projects in the Columbia River Estuary, 2004
marked) were examined. Body size, temporal distribution, diurnal movements, migration routes, and abundance were assessed. The researchers attempted to evaluate hatchery practices to determine characteristics that produced the best migration survival of subyearling (ocean type) Chinook salmon and to determine the best size and date of release for subyearling Chinook and coho (O. kisutch) salmon. Data and descriptions provide the following conclusions: • • • •
• •
•
•
The temporal distribution of subyearling Chinook salmon varied substantially between years. Size of individuals captured in mid-river was larger than individuals captured nearshore. Average fork length of coho salmon increased through the migration period. Average fork length of subyearling Chinook salmon approached 75 mm by mid- to late-May and did not increase significantly until late July, both at Jones Beach (rkm 75 and at Clatsop Spit (rkm 7). Survival assessments were compromised by differences of behavior related to release location and date. Movement of hatchery subyearling Chinook salmon through the estuary was generally rapid; within 6 days after reaching the tidal freshwater zone at Jones Beach, Oregon (rkm 75), the same groups began entering the ocean. Duration of estuarine residence was greatest for the smaller individuals of hatchery coho and subyearling Chinook salmon (up to 90 days); those emigrating from tributaries closest to the mouth of the river (estuarine movement rates as low 3 km d-1); and the earliest released (midApril) coho salmon, among which upstream migration in the estuary occurred. Chinook salmon fry residing in the estuary were few compared to the total numbers of migrants, but those few grew rapidly (Washougal fish increased about 0.6 mm d-1), particularly during the warm water period after mid-July.
3.1.4 Study Years 1977 - 1983 Dawley et al. (1985a, 1985b, 1986) used beach and purse seines to capture juvenile salmonids in the tidal freshwater zone at rkm 75 at Jones Beach (~1,900,000 fish). Additionally during 1978-1980, sampling was conducted at 14 secondary sites throughout the estuary (~23,000 fish) and 20 sites in marine waters within 25 km of the river mouth (~1,200 fish; Miller et al. 1983). The capture of a high number of marked fish (~85,000) as well as unmarked fish allowed discrimination of body size, temporal distribution, and timing to and through the estuary by different salmon stocks. Feeding intensity and relative survival of marked fish in relation to environmental and biological characteristics were also evaluated (Kirn et al. 1986; Ledgerwood 1991). Data and descriptions provide the following conclusions: •
•
Catch per unit effort (CPUE) did not properly index abundance because of differences in sampling gear, location, time, tide, river flow, and fish size. However, estimates of relative survival to Jones Beach in the tidal freshwater zone were made among fish groups of similar size that were migrating during the same date range. At that site, daily sampling was conducted using mid-river and shoreline sampling and algorithms were formulated to adjust catches for sampling effort and river flow. Average stomach content weights of subyearling and yearling Chinook (0.7% and 0.6% of body weight) were lower in the tidal freshwater area of the CRE than at upstream sites and in other river systems and estuaries. However, intensive feeding was apparent in most fish captured in the ocean. During the peak migration period, lack of feeding by yearling Chinook appeared to be related to the density of juvenile salmonid migrants. 3.3
Evaluating Cumulative Ecosystem Response to Restoration Projects in the Columbia River Estuary, 2004
•
•
•
•
•
•
•
Average sizes of fish (yearling and subyearling) sampled from mid-river sites were larger than those from intertidal areas. Evaluation of marked groups suggested that this was not related to sampling method or gear selectivity, but rather to differences in stocks sampled and migration behavior of different sized fish within those stocks. Generally, the largest fish within hatchery and wild groups migrated the fastest from natal stream/release site to the estuary and conversely, smaller fish had protracted migrations and thus utilized the habitats and food resources along the migration route more extensively. Average movement rates through the estuary (rkm 75 to rkm 16) in 1978-1980 were similar to riverine movement rates (13, 19, 23, and 44 km d-1, respectively, for hatchery subyearling and yearling Chinook salmon, coho salmon, and steelhead). Movement rates to and through the estuary generally increased in relation to greater migration distance, higher river flows, greater body size, and level of smoltification. Residence time in the estuary was substantial (up to 90 days) for some fish migrating from locations upstream from Bonneville Dam and Willamette Falls, regardless of fish size. Subyearling Chinook salmon originating from lower river tributaries and sporadic groups of yearling Chinook and coho salmon displayed protracted residence in the estuary (up to 103 days, 90 days, and 32 days respectively). In 1982/83 (moderately high flow years), nearly half of fall released spring Chinook salmon from several stocks in the Lower Columbia, Willamette, and Snake Rivers over-wintered upstream of the estuary and migrated to the ocean in the spring. The smaller fish of these stocks showed the greatest tendency to over-winter. Many unmarked Chinook salmon fry were captured at rkm 75 from March through May, but few were captured at rkm 7. These fish were assumed to be naturally reared, based on prevailing hatchery policies of WDFW, ODFW and USFWS that restricted release of unfed fry (Environmental and Technical Services Division, NMFS, Portland OR., pers. comm. to E. Dawley, 1980). After May, confusion with small hatchery fish negated the ability to assess the presence of naturally reared fish. Wild subyearling and yearling Chinook salmon were similar to hatchery groups from the same geographical areas in their migrational timing, size, and catch percentages (based on mark recoveries from 2,293 subyearling and 35 wild yearling fish emigrating from the Deschutes, Lewis, Warm Springs and John Day rivers).
3.1.5 Study Years 1980 - 1981 Durkin et al. (1981) and McConnell et al. (1983), as part of the Columbia River Estuarine Data Development Program (CREDDP), used traps, beach and purse seines, and trawls to capture juvenile salmonids (~17,000 unmarked and 750 marked from 63 sites). The objectives were to relate salmonid use of the estuary with parameters such as distribution, duration, available food resources, and feeding intensity (McCabe et al. 1983; Bottom et al. 1984; McCabe et al. 1986). Monthly sampling was conducted throughout the year. Data and descriptions provide the following conclusions:
• •
Migrational timing was similar to that of juvenile salmonids from other river systems and yearling fish were absent after June. Fork lengths indicated subyearling Chinook salmon captured in mid-river were larger than individuals captured in intertidal areas and those captured in the lower estuary (saltwater transition zone) were slightly larger than those in the upper estuary (tidal freshwater zone).
3.4
Evaluating Cumulative Ecosystem Response to Restoration Projects in the Columbia River Estuary, 2004
• •
•
Subyearling Chinook salmon captured in intertidal areas had greater gut content than those captured in pelagic areas. Although diet overlap among species was evident, food resources seemed not to be limiting for juvenile salmonids in the estuary. The most utilized food resources varied temporally and spatially. Subyearling Chinook salmon consumed Corophium salmonis and adult dipterans in intertidal habitats and Daphnia spp. in pelagic habitats during summer. Abundance was not equated to catch (J. Durkin and R. McConnell, pers. comm. to E. Dawley, 1984).
3.1.6 Study Years 1995 - Present Since 1995, pair trawling in mid-channel during the spring has been conducted annually, targeting salmonids tagged with passive integrated transponder (PIT) tags (Ledgerwood et al. 2004). Sampling occurs in mid-channel at the tidal freshwater zone at Jones Beach (rkm 75), and, in 2003-2004, at an additional site in the lower estuary downstream from rkm 16. Nearly 80,000 individual PIT-tagged fish have been recorded. The goal was to sample about 2% of fish passing along the migration corridor to the estuary during the spring, including fish that had remained in-river through their migration and those released from transportation barges. Both wild and hatchery fish were detected from stocks originating primarily from upper river basins. Yearling salmonids dominated the samples except in 2002 when extended sampling through July targeted Snake River fall (subyearling) Chinook salmon. The main conclusions from the study are as follows:
•
•
•
Yearling salmonids move rapidly to and through the tidal freshwater portion of the lower Columbia River, and much of the daily variation in travel speed was related to variations in river flow volume. Travel speeds to the estuary from barge-release sites or detection at Bonneville Dam were about 80 km d-1 in a normal flow year and about 60 km d-1 in a lowflow year. Travel time from Jones Beach to the estuary was correlated with tidal patterns based on arrival timing at the upstream sample site, i.e., those arriving near high tide reached the lower sample site in as little as 16 hours and those arriving near low tide required as much as 41 hours to reach the lower site. There was little indication that individual fish delayed in the tidal freshwater zone. However, differences in arrival time at Jones Beach between fish released from a common site and date indicate individual variation in dispersal and habitat use.
3.1.7 Study Years 1997 - Present For nearly a decade, Schreck et al. (2004), using radio and acoustic tags, followed Snake River-origin juvenile salmonids (ocean and river type) to and through the estuary, assessing migration behavior and survival of transported and run-of-the-river migrants. Migration paths, movement rates, and losses to avian predation were the secondary focus of research. The main findings are as follows: • • •
Generally, yearling steelhead and salmon migrated rapidly to and through the freshwater portion of the estuary (averaging from 2.7 – 3.4 km h-1 for the slowest subyearling Chinook migrants to 4.1 km h-1 for the fastest steelhead migrants; Schreck et al. 2002). In the saltwater transition zone, incoming tides briefly arrested downstream movement and for the smallest fish caused upstream movement. Salmon tended to follow the major water flows through the saltwater transition zone to the ocean.
3.5
Evaluating Cumulative Ecosystem Response to Restoration Projects in the Columbia River Estuary, 2004
•
Tagged fish suffered substantial avian predation in passage through the estuary.
3.1.8 Study Years 2001 - Present Roegner et al. (2004) used beach seines and trap nets to capture juvenile salmonids (>8000 fish) from four sites in the estuary (rkm 5-11), threes sites in the tidal freshwater zone near rkm 62, and from four sites within emergent and forested wetlands areas of Cathlamet Bay (near rkm 40). Samples were evaluated for variations in fish community structure in relation to seasonality and hydrology. Subsets of salmonids were retained for laboratory analysis of scales and otoliths to determine estuarine use, genetic identification of stocks, and analysis of stomach contents to determine trophic resource utilization. Monthly sampling was conducted throughout the year. This research is currently underway and the following conclusions are preliminary:
3.2
•
At beach seine sites, abundance and distribution patterns of salmon were similar during three years of sampling. Subyearling Chinook salmon made substantial use of nearshore intertidal habitats and were captured year round with peak abundance in April-July.
•
Chum salmon were concentrated in the estuary during a narrow temporal window (FebApril). Few coho salmon were captured.
•
On a given date, Chinook salmon tended to be more abundant but substantially smaller at tidal freshwater compared to estuarine stations. Salmon at all sites increased in mean size with time over the season.
•
Salmon were found in most wetland areas investigated. Abundance dropped off abruptly after August, likely due to excessive temperatures.
•
Salmon in tidal freshwater areas and marsh habitats fed largely on Corophium spp. and terrestrial insect prey. Fish in estuarine areas had a wider diet that included marine fish and crab larvae.
•
Additional information is forthcoming on juvenile salmon habitat use derived from analyses of otoliths, scales, and genetics.
Research, Restoration, and Recovery of Salmon Stocks
The Columbia River estuary serves as both a migration corridor to the ocean and, for particular stocks, as important habitat for juvenile rearing. Today’s focus on mass production of the river-type life history for up-river stocks of spring/summer Chinook salmon, which generally move through the estuary rapidly, belies both historical and recent evidence of protracted habitat use of the lower river and estuary as described in the preceding section. Much of this habitat has been largely isolated, degraded, or destroyed (Thomas 1983). The goal of restoration activities is to repair habitat connectivity and function, and thereby allow fish to regain benefits that have been shown to accrue from estuarine rearing areas on the U.S. Pacific Coast (e.g., Reimers 1973; Healey 1980, Healey 1982; Levy and Northcote 1982, Levings et al. 1986; Levings et al. 1991, Levings 1994, Magnusson and Hilborn 2003). The recovery of salmonid stocks requires supporting the diversity of life history patterns that historically mitigated for environmental variability (Bottom et al. in press; Burke 2004, NOAA 2004). The research summarized in this chapter clearly shows the extensive use of CRE habitats by juvenile salmon. While stock identification of these groups is imperfectly known, the majority of these fish appear 3.6
Evaluating Cumulative Ecosystem Response to Restoration Projects in the Columbia River Estuary, 2004
to be ocean-type subyearling fall Chinook salmon and lower river chum salmon. Some proportion of upriver populations also exhibit extended use of tidal freshwater and estuarine habitats. Importantly, habitat restoration in the lower river and estuary will benefit all stocks with populations exhibiting ocean-type migration patterns, including those which are at present severely depressed. Measurement of salmonid habitat use and stock recovery is problematic because individual stock identification remains elusive. Furthermore, in the 1960s, 1970s, and 1980s, when hatchery stocks of subyearling Chinook salmon were representatively marked, substantial variation in temporal (annual and interannual) and spatial distributions of stocks were observed (Reimers and Loeffel 1967; Durkin et al. 1981; McConnell et al. 1983; McCabe et al. 1986; Dawley et al. 1986; Bottom and Jones 1990). Thus, measures of habitat residence time and the contribution of various life-history strategies to spawner success require tagging many individuals over varied environmental conditions. Historical sampling in the Columbia River was not focused on differentiating fish use among estuarine habitat types except for one and a half years of monthly sampling within CREDDP (Durkin et al. 1981). Although large numbers of marked fish were emigrating at that time, the data were insufficient to evaluate survival related to use versus non-use of estuarine habitat (Durkin et al. 1981). In lieu of direct marking of individuals, present research endeavors utilize a suite of physical and biochemical methods, such as genetics and otoliths, to help quantify estuarine habitat use (Roegner et al. 2004). Past and ongoing evaluations of juvenile salmonid food resources and of gut contents from captured fish provide an understanding of the environs that captured fish had visited prior to capture (McCabe et al. 1986; Roegner et al. 2004). In future sampling, salmonid use of particular habitat types within the estuary may be indirectly identified from ingested prey and in turn may provide information on ecological characteristics supporting important food resources. There remains a need for specific research projects designed to evaluate habitat use in restored and natural areas of the CRE. Such research has been conducted in other Pacific Coastal estuaries such as the Chehalis, Coos, Fraser, and Salmon, and in Puget Sound (e.g., Levings 1991, Miller and Simenstad 1997, Cornu and Sadro 2002, Gray et al. 2002); however, the applicability of conclusions from these unique systems to the CRE cannot be assumed. Research and monitoring are required to document and assess the long-term and cumulative effects of habitat restoration on the CRE and specifically on the recovery of salmonid stocks.
3.3
Literature Cited
Bottom, D. L., K. K. Jones, and J. J. Herring. 1984. Fishes of the Columbia River Estuary. Internal report, Available from Columbia River Data Development Program, Astoria, Oregon (Managed by Columbia River Estuary Taskforce, WW.columbiaestuary.org) Bottom, D. L., and K. K. Jones. 1990. “Species composition, distribution, and invertebrate prey of fish assemblages in the Columbia River Estuary,” Prog. Oceanog. Vol. 25, pp. 243-270. Bottom, D.L., C.A. Simenstad, A.M. Baptista, D.A. Jay, J. Burke, K.K. Jones, E. Casillas and M. Schiewe. In Press (draft 2001). Salmon at River’s End: The role of the estuary in the decline and recovery of Columbia River salmon. University of Washington Press and NOAA-National Marine Fisheries Service, Seattle, WA. 271p.
3.7
Evaluating Cumulative Ecosystem Response to Restoration Projects in the Columbia River Estuary, 2004
Bottom, D.L. 2004. Estuarine habitat and juvenile salmon – Current and historic linkages in the lower Columbia River and estuary. Research Proposal to US Army Corps of Engineers, Portland District, Portland Oregon. 47p. Burke, J.L. 2004. Life histories of juvenile Chinook salmon in Columbia River Estuary, 1916 to the present. Master Thesis, Oregon State University. August, 2004. 88p. Cornu, C. and S. Sadro. 2002. Physical and functional responses to experimental marsh surface elevation manipulation in Coos Bay’s South Slough. Restoration Ecology 10(3):474-486. Dawley, E. M., R. D. Ledgerwood, T. H. Blahm, C. W. Sims, J. T. Durkin, R. A. Kirn, A.E. Rankis, G. E. Monan, and F. J. Ossiander. 1986. Migrational characteristics, biological observations, and relative survival of juvenile salmonids entering the Columbia River estuary, 1966-1983. Report to Bonneville Power Admin., DACW57-85-F-0623, 256 p. (Available from Dick Ledgerwood, NMFS, P.O. Box 155 Hammond OR, 977121. (503) 861 1818 ex 13. Dawley, E. M., R. D. Ledgerwood, and A. L. Jensen. 1985a. Beach and purse seine sampling of juvenile salmonids in the Columbia River estuary and ocean plume, 1977-1983; Volume II; Data on Marked Fish Recoveries. U.S. Dep. Commer., NOAA Tech. Memo. NMFS, F/NWC-75:1-397. Dawley, E. M., R. D. Ledgerwood, and A. L. Jensen. 1985b. Beach and purse seine sampling of juvenile salmonids in the Columbia River estuary and ocean plume, 1977-1983; Volume I; Procedures, Sampling Effort and Catch Data. U.S. Dep. Commer., NOAA Tech. Memo. NMFS, F/NWC-74:1260. Durkin, J.T., T. Blahm, G. McCabe, T. Coley, R. McConnell, R. Emmett, and W. Muir. 1981. Columbia River Estuary Data Development Program Report: Salmonid and Anon-salmonid fish. Vancouver, WA: Pacific Northwest River Basins Commission. 146 Fulton, L. A. 1968. Spawning areas and abundance of Chinook salmon (Oncorhynchus tshawytscha) in the Columbia River basin - past and present. U.S. Fish and Wildlife Service, Special Scientific Report. Fisheries No. 571, 26 pp. Gray, A., C.A. Simenstad, D.L. Bottom, and T.J. Cornwell, 2002. Contrasting functional performance of juvenile salmon habitat in recovering wetlands of the Salmon River estuary, Oregon, U.S.A. Restoration Ecology 10(3):514-526. Healey, M.C. 1980. Utilization of the Nanaimo River estuary by juvenile Chinook salmon, Oncorhynchus tshawytscha). Healey, M.C. 1982. Juvenile Pacific salmon in estuaries: the life support system. In V. S. Kennedy, (editor), Estuarine Comparisons, p. 315-341. Academic Press, New York. ISG (Independent Scientific Group). 2000. Return to the river: restoration of salmonid fishes in the Columbia River ecosystem. Northwest Power Planning Council Document 2000-12. Northwest Power Planning Council, Portland. 538 p. (Available on the internet at www.nwppc.org/return_toc.htm. Kareiva, P., M. Marvier, and M. VcClure. 2000. Recovery and management options for spring/summer Chinook salmon in the Columbia River Basin. Science Vol 290, pp. 977-979.
3.8
Evaluating Cumulative Ecosystem Response to Restoration Projects in the Columbia River Estuary, 2004
Kirn, R.A., R.D. Ledgerwood, and A.L. Jensen. 1986. Diet of subyearling Chinook salmon (Oncorhynchus tshawytscha) in the Columbia River estuary and changes effected by the 1980 eruption of Mount St. Helens. Northwest Science, Vol. 60, No. 3, pp. 191-196. Kukulka, T. and D.A. Jay. 2003a. Impacts of Columbia River discharge on salmonid habitat: 1. a nonstationary fluvial tide model. Journal of Geophysical Research 108(C9):3293. Kukulka, T. and D.A. Jay, 2003b. Impacts of Columbia River discharge on salmonid habitat: 2. changes in shallow-water habitat. Journal of Geophysical Research 108(C9):3294. Ledgerwood, R.D., F.P. Thrower, and E.M. Dawley. 1991. Diel sampling of migratory juvenile salmonids in the Columbia River estuary. Fish. Bull., U.S. 89:69-78. Ledgerwood R.D., B.A. Ryan, E.M. Dawley, E.P. Nunnallee, and J.W. Ferguson. 2004, A surface trawl to detect migrating juvenile Salmonids tagged with passive integrated transponder tags. North American Journal of Fisheries Management 24 (2): 440-451. Levings, C.D. 1991. Strategies for restoring and developing fish habitats in the Strait of Georgia—Puget Sound Inland Sea, Northeast Pacific Ocean. Marine Pollution Bulletin 23:417-422. Levings, C.D. 1994. Feeding behavior of juvenile salmon and significance of habitat during estuary and early sea phase. Nordic Journal of Freshwater Research 69:7-16. Levings, C.D., K. Conlin and B. Raymond. 1991. Intertidal habitats used by juvenile Chinook salmon (Oncorhynchus tshawytscha) rearing in the North Arm of the Fraser River Estuary. Marine Pollution Bulletin 22(1):20-26. Levings, C.D., C.D. McAllister, and B.D. Chang. 1986. Differential use of the Campbell River estuary, British Columbia, by wild and hatchery-reared juvenile Chinook salmon (Oncorhynchus tshawytscha). Can. J. Fish. Aquat. Sci. 43(7):1386-1397. Levy, D.A. and T.G. Northcote. 1982. Juvenile salmon residency in a marsh area of the Fraser River Estuary. Canadian Journal of Fisheries and Aquatic Sciences 39:270-276. Lichatowich, J. 1999. Salmon without rivers: a history of the Pacific salmon crisis. Island Press, Chicago. Magnussen, A., and R. Hilborn. 2003. Estuarine Influence on survival rates of coho (Oncorhynchus kisutch) and Chinook salmon (Oncorhynchus tshawytscha) released from hatcheries on the U.S. Pacific Coast. Estuaries 26(4B):1094–1103. McCabe, G.T. Jr., R.L. Emmett, W.D. Muir, and T.H. Blahm. 1986. Utilization of the Columbia River Estuary by Subyearling Chinook salmon. Northwest Science, Vol. 60, No. 2, pp.113-124. McCabe, G.T. Jr., E.D. Muir, R. L., and J.T. Durkin. 1983. Interrelationships between juvenile salmonids and nonsalmonid fish in the Columbia River Estuary. U.S. Bur. Fish., Bull. 81, No. 4, pp. 815-826. McConnell, R.; T. Blahm, G.Jr McCabe, T. Clocksin, T. Coley, J. Durkin, R. Emmett, and W. Muir. 1983. Columbia River Estuary Data Development Program data report: Salmonid and non-salmonid fish, Vol. 1-4, Columbia River Estuary Taskforce, Astoria, Oregon. Mighetto, L. and W.J. Ebel. 1995. Saving the salmon: A history of the U.S. Army Corps of Engineers’ efforts to protect anadromous fish on the Columbia and Snake Rivers. Prepared for U.S. Army Corps
3.9
Evaluating Cumulative Ecosystem Response to Restoration Projects in the Columbia River Estuary, 2004
of Engineers, North Pacific Division, Portland and Walla Walla Districts, 262 p. (Available from USACE, North Pacific Division, P.O. Box Custom House, Portland 97208) Miller, D.R., J.G. Williams, C.W. Sims. 1983. Distribution, abundance, and growth of juvenile salmonids off the coast of Oregon and Washington, summer 1980. Fish. Res. 2:1-17. Miller, J.A. and C.A. Simenstad, 1997. A comparative assessment of a natural and created estuarine slough as rearing habitat for juvenile Chinook and Coho salmon. Estuaries 20(4):792-806. Mullan, J.W., K.R. Williams, G. Rhodus, T. W. Hillman, and J.D. McIntyre. 1992. Production and habitat of salmonids in Mid-Columbia River tributary streams. U.S.F.W.S. Monograph I. 489 pp. Nehlsen, W., J.A. Lichatowich, J.E. Williams. 1991. Pacific salmon at the crossroads: Stocks at risk from California, Oregon, Idaho, and Washington. Fisheries: Vol. 16, No. 2, pp. 4-21. NOAA (National Oceanic and Atmospheric Administration), National Marine Fisheries Service, Northwest Fisheries Science Center, 2004. Endangered species act, status reviews and listing information. Available at http://www.nwr.noaa.gov/1salmon/salmesa. Reimers, P.E. 1973. The length of residence of juvenile fall Chinook salmon in Sixes River, Oregon. Oregon Fish Comm. Res. Rep. 4, 43 p. Reimers, P.E., and R.E. Loeffel. 1967. The length of residence of residence of juvenile fall Chinook salmon in selected Columbia River tributaries. Res. Briefs, Fish Comm. Oreg. 13(1):5-19 Rich, W.H. 1920. Early history and seaward migration of Chinook salmon in the Columbia and Sacramento Rivers. U.S. Bur. Fish., Bull. 37:2-73. Roegner, G.C., D.L. Bottom, A. Baptista, S. Hinton, C.A. Simenstad, E. Casillas, and K. Jones. 2004. Estuarine habitat and juvenile salmon – current and historical linkages in the lower Columbia River and estuary, 2003. Report of Research by Fish Ecology Division, NOAA Fisheries to Portland District U.S. Army Corps of Engineers. 41 pp. Schreck, D,B., D.B. Jepsen, S. Clements, and M.D. Karnowski. 2002. Abstract: Evaluation of migration and survival of juvenilie salmonids following transportation. Anadromous Fish Evaluatio Program Review. Nov 18-21, 2002. (Available from US Army Corps of Engineers, Portland District, P.O. Box 2946, Portland OR 97208) Schreck, C, B., S.P. Clements, M.D. Karnowski, and D.B. Jepsen. 2004. Evaluation of migration and survival of juvenile fall Chinook following transportation, 2003. Oregon Cooperative Fish and Wildlife Research Unit, Dept. of Fish. And Wildlife, 104 Nash Hall, Oregon State University, Corvallis, OR 97331. Sherwood, C.R., J.S. Creager, E.H. Roy, G.A Gelfenbaum, and T. Dempsey. 1984. Sedimentary processes and environments in the Columbia River estuary. Columbia River Estuary Study Taskforce. Astoria, OR. Thomas, D.W. 1983. Changes in the Columbia River estuary habitat types over the past century. Columbia River Estuary Data Development Program. 51 p. (Available from Columbia River Estuary Study Taskforce. P.O. Box 175, Astoria, OR 97103). Weitkamp, Laurie A. 1994. Effect of dams on Columbia River estuarine environment with special reference to salmonids. National Marine Fisheries Service, Seattle WA.
3.10
Evaluating Cumulative Ecosystem Response to Restoration Projects in the Columbia River Estuary, 2004
4.0 A Columbia River Estuary Conceptual Model This chapter presents an integrated conceptual model of the Columbia River estuary. The Columbia River Estuary Conceptual Model is intended to provide a technical basis for restoration planning, monitoring, and research needs identification. Thom et al. (2004) developed the latest version of the model for the U.S. Army Corps of Engineers’ General Investigations Study for the Columbia River Estuary. This model is described below and applied to the problem of assessing the cumulative effects of habitat restoration in the estuary. The model is available on the internet at www.nwp.usace.army.mil/pm/lcr/science.asp and a copy is provided on the CD attached to this report.
4.1 Background The technical understanding of the estuary and the specific actions required to both restore and monitor it are diverse and not well integrated. In order to assist in organizing the understanding of the estuary, as well as to provide a working basis for decisions on how best to restore the ecosystem, a conceptual model is needed. The conceptual model is an important element of estuary research, monitoring, and evaluation, as well as habitat restoration planning and cumulative effects assessment (Busch and Trexler 2003). Thom et al. (2004) reviewed and incorporated selected features from the several ecosystem and hydrodynamic models available for the Columbia River estuary: •
The U.S. Army Corps of Engineers (2001) included such a model as an appendix to the Biological Assessment for the Channel Improvements Project of the Corps of Engineers. The intent of this model was to provide a systematic approach to assessing the potential impacts from channel deepening. To this end, the various component boxes in the model were used as topics discussed in the biological assessment. The format of the model was kept very simple in order to be easy to follow. This resulted in a loss of information on the ecosystem because the known complexities were simplified (e.g., the food web).
•
Bottom et al. (2001) present the framework for a conceptual model in Salmon at River’s End, which is guiding salmonid research in the CRE. This model focuses entirely on juvenile use of the estuary. The report presents a comprehensive assessment of the potential aspects of juvenile salmon use of estuarine habitats. Using information on behavior and energetic requirements, swimming ability, bathymetry, and circulation modeling, Bottom et al. (2001) define zones within the estuary that are most likely utilized by ocean-type juvenile salmon. The model is guiding a comprehensive research program aimed at further elucidating estuarine conditions that would result in increased fitness of juvenile salmon populations. This information is critical to understanding what habitat should be restored, preserved, and protected to help salmon recover.
•
Although not specific to the Columbia River estuary, Proctor et al. (1980) developed an extensive ecosystem conceptual model for coastal systems of the Pacific Northwest. The strength of the Proctor et al. (1980) model lies in the details of major processes and cycles (e.g., element cycles) that are included. In addition, it presents a typology for various habitat complexes, as well as a scheme for ecosystem succession. Although comprehensive in its
4.1
Evaluating Cumulative Ecosystem Response to Restoration Projects in the Columbia River Estuary, 2004
coverage of typology and processes, it is not specific to any coastal or estuarine system and provides no quantification of processes. •
Numerical models covering various processes are either developed or under development for the Columbia estuary by Antonio Baptista (Oregon Graduate Institute), David Jay (Oregon Graduate Institute), and the Corps of Engineers. Baptista’s model has focused on circulation and water properties predictions, whereas Jay’s models and that of the Corps of Engineers focus on sediment dynamics. The strength of these models is that they incorporate forcing factors (e.g., climate, flow regulation) highly important to habitat formation and water properties in the estuary.
•
Tarang Khangaonkar (PNNL) recently developed a numerical hydrology model for the Chinook River estuary (Baker Bay). The model was designed to predict potential flooding of properties as a result of modifications of the tide gate at the mouth of the estuary.
A model that clearly and explicitly addresses the factors controlling habitat development and maintenance is needed because understanding these factors is critical to the successful restoration of habitats supportive of salmon that will be self-maintaining in the long run. The conceptual model presented here was developed to meet the following needs: 1. Integrate and consolidate the existing estuary ecosystem models as appropriate. 2. Provide an effective communication tool. 3. Form the basis for numerical models of the estuary. 4. Provide organization and focus for the research and assessment of cumulative effects of restoration.
4.2 Model Description At the core of the Columbia River Estuary Conceptual Model is the assumption that the structure of ecosystem complexes (i.e., the primary habitats) is formed through the actions of physical and chemical processes termed controlling factors. In turn, the habitats carry out ecological processes that result in ecological functions; i.e., structure and function are correlated. Finally, the model assumes that factors (i.e., stressors) that can affect the structure, processes, and functions of the ecosystem are acted upon primarily at the controlling factor level (Figure 4.1). As shown in Figure 4.1, the model has been constructed around the framework provided by the relationships between these five components.
4.2
Evaluating Cumulative Ecosystem Response to Restoration Projects in the Columbia River Estuary, 2004
Figure 4.1. Structure of the Conceptual Model For example, disturbances such as abnormal flooding events result in alterations to the controlling factors, with ramifications for habitat structure, processes and, finally, functions. Although this simple example ignores feedback loops as well as the direct effects of catastrophic events on functions, it provides a simple, logical sequence that can be followed to assess the potential impacts of natural and non-natural disturbances. The model is written in html format to enable the reader to follow such logical sequences by simply clicking on the hyperlinks of interest on the computer screen. An example screen showing controlling factors is shown in Figure 4.2. The illustration captures some of the main ecosystem complexes as well as stressors to the system. The model was designed to perform as a management tool. For example, the model organization provides a means to identify the major existing stressors or disturbances (e.g., dikes around former tidal
4.3
Evaluating Cumulative Ecosystem Response to Restoration Projects in the Columbia River Estuary, 2004
wetlands), which aid in planning the specific actions required to restore these systems. Data gaps in the model point to key research needs where information on linkages is weak or non-existent. Aspects of the system that show well developed and understood linkages would be most efficient and effective to include in a monitoring program that can also be elucidated by examination of the relationships between components of the model that are relevant to particular projects, sites, or habitat types.
Figure 4.2. Components of the Conceptual Model Following the latest thinking (Simenstad et al. 2004), we chose to describe habitat types that make up ecosystem complexes. A complex may include a variety of habitats such as deep channel, shallow subtidal slope, mud/sand flat, unvegetated sand (not used here), emergent marsh, and scrub-shrub forested wetland. We have added submerged aquatic vegetation to the Simenstad et al. (2004) list. The
4.4
Evaluating Cumulative Ecosystem Response to Restoration Projects in the Columbia River Estuary, 2004
complexes include not only the vegetated areas, but also the distributory channels and other features of natural habitats, and therefore represent natural landscape elements. The basis for using this typology is that landscape elements are believed to represent the requisite set of features utilized by many animal species. In addition, evolution of habitats proceeds as the development of complexes, disturbances are reflected in changes in the structure of ecosystem complexes, and restoration actions should focus on development of natural complexes through re-establishing the requisite set of controlling factors. Because the ecosystem complexes proposed by Simenstad et al. (2004) are in draft, the number and type of complexes may change. A conceptual model is intended to show key linkages between elements of the ecosystem, and can eventually be used as the basis for one or more comprehensive numerical models of the ecosystem. Where available, the model contains quantitative and semi-quantitative model equations. These equations are not necessarily developed specifically for the Columbia River estuary, but indicate models that could potentially be used to calculate and predict the effects of changes in the system. We made no attempt to link quantitative models. The model format was kept as simple as possible to maximize clarity and ease of use. Complexities are indicated as multiple linkages and in descriptive material provided within the model. We have also provided sources of information (e.g., links to web sites) containing numerical models (e.g., CORIE) of aspects of the system. The html format facilitates “navigation” throughout the model on a computer. Using this format, the model can easily be incorporated into an Internet web site where it would be available for wide use. Changes to information in the model can be updated simply by changing information contained in an Excel spreadsheet. Updates to the spreadsheet are automatically transferred to all appropriate locations in the model. This makes the model “live” and amenable to improvements as new interpretations and data become available. Figure 4.3 shows the home page for the model. The general format of the model, progressing from stressors to ecosystem complex functions illustrates how the model logic is set up. Selecting any one of the model buttons or any one of the titles in any category (Figure 4.2) takes the user to a page that treats the topic. For example, the emergent marsh page is shown in Figure 4.4. The page describes the topic and identifies what factors control the development of emergent marshes and what processes are affected by emergent marshes. It also highlights any numerical relationships between emergent marshes and other parts of the model. Finally, links to web sites are provided that provide useful and relevant information.
4.5
Evaluating Cumulative Ecosystem Response to Restoration Projects in the Columbia River Estuary, 2004
Figure 4.3. Home Page of the Conceptual Model
4.6
Evaluating Cumulative Ecosystem Response to Restoration Projects in the Columbia River Estuary, 2004
Figure 4.4. Emergent Marsh Page of the Conceptual Model
4.3 Conclusion This model brings together into one easily navigated electronic tool the information provided by existing models of subcomponents of the estuary, as well as the state of the science and knowledge of general estuarine controlling factors, stressors, structures, processes, and functions. It provides a basis and structure in which knowledge about the Columbia River estuary, as it becomes available, can be incorporated through updates to a spreadsheet. For example, as new information is posted to the World Wide Web by organizations conducting research in the estuary, hyperlinks to this information can be
4.7
Evaluating Cumulative Ecosystem Response to Restoration Projects in the Columbia River Estuary, 2004
added to the spreadsheet to keep the model up to date. The model also has the potential to be further developed by additions such as a) comprehensive literature lists concerning each aspect of the estuary, b) contact information for key researchers in various areas of the estuary, c) full maps of the historical and present conditions of the habitats; d) more links to monitoring information such as the U.S. Geological Survey water quality data; e) linkages to regional climate models and ocean circulation models; f) an adaptive management module; and g) linkages to site maps where research, monitoring, and restoration are presently being conducted, with meta data on these activities. Once implemented, the model will allow updates, corrections, and additional linkages to information as it becomes available. This synthetic model has been designed for use by estuary managers on a personal computer; it also can easily be transferred to a website and thus made accessible by the public and staff with the numerous agencies and organizations currently working in the estuary. As a key tool for adaptive management (Thom 2000), it can be updated as our knowledge of the estuary increases through fundamental and applied research and restoration actions. A conceptual model can be a critical element of a cumulative effects study. In order to understand the potential effects of actions on an ecosystem, it is important to understand the relationships between components of the ecosystems as well as where and how stressors or restoration act on the ecosystem. In evaluating the effects of natural variability versus human stressors on ecosystems, Luoma et al. (2001a,b) found that organizing the understanding of the relative role of various sources of variation was critical to establishing testable hypotheses about the stressors. Thom et al. (2001) provide a conceptual model showing how the potential disturbances of hydrological processes would affect hydrological functions in wetlands located in urbanized landscapes. Hydrology was determined to be the key factor controlling wetland development and function, and most disturbances either directly or indirectly affected hydrology. This assessment (Thom et al. 2001) simplifies how best to prevent further degradation of wetland function, as well as how to efficiently restore wetlands. Finally, Simenstad et al. (2000) provide examples of how conceptual landscape structure models are emerging from empirical studies of juvenile fish use of Pacific Coast estuarine wetland ecosystems. The present conceptual model illustrates some of the complexity in the CRE ecosystem and identifies the linkages between stressors and controlling factors through ecosystem functions. Thus, the model provides the initial framework for organizing questions about, for example, what restoration actions would most benefit salmonids. Growing evidence suggests that the smallest juvenile salmon require shallow, quiescent areas for rearing and feeding (Bottom et al. 2001). The model indicates that these types of habitats are developed by several factors such as hydrology, sedimentation, salinity, current velocities, etc., any or all of which may require restoration in order to restore juvenile salmon. Relative to cumulative effects of multiple restoration projects, the model also indicates that potential metrics for quantification of the effects of multiple restoration projects might include marsh macrodetritus delivery to the system, area of restored habitat, channel diversity and morphology, marsh surface accretion, nutrient processing, altered current velocities, and increased flood storage capacity. This list represents the best available understanding upon which hypotheses can be developed and tested. All of these factors bear at least a strong conceptual relationship with both retuning the ecosystem to a semblance of its former state and enhancing the fitness of salmonids migrating through the system.
4.8
Evaluating Cumulative Ecosystem Response to Restoration Projects in the Columbia River Estuary, 2004
Finally, while this conceptual model doe not perform calculations, it does identify the factors that can go into a calculation of cumulative effects. For example, does increasing the wetted area result in an increase in marsh channel length and diversity, and thus rearing and feeding habitat for salmonids? Does the increase in marsh area add significantly to the macrodetritus pool, as well as reduce flooding in the system? How the metrics “add up” is the subject of the present study. The research conducted as part of this study and that of others will evaluate some of these metrics. As the research is conducted, the model provides a framework where new information can be inserted to update the understanding, and communicate the understanding to a wide audience.
4.4 Literature Cited Bottom, D.L., C.A. Simenstad, A.M. Baptista, D.A. Jay, J. Burke, K.K. Jones, E. Casillas, and M. Schiewe. 2001. Salmon at River’s end: the role of the estuary in the decline and recovery of Columbia River salmon. Draft by NOAA Fisheries, Seattle, Washington. Busch, D.E., Trexler, J.C., eds., 2003. Monitoring Ecosystems- Interdisciplinary Approaches for Evaluating Ecoregional Initiatives: Washington, D.C., Island Press, 447 p. Corps of Engineers. 2001. Biological Assessment of Columbia River Channel Improvements Project. Submitted to NMFS and USFWS. December 28, 2001. Portland, OR. Luoma, S.N., W.H. Clements, T. DeWitt, J. Gerritsen, A. Hatch, P. Jepson, T. Reynoldson, and R.M. Thom. 2001a. Role of environmental variability in evaluating stressor effects. Chapter 5, pages 141177 in D.J. Baird and G.A. Burton, Jr., editors, Ecological variability: separating natural from anthropogenic causes of ecosystem impairment. Society of Environmental Toxicology and Chemistry (SETAC), Pensacola, Florida. Luoma, S.N., W.H. Clements, J. Gerritsen, A. Hatch, P. Jepson, T. Reynoldson, and R.M. Thom. 2001b. Role of environmental variability in evaluating stressor effects. Chapter 6, pages 179-214 in D.J. Baird and G.A. Burton, Jr., editors, Ecological variability: separating natural from anthropogenic causes of ecosystem impairment. Society of Environmental Toxicology and Chemistry (SETAC), Pensacola, Florida. Proctor, C.M., J.C. Garcia, D.V. Galvin, T. Joyner, G.B. Lewis, L.C. Loehr, and A.M. Massa. 1980. An ecological characterization of the Pacific Northwest coastal region: Volume one: conceptual model. Biological Services Program, U.S. Fish and Wildlife Service, FWS/OBS-79/11, Washington, D.C. Simenstad, C.A., W.G Hood, R.M. Thom, D.A. Levy, and D.L. Bottom. 2000. Landscape structure and scale constraints on restoring estuarine wetlands for Pacific coast juvenile fishes. Pages 597-630 in M.P. Weinstein and D.A. Kreeger, editors, Concepts and controversies in tidal marsh ecology. Kluwer Academic Publ., Dordrecht, The Netherlands. Simenstad, C.A., J.L. Burke, I.R. Waite, T.D. Counihan, and J.R. Hatton. 2004. Lower Columbia River and estuary ecosystem classification: Phase I. Appendix A in Lower Columbia River Estuary Partnership, Columbia River Estuary Habitat Monitoring Plan. DRAFT. Lower Columbia River Estuary Partnership, Portland, Oregon. Thom, R.M., A.B. Borde, N.R. Evans, C.W. May, G.E. Johnson, and J.A. Ward. 2004. A Conceptual Model for the Lower Columbia River Estuary. PNNL-SA-43444. Report to the US Army Corps of
4.9
Evaluating Cumulative Ecosystem Response to Restoration Projects in the Columbia River Estuary, 2004
Engineers, Portland District. Portland, Oregon. Available URL: www.nwp.usace.army.mil/pm/lcr/science.asp Thom, R.M., A.B. Borde, K.O. Richter, and L.F. Hibler. 2001. Influence of urbanization on ecological processes in wetlands. Pages 5-16 in Land use and watersheds: human influence on hydrology and geomorphology in urban and forest areas. Water and Science Application Volume 2. American Geophysical Union, Washington, D.C. Thom, R.M. 2000. Adaptive management of coastal ecosystem restoration projects. Ecological Engineering 15:365-372.
4.10
Evaluating Cumulative Ecosystem Response to Restoration Projects in the Columbia River Estuary, 2004
5.0 Standard Monitoring Protocols and Methods to Assess Restoration of Salmon Habitat in the Lower Columbia River and Estuary The recovery of salmonid stocks requires supporting the diversity of life history patterns that historically mitigated for environmental variability (Bottom et al. in press; NOAA 2004). Research on salmon distribution patterns in the lower Columbia River and estuary (Chapter 3) as well as other West Coast estuarine systems indicates protracted use of tidal freshwater and estuarine habitats by diverse stocks of subyearling and yearling salmonids (e.g. Reimers and Loeffel 1967; Healey 1980; Levy and Northrote 1982; Shreffler et al. 1990, 1992; Levings et al. 1991; Levings 1994; Sommer et al. 2001; Tanner et al. 2002),. Much of this historically abundant habitat has been isolated, degraded, or destroyed (Thomas 1983; Burke 2004). The goal of restoration activities is to repair conductivity and function of these habitats, to thereby allow fish to regain benefit from these important rearing areas. However, researchers and managers require the means to 1) evaluate the effectiveness of individual restoration activities (Roni et al. 2002), 2) allow comparison between projects (Neckles et al. 2002; Williams and Orr 2002), and 3) determine the long-term and cumulative effects of habitat restoration on the overall ecosystem (Chapter 2; Steyer et al. 2002). This can best be achieved with a standardized set of research and monitoring metrics. A review of the literature uncovered many excellent examples of restoration monitoring theory and design (e.g., Simenstad et al. 1991; Callaway et al. 2001; Hillman 2004; Rice et al. 2005), yet none concisely outlined procedures particular to the CRE. The intent of this chapter, therefore, is to provide the rationale and procedures for standardized metrics specific to the tidal waters of the Columbia River estuary. The ultimate goal for applying these methods, to be fully realized perhaps decades from now, is to compile a compatible time series database of physical and biological metrics collected from many individual restoration projects. This dataset will enable evaluation of the effectiveness of individual restoration projects, as well as the cumulative effects of many restoration projects, on improving salmon habitat in the CRE. Protocols for sampling the monitored attributes are provided in Section 5.5.
5.1 Background The lower Columbia River and estuary have been highly modified by human activities that converted tidal wetlands into agricultural and commercial uses. Construction of dikes, docks, roads, and tide gates and alterations such as dredging and filling have destroyed habitat and disconnected large areas of emergent and forested wetlands from tidal inundation. The result is the loss of over 70% to 90% of the productive wetlands in both estuarine and tidal freshwater regions of the lower Columbia River, including important spawning and rearing habitat for several Evolutionarily Significant Units (ESUs) of salmonids (Thomas 1983; Simenstad et al. 1992; Kukulka and Jay 2003a,b; Weitkamp 1994). Today there is growing momentum to reverse these land use patterns and specifically to reconnect historical wetland areas to the influence of tidal inundation. The challenge we face is how to evaluate the effects of various restoration projects on wetland function, given that the goals, scales, resources, and managing partnerships of projects vary greatly. To this end, there has been a regional movement in the 5.1
Evaluating Cumulative Ecosystem Response to Restoration Projects in the Columbia River Estuary, 2004
Pacific Northwest and elsewhere to standardize measurement metrics and techniques that will facilitate comparison between restoration studies over time (Neckles et al. 2002; Callaway et al. 2001; Action Agencies 2003; Hillman 2004; Rice et al. 2005). Standardized metrics are required to provide the best possible input to managers making decisions regarding habitat restoration. The incentive for many restoration activities in the CRE involves increasing habitat for rearing and migrating juvenile salmonids listed as threatened or endangered under the Endangered Species Act (ESA). Salmon stocks that will most directly benefit from restoration activities in the CRE are the wild and hatchery-reared ocean type Chinook salmon, chum salmon, and stream-type coho salmon from lower river tributaries (Reviewed in Chapter 3). However, migrants from tributaries throughout the Snake, and Upper- and Mid-Columbia River systems are thought to have utilized estuarine habitat in the early 1900s, prior to extensive dam construction and loss of shallow water and wetland habitat (Rich 1920; Weitkamp 1994; Burke 2004; Lichatowich and Mobrand 1995). While most individuals from the surviving ESUs of upriver stocks currently migrate rapidly through the estuary to the ocean, some individuals of those groups (usually the smallest and latest migrants) display a protracted migration to and through the estuary and presumably gain enhanced growth and survival prior to ocean entry (Dawley et al. 1986, Chapter 3). Thus, while the greatest use of estuarine habitats is expected from fish originating in lower river tributaries, threatened and endangered salmon from upriver tributaries are also expected to benefit from increased habitat opportunity. In the following section, we summarize the types of restoration strategies being planned and implemented in the CRE. We then propose a minimum set of metrics and sampling design for restoration monitoring activities based on commonly shared ecological goals. Finally, we provide specific protocols for this set of estuary monitoring metrics.
5.2 Types of Restoration Strategies in the CRE Various types of restoration activities are occurring throughout the CRE region in an effort to recover lost habitat types (Figure 5.1). These activities fall under five broad strategies as described below and summarized in Table 5.1 (Johnson et al. 2004). The protocols we provide deal specifically with creation, enhancement, and restoration activities. Unless stated otherwise, the term “restoration” includes the various strategies described below.
5.2
Evaluating Cumulative Ecosystem Response to Restoration Projects in the Columbia River Estuary, 2004
Figure 5.1. Extent of Restoration Activities in the Columbia River Estuary
5.3
Evaluating Cumulative Ecosystem Response to Restoration Projects in the Columbia River Estuary, 2004
5.2.1 Conservation Conservation strategies are perhaps the broadest, encompassing many types of applications ranging from large-scale sustainable ecosystem initiatives down to small-scale, reach-specific conservation easements. These practices are geared toward increasing the potential for natural processes to work for the benefit of multiple species and include direct payments or other financial incentives to the landowner intended to offset any economic loss resulting from managing the land for conservation. Examples include financial support for the implementation of riparian setbacks and improved agricultural practices such as manure management, the addition of riparian buffer strips, integrated pest management, and offstream livestock watering techniques.
5.2.2 Creation Habitat creation involves constructing or placing habitat features where they did not previously exist in order to foster development of a functioning ecosystem. Habitat creation represents the most experimental approach and, therefore, is likely to have a lower degree of success, particularly when landscape ecological processes are not sufficient to support the created habitat type. Examples include tidal channel excavation and the placement of dredge material intended to create marsh or other habitat.
5.2.3 Enhancement Habitat enhancement is the improvement of a targeted ecological attribute and/or process. Enhancement projects in the CRE include tide gate or culvert replacement, riparian plantings and fencing, invasive species removal, and streambank stabilization.
5.2.4 Restoration Restoration activities are designed to return degraded habitat to a state closer to the historical ecological condition. This can involve more intense modification and manipulation of site conditions than occurs with enhancement projects. The most common restoration approach in the CRE is tidal reconnection through dike breeching and/or dike removal. The selected monitoring metrics of this manual are specifically chosen to track ecosystem changes resulting from this type of restoration treatment.
5.2.5 Protection Habitat protection projects can involve a variety of approaches, but the most common is land acquisition. Another option is to invoke land use regulations in the form of zoning designation and/or protection ordinances, such as defined riparian setbacks and designation of critical areas. Several organizations in the study area (for example the Columbia Land Trust and the Nature Conservancy) are applying these techniques to acquire ownership or development rights to intact patches of habitat or critical areas in need of further restoration treatments. Land use regulations are included in comprehensive plans, shoreline management master programs, floodplain management plans, and coastal zone management plans.
5.4
Evaluating Cumulative Ecosystem Response to Restoration Projects in the Columbia River Estuary, 2004
Table 5.1. Restoration Strategies, Examples of Project Types, and Targeted Ecosystem Benefits for the CRE (from Johnson et al. 2003) Strategy
Project Type
Targeted Ecosystem Benefit
Conservation
Land conservation
Limits land use impacts harmful to salmon habitat such as sediment, contaminants, nutrient loading.
Easements
Benefits ecological features through legal protection of critical areas, potentially allowing for complimentary restoration strategies to take place.
Riparian fencing
Deters livestock from degrading stream-side areas.
Manure management
Minimizes the inputs of nutrients and bacteria into stream corridor.
Material placement
Mimics habitat function and complexity through the placement of material at a given elevation.
Tidal channel modification
Restores more natural flows and mimics tidal channel structure.
Riparian plantings
Promotes water temperature reduction, contaminant removal, connection of terrestrial habitat corridors, sediment reduction, and water storage; future source of large woody debris input.
Tide gate/culvert replacement
Promotes water temperature reduction, dissolved oxygen availability, increased habitat access.
Invasive species removal
Increases opportunities for native species propagation.
Bioengineered streambank stabilization
Reduces sediment load, diffuses hydrologic energy.
Riparian fencing
Protects riparian zones from disturbances.
Tide gate removal
Restores partial or full hydrologic connection to slough habitat improving water quality, access to lost habitat types and processes, and potential removal of invasive plant species.
Dike breaching
Provides similar benefits as tide gate removal, this application requires significant earth moving activities to allow tidal energy to influence historic slough signatures and can involve tidal channel excavation
Culvert upgrades/culvert installation
Provides similar benefits to above restoration activities through the improvement of water quality, access to lost habitat types and processes, and potential removal of invasive species.
Elevation adjustment
Restores elevation of site to level that will support appropriate wetland vegetation.
Land acquisition
Preserves existing intact ecological features, functions, and processes at site scale and/or enables the application of additional strategies without human land use constraints.
Land use regulations
Limits or prohibits potentially harmful land use activities on or adjacent to the land surrounding the site, thereby protecting habitat-forming processes and features.
Creation
Enhancement
Restoration
Protection
5.5
Evaluating Cumulative Ecosystem Response to Restoration Projects in the Columbia River Estuary, 2004
5.3 Minimum Monitored Metrics in the CRE The CRE comprises a unique continuum of wetland ecosystems strongly influenced by river flow, salinity, and tidal amplitude. Unlike streams in nontidal upland regions and above Bonneville Dam, in the CRE semidiurnal and spring-neap variation in water level imposes a dominant structuring force on both geophysical parameters and biota (Rice et al. 2005). Water elevation fluctuations, keyed to site topography, directly determine periods of inundation and salinity intrusion (Kukulka and Jay 2003a, b) and this in turn structures plant communities and fish habitat use (Cornu and Sadro 2002). The tidal cycle controls the magnitude and duration of bidirectional current velocities that cause sedimentation/erosion and the evolution of geomorphological features like tidal channels and levees (Hume and Bell 1993). Tidal currents additionally affect the spatio-temporal distribution of water quality parameters such as salinity and temperature, and the transport of organic and inorganic materials that affect organism abundance and growth (Roegner 1998). Many restoration projects in the CRE will be tidal reconnections; our metrics reflect this and were specifically chosen to measure changes in hydrology due to restoration activities as well as the physical and biological response in the wetland.
5.3.1 Metric Selection Criteria The decision-making process culminating in the suggested monitoring metrics was based on several interrelated criteria. First, metrics need to be diagnostic of some relevant ecosystem function and directly need to correspond to commonly held goals among the restoration projects in the CRE (Thom and Wellman 1996). Second, we followed NRC (1992) guidelines that at least three classes of monitoring attributes be tracked: one for controlling factors (e.g., tidal regimes), one for structural factors (e.g., fish community structure), and one for functional factors (e.g., vegetation growth). Third, metrics should be potentially applicable to all sites with measurements that result in comparable datasets relevant to both present and future investigations (Tegler et al. 2001). Finally, measurements and data analysis must be practical in terms of funding, manpower, and processing requirements (Callaway et al. 2001). This last factor necessitates limiting the number of metrics to a “minimum” set and selecting measurement methods that are straightforward and economical to use. By “minimum,” we mean the smallest suite of metrics that can adequately detail the status and trends of restoration while acknowledging the financial and logistical limitations of comprehensively monitoring ecological change over an extended temporal and spatial scale. Ideally, all projects in the region would perform the minimum physical measurements, which we view as encompassing the fundamental forces on, and responses to, changes in the affected systems. Project goals for the biological variables (fish use or vegetation cover) may vary between studies. We encourage researchers to make additional measurements, especially process-related derivations of the minimum tier of monitored metrics (e.g., fish growth rate, consumption rate, and residence time). Higher order protocols such as these are under development at the time of this draft and are described in more detail in Chapter 2. The selection of relevant metrics developed from 1) a review of pertinent literature; 2) a meeting with local restoration managers (Appendix A), and 3) iterations of this draft document. We strove to keep the protocols accessible not only to scientists but to all staff and volunteers who potentially will be involved in restoration monitoring. Thus, the format and level of detail in the protocols reflect the larger purpose of standardizing data collection on restoration projects in the CRE, that is, the development of a regional database consistent enough to permit estuary-wide analyses. As discussed above, we are concentrating on 5.6
Evaluating Cumulative Ecosystem Response to Restoration Projects in the Columbia River Estuary, 2004
projects implementing tidal reconnection, a key ecological driver for a whole array of structural and functional attributes in the CRE. We found many relevant frameworks describing metrics important for monitoring restoration activities of potential salmonid habitat (although none were tailored specifically for the CRE), and we relied extensively on papers by Simenstad et al. (1991), Simenstad and Cordell (2000), Zedler (2001), Johnson et al. (2004), Hillman (2004), and Rice et al. (2005) to derive an initial set of potential metrics. These were augmented and expanded during a meeting with regional restoration managers (Appendix A). The process now continues with this draft document, which we submit for review and refinement of specific metrics and protocols.
5.3.2 Metrics Table 5.2 outlines the proposed set of minimum monitored metrics, their collection method, sampling frequency, and type, as well as their contribution to one of the three categories in an estuarine monitoring framework developed by Simenstad and Cordell (2000). We are advocating a combination of data logging instruments, on-site survey methods, and remote sensing techniques. 5.3.2.1 Hydrology (Water elevation) Hydrology is a main controlling factor of wetland evolution in the CRE, and it influences habitat structure and processes and ecological functions (Sanderson et al. 2000; Rice et al. 2005). Measuring water level variation is especially crucial for tidal reconnection restoration projects. Tidal forcing determines such processes as sedimentation/erosion, tidal channel development, inundation periods, and salinity intrusion. We advocate the use of automated data logging pressure sensors set to hourly frequency, which will record tidal, event-scale, and seasonal water elevation data. This method of data collection generates a time-series of measurements that can be compared between habitats and across seasons. Sensors can be “stand alone” or integrated into a water quality instrumentation package (below). 5.3.2.2 Water Quality (Temperature, Salinity, Dissolved Oxygen) Water quality parameters such as temperature, salinity, and dissolved oxygen play a determining role in species abundance and distribution in the CRE (OWEB 1999, Johnson et al. 2003). Most organisms have specific tolerances for water parameter ranges or rates of change (fluctuations). For example, temperature is a good predictor of juvenile salmon abundance and condition (OWEB 1999) and salinity is a main determinant of vegetation patterns (Thom et al. 2002). Oxygen concentration can control distribution of many organisms. We advocate the use of automated data logging multiprobe instruments for measuring time series of water quality parameters. Additional transect surveys with CTD probes provide vertical and horizontal spatial scale data useful to augment the spatially fixed time series data (Callaway et al. 2001). 5.3.2.3 Landscape Features Large-scale alterations of landforms and vegetation patterns often accompany wetland restoration activities (Tanner et al. 2002; Williams and Orr 2002). The measurement of spatial changes in biogeophysical features, such as evolution of tidal channel complexity, alteration in intertidal area, and succession of vegetation communities, is best accomplished by remote sensing using aerial imagery (e.g. Wright et al. 2000). Many technologies are available, including real color and near infrared aerial photography, hyperspectral imagery, digital aerial photography, high-resolution satellite imagery, and
5.7
Evaluating Cumulative Ecosystem Response to Restoration Projects in the Columbia River Estuary, 2004
LIDAR. Ground truthing during topographic/bathymetric surveys (below) is also required. Repeated measures over time are best analyzed using GIS to quantify the progress of restoration. 5.3.2.4 Bathymetry and Topography Hydrologic reconnection usually results in substantial alteration of geomorphic features such as location and sinuosity of tidal creeks, changes in the extent and slope of intertidal regions, and substrate characteristics (Cornu and Sadro 2002; Williams and Orr 2002). These landscape changes in turn affect (and are affected by) the composition, distribution, and abundance of biota, which often have distinct habitat requirements in wetland areas (Sanderson et al. 2000). Establishing the time course of bathymetric and topographic change at a restoration site is crucial for evaluating the progress of the restoration effort. We recommend detailed topographic and bathymetric surveys be made using differential GPS or Total Station survey techniques. Transect and survey designs are applicable. These techniques have wellestablished methodologies and should be coordinated with biological surveys described below. 5.3.2.5 Vegetation Changes Resulting from Tidal Reconnection Plant community composition can change rapidly following reconnection to a tidal hydrologic regime (Cornu and Sadro 2002; Roman et al. 2002) especially if the reconnection fosters salinity intrusion (Thom et al. 2002). Vegetation patterns confer both structural elements and ecological processes to wetland ecosystems, and may increase ecosystem capacity for foraging salmonids (Sommer et al.2001; Tanner et al. 2002). We recommend that measurement of changes in vegetation community structure be accomplished at both landscape-scale (described above) and through transect or ground survey techniques. Where projects include revegetation, the effectiveness of plantings can be determined by assessing subsequent survival and growth of transplants. 5.3.2.6 Fish Temporal Presence, Size/Age-Structure, and Species Composition The incentive for many restoration activities in the CRE involves increasing habitat for rearing and migrating juvenile salmonid ESUs listed as threatened or endangered under ESA (Thom et al. 2005). It is generally acknowledged that documenting “realized function” (Simenstad and Cordell 2000) is difficult because of the migratory nature of salmonids, while determining habitat capacity and opportunity are less problematic (Tanner et al. 2002). For minimum effectiveness monitoring, fish sampling should permit the evaluation of changes in community structure in restored locations compared with before treatment and control areas. We advocate conducting the most intense sampling effort across sites, habitat types, and time logistically possible. Additionally, it is highly desirable to determine “realized function” attributes, such as residence time, growth, and survival, which necessitate measuring metrics such as prey availability, prey consumption, age assessment, genetic stock identification, parasite load, and markrecovery data (e.g., Roegner et al. 2004).
5.8
Evaluating Cumulative Ecosystem Response to Restoration Projects in the Columbia River Estuary, 2004
Table 5.2. Summary of Monitored Attributes for Lower Columbia River and Estuary Restoration Projects. OPP = Opportunity Metric, CAP = Capacity Metric, FCT = Function Metric. Indicator Category
Monitored Metric
Collection Method
Physical Condition
Water Elevation Temperature Salinity DO Landscape features Bathymetry/ Topography
Datalogging Instrument Datalogging Instrument/ Transect Aerial Photo/GIS Ground Survey
Water quality
Habitat Inventory
Vegetation Habitat Characteristics
Fish Community Structure
Vegetation cover Planting Success rate Species composition Size structure Temporal presence
Ground Survey
Sampling Effectiveness Frequency Determination Physical Attributes Recovery Hourly Time series Hourly/ Recovery Seasonal Time series
Parameter Type
OPP
CAP
Controlling/ Functional Structural/ Functional
X
X
Recovery Survey Recovery Survey
Structural/ Functional Structural/ Functional
X
X
X
X
Biological Attributes Recovery Seasonal Survey Annual
Structural/ Functional Functional
X
X
Annual Annual
FCT
X
X X
Ground Survey
Seasonal
Recovery Survey
Functional
X X
5.4 Sampling Design The ability to detect ecological change due to restoration in a naturally varying environmental system is problematic (Osenberg et al. 1994). One effectiveness monitoring approach (Hillman 2004) relies on comparisons between measured values from sites separated both temporally (before versus after) and spatially (control versus impact). The Before After Control Impact (BACI) sampling scheme integrates both temporal and spatial elements into the effectiveness monitoring experimental design (Underwood 1991; 1992; 1993; Stewart-Owen and Bence 2001). The BACI design was therefore reviewed and considered for these protocols. The sequence of sampling events in BACI design is listed in Table 5.3. Monitored parameters are sampled simultaneously at two (or more) locations (control versus impact) before and after the restoration action (before versus after). The purpose of the BACI design is to test the hypothesis that there is no change between a control and a treatment site before and after impact. In contrast, the purpose of sampling restoration projects is to evaluate recovery, which requires testing the hypothesis that a treatment site recovers, without the ability to measure undisturbed conditions at the impact site. Therefore, recovery represents a change that is best measured by comparison to a relatively undisturbed reference site, as opposed to comparison to “before” conditions (cf. Miller and Simenstad 1997, Skalski et al. 2001, Hood 2002a, Thom et al 2002). It is recognized that difficulties can arise when choosing the control site in areas that have been highly modified, whereas at other sites there may be no opportunity to conduct adequate Before sampling (Steyer 5.9
Evaluating Cumulative Ecosystem Response to Restoration Projects in the Columbia River Estuary, 2004
et al. 2003). One solution is that, within the various ecological zones of the CRE, regional reference sites be identified and monitored. These areas can then provide a range of “target” conditions for restoration activities. The proposed design tests the “parallelism hypothesis” (Skalski et al. 2001). One selects a reference site that ideally represents a natural, minimally modified, or target condition. This site should be located in a nearby reference area subjected to similar large-scale climatic and environmental conditions, but be independent of activities affecting the impact site. The impact site would be within the restoration system and would be chosen to monitor target habitats or processes, such as tidal channels or marsh communities. All sampling techniques and sampling periods should be identical between reference and impact sites. These paired measurements are to be made before and after the restoration activity: the spatial and temporal replication of the measurements is dependent on the monitoring metric, the size of the restoration area, and logistics (Table 5.2). In contrast to the BACI design, however, this “accident response” model does not require multiple data collection times before impact, which in BACI are used to assess the variability between control and impact sites (Skalski et al. 2001). One measure of restoration “success” or performance is for values of post-restoration impact parameters (the monitored attributes) to converge with those of the reference site (Kentula et al. 1992, Raposa 2002). It should be emphasized that the ecological processes associated with a given restoration activity, such as breaching a dike, evolve for many years post-impact. A long-term monitoring commitment (5 to 10 years) is thus necessary for selected projects to adequately document the ecosystem response in relation to natural variation (Zedler 1988, Larsen et al. 2003, NOAA 2004). See Hillman (2004) for further discussion of these types of statistical comparisons. Within this sampling design, two primary data collection categories are likely to be employed in the CRE, depending on the parameter of interest: survey type and time series type of measurements. Survey type measurements are “snap shots” in the temporal frame and can include aerial photos, topographic surveys, vegetation surveys, and fish community sampling. Repeated measures over time are made for survey type measurements, while time series measurements, in contrast, consist of regularly timed recordings, usually from fixed spatial stations, and are typified by data logging instrumentation used to monitor water quality parameters. Time series analysis techniques such as spectral analysis most effectively capture trends in the data.
5.10
Evaluating Cumulative Ecosystem Response to Restoration Projects in the Columbia River Estuary, 2004
Table 5.3. The Sequence of Sampling Events in BACI Design A. Before Impact 1. Acquire digital aerial photograph of site (Protocol 3) a. Locate elevation and tidal benchmarks from website. b. Choose control and impact study areas. c. Choose survey transect locations. 2. Ground survey (at control and impact sites) a. Conduct topographic/bathymetric survey (Protocol 4) b. Deploy water quality and water elevation data loggers at surveyed locations (Protocol 1-2) c. Conduct vegetation/fish community survey (Protocol 5-6). B. Interim 1. Maintain data loggers. 2. Repeat vegetation/fish community surveys. C. After Impact 1. Repeat Steps A2b-c to acquire After data set. 2. Lab analysis using GIS to create: a. Layer digital (hyperspectral) photograph with topography/bathymetry to create a digital elevation map (DEM). b. Layer vegetation (if available) to create vegetation map. c. Use Before and After data sets to quantify physical and biological changes to site. 3. Compute fish community structure analysis (Protocol 6). 4. Repeat C 1-3 at designated frequency.
5.11
Evaluating Cumulative Ecosystem Response to Restoration Projects in the Columbia River Estuary, 2004
5.12
Evaluating Cumulative Ecosystem Response to Restoration Projects in the Columbia River Estuary, 2004
5.5
Monitoring Protocols for Columbia River Estuary Habitat Restoration Projects
1. Protocol for Assessing Hydrology (Water Elevation) PURPOSE Water level variation in wetlands is a function of river flow and tidal fluctuations. This variation largely drives wetland evolution in the CRE, with tidal fluctuations probably being the most deterministic for wetland restoration (Cornu and Sadro 2002). A key measure is change in tidal elevation within a restoration project due to tidal reconnection. The extent, period, and duration of tidal forcing will cause changes aerial exposure, circulation patterns in tidal creeks (including the distribution of water quality parameters such as salinity, temperature, and DO), sedimentation/erosion patterns and tidal creek evolution, and the distribution of vegetation and fishes. Water level data should be properly georeferenced (Protocol 3) and related to topography and vegetation patterns (Protocols 4 and 6) to determine inundation periods and vegetation response. This is thus a priority metric best measured with automated data logging pressure sensors. GOAL Measure the pattern of hydrology with respect to a reference point to record the timing, frequency, and duration of tidal inundation on reference and impact restored sites. DESIGN Recovery time series design. EQUIPMENT A. Field: Continuous water level recorders (Pressure Transducer), monumenting equipment (t-post, surveying equipment) B. Lab: Laptop computer, calibration and maintenance manual SITE SELECTION Primary site for data loggers in both impact and reference sites is near the mouth of the tidal reconnection site (but within the constriction). Additional dataloggers, if available, can be placed further in the system to gauge for lags in period and reductions in tidal amplitude.
SAMPLING PERIODICITY A. Minimum sample frequency of 1 hr.
5.13
Evaluating Cumulative Ecosystem Response to Restoration Projects in the Columbia River Estuary, 2004
B. Note that while tidal parameters may be predicted after a 2-3 month period of field data, water level sensors record river flow events as well as tide; combined effects of extreme events (storms) may not be easily predictable yet can have strong impacts on wetland development. SAMPLING PROTOCOL Automated instruments require proper placement to ensure comparable monitoring. Dataloggers should be secured subtidally with sensors positioned 50 to 75 cm below the anticipated lowest tide level but at least 25 cm above the substrate. Remember that hydrologic reconnections that increase tidal amplitudes will convert subtidal areas to intertidal zones. The instruments can be attached to existing structures such as pilings or attached to a permanent monument made of PNV or aluminum poles driven into the substrate. The vertical height of the sensor needs to be accurately surveyed (Protocol 3). Record location of data logger with GPS, and periodically visit data loggers to check for fouling or damage. Where required, be sure to calibrate sensors before each deployment. CALCULATIONS & ANALYSIS A. Primary output from dataloggers is time series of water levels. These relative heights should be converted into height relative to the standard elevation datum (mean lower water level) for comparison between sites and as a reference to site topography. Data should be presented to contrast water level fluctuation at reference and impact sites pre- and post-restoration. B. Inundation period (% of time inundated) can be calculated for any elevation within the site, and made into GIS layers or as input into circulation models. Be aware that calculated inundation periods vary according to seasonal changes in tidal amplitude and river flow, and results are affected by the time period used for the calculations.
REFERENCES Neckles et al. 2002; Hume and Bell (1993).
5.14
Evaluating Cumulative Ecosystem Response to Restoration Projects in the Columbia River Estuary, 2004
2. Protocol for Assessing Water Quality (temperature, salinity and dissolved oxygen) PURPOSE Organisms have varying tolerances to water quality parameters such as temperature, salinity, and dissolved oxygen (EPA; OWEB 1999). Measuring variations in pre- and post-restoration conditions are a direct measure of changes in habitat opportunity (Callaway et al. 2004) and are important for explaining floral and faunal changes. Increased circulation due to tidal reconnection may reduce excessive temperature and help maintain suitable DO levels, but allow increased salinity intrusion. As with water elevation (Protocol 1), we advocate the use of autonomous data logging equipment to measure water quality parameters. (Many newer multiprobe instruments include pressure sensors). Paired deployments provide comparative time series between habitats and over time. GOAL To continuously measure temperature, salinity, and dissolved oxygen at reference and impact site and relate to biotic changes. DESIGN A Recovery time series design should be used to evaluate changes in water quality parameters caused by the restoration activity. At a minimum, two instruments would be deployed, one at the reference and the other at the impact site. The latter would be positioned in a reach near the site of the (presumably) hydrological reconnection and would also presumably be where other monitoring activities take place (i.e., fish abundance). Additional instruments, if available, should be placed upstream of the reconnection to evaluate the extent of the effect (i.e., salinity intrusion). Before-impact (baseline) measurements are desirable to evaluate natural variation in the system. Comparing ranges and fluctuations of the reference and impact time series gives a measure of the effectiveness of the restoration project. EQUIPMENT A. Field: data loggers, laptop computer, and data logger launching/downloading software, data logger attaching/anchoring equipment (stakes, cable ties), hammer, GPS, camera, or field notebook for documenting data logger location, extra batteries, and data loggers. B. Lab: data logger calibration and maintenance manual, data logger output software SITE SELECTION A. Install data loggers in both reference and restoration sites. If possible, install both loggers at the same position relative to mean sea level (Protocol 2). B. Choose a location that is representative of the overall characteristics of the reach.
5.15
Evaluating Cumulative Ecosystem Response to Restoration Projects in the Columbia River Estuary, 2004
SAMPLING PERIODICITY Continuous deployment with data logging recording frequency set at 1-hour intervals. Note time of battery life. SAMPLING PROTOCOL See Protocol 1. CALCULATIONS & ANALYSIS A. Primary output from dataloggers is time series of parameters. Data, especially DO, should be inspected for data outliers (+/- 3 sd of the mean). Time series from reference and impact site should be temporally aligned and graphed together. B. Comparisons between sites can be emphasized with difference time series plots (Reference valueImpact value). Mean daily maximum values may be used to examine for periods where values exceed organism tolerances (OWEB 1999). C. Spectral (Fortier) analysis can be used to establish the dominant periods of parameter variability (i.e. tidal). REFERENCES Callaway et al. (2001); Schuett-Hames et al. (1999)
5.16
Evaluating Cumulative Ecosystem Response to Restoration Projects in the Columbia River Estuary, 2004
3. Protocol for Assessing Bathymetry and Topography PURPOSE Wetland topography is a critical determinant of geomorphological evolution, vegetation recolozination, and fish habitat use (Rice et al. 2005). Dynamic alterations of topographic and bathymetric features usually accompany hydrologic reconnection of non-tidal sloughs and backwaters to tidal forcing (Zedler 2001; Coats et al. 1995). Establishing the time course of morphological change at a restoration site is crucial for evaluating the progress of the restoration effort. Field measurements can include surveys or transects. All data should be converted to a GIS. GOAL To quantify changes in topography and bathymetry before and after action at a specific site. DESIGN To accurately monitor changes to bathymetry and topography in an intertidal area, one must conduct a precise elevation survey tied to a primary benchmark (mean sea level), and then link the survey to the local tidal datum. The locations of survey benchmarks and local tidal datum for sites in the CRE can be found at the National Ocean Surface site (http://co-ops.nos.noaa.gov/bench.html). Topographic Surveys For topographic surveys, we advocate use of a “total station”, which is a combination transit and electronic distance measuring device. Elevation and position data are logged internally and can easily be transferred to mapping software for analysis and display. Although simple 2D (distance and elevation) transects across areas of interest can be made, this system can also generate 3D maps from regular or random grids of data points. Such maps can be digitized and overlain on aerial photography images to produce digital elevation maps and change analysis can be used to measure changes to landforms over time (Borde et al. 2003). Newer kinesmatic GPS technology will likely supersede these optical techniques in the near future. This method utilizes two GPS receivers linked via a radio connection. The base unit is stationary and the mobile unit is used to make position and elevation measurements. This technique is advantageous in that measurements are made rapidly and only one individual is required. One possible drawback is that there may be reception problems in many areas. Bathymetric Surveys For bathymetry, surveys can be conducted in shallow water (500-1,000
3
>1000-5,000
5
5,000-10,000
7
>10,000
variable
5.24
Evaluating Cumulative Ecosystem Response to Restoration Projects in the Columbia River Estuary, 2004
Step 5. Select plots along each transect at a minimum of 50-meter intervals. Step 6. Measure species dominance for each vegetation strata at the plot using the following techniques: A. 1 m2 quadrat for percent cover of herbaceous layer. B. If applicable, use a rope that extends in a 3-m radius from center of quadrat to record shrub/scrub layer, measuring both number and height for each species found. C. If applicable, use a 10-m rope from center of quadrat to capture woody species layer and record DBH for each species encountered in that area. Step 7. Mark center of plot with 4 to 6-foot, ½ inch PVC pipe driven to at least a depth of 3 feet. Flag the pipe, so that it can be easily identified from a distance. Step 8. Repeat sampling protocol design at reference site CALCULATIONS & ANALYSIS Data gathered from these protocols can then be used for the following analysis: A. dominance-diversity graphs B. correlation of dominant plant community with elevations (from topographic survey) C. mean percent cover of major plant communities expressed over time D. comparison with data from reference site. REFERENCES Frenkel and Morlan 1990; Frankel and Morlan 1991; Thom et al. 2002; Washington Salmon Recovery Funding Board 2004; Wetland Training Institute 1987. Zedler, J. B. 2001 ed., Rice et al. 2005.
5.25
Evaluating Cumulative Ecosystem Response to Restoration Projects in the Columbia River Estuary, 2004
6. Protocol for Assessing Success Rate of Vegetation Plantings PURPOSE The effectiveness of habitat vegetation plantings can be determined by assessing survival, overall health, and growth of the plantings through time. It is important to determine a criterion for success when monitoring vegetation plantings to ensure that the project goals are being achieved and if not, mid-course corrections should be enacted by the project manager. GOAL Measure percent cover of vegetation pre and post restoration. Criterion for success: 60% tree and shrub survival of initial planting stock by year 5. DESIGN Monitoring design is set up to capture the range of plantings that may occur in the Columbia River Estuary from herbaceous to woody strata. To achieve statistically valid results, a random design is recommended with the understanding that it is not always achievable for a given site. Photo point recommendations are also listed to capture qualitative changes on the site over time. EQUIPMENT Field: field notebook, measuring tape, densiometer (for percent canopy measurements), rebar stakes, GPS, camera, one-meter square plots. SITE SELECTION Determine overall acres of vegetation plantings in reference and site to be restored. SAMPLING PERIODICITY: study dependent A.
Formal woody plant monitoring in years 1 and 5
B.
On projects sites age 5+ monitoring occurs in summer/early fall
C.
Informal woody plan monitoring is conducted on project sites, one to four years in age, not after original planting.
D.
Upland herbaceous monitoring is conducted in year 1 and 5 from June to July
SAMPLING PROTOCOL Step 1. Establish overall acreage of riparian plantings and mark boundaries with GPS (all four corners of site). Step 2. Select 10 random points throughout the site, record each with GPS, and construct a 18.7 m2 circular plot using an 2.4-m pole around each point.
5.26
Evaluating Cumulative Ecosystem Response to Restoration Projects in the Columbia River Estuary, 2004
Step 3. Pivot around the point with the 2.4-m pole and count all plantings under the pole. (see calculations section) Step 4. Within each plot identify species, count woody plants, and assess plant vigor.
Table 1. Plant Vigor categories High:
Plants exhibiting remarkable growth and vigor
Medium:
Plants exhibiting moderate growth and vigor and expected to live beyond the immediate growing season
Low:
Plants expected to die within the year
Step 3. Measure height for woody species plantings Step 4. Estimate herbaceous cover by percentage of plot occupied for dominant and sub-dominant species. Step 5. Establish permanent photo points of area planted and log the date, location, and orientation of photo.
On Project Sites Age 5+ A.
Repeat steps 2-4 above, additional measurements: diameter at breast height and percent cover using a densiometer.
B.
Take four densiometer measurements at 1.4 meters above the plot center facing, N, E, S, and W.
C.
Record average measurement.
Informal Woody Plant Monitoring A. Calculate average number of trees and shrubs per acre. B. Calculate percentage of non-native weedy species by cover. C. Identify and list weed species. Upland Herbaceous Vegetation Monitoring: Sites Age 1 to 5 A.
Use one-meter square plots and sample herbaceous vegetation at 5 plots per acre.
B.
Record percent cover of vegetation within each plot.
CALCULATIONS & ANALYSIS
5.27
Evaluating Cumulative Ecosystem Response to Restoration Projects in the Columbia River Estuary, 2004
A.
Calculate average number of plantings per plot and multiply that number by 216.65 to give the average number of plantings per acre. Density (acres) = Average s x 216.65 = trees/acre
B.
Assess success rate: 60% tree and shrub survival of initial planting stock by year 5.
REFERENCES Washington Salmon Recovery Funding Board 2004; Wetland Training Institute 1987.
5.28
Evaluating Cumulative Ecosystem Response to Restoration Projects in the Columbia River Estuary, 2004
7. Protocol for Assessing Fish Temporal Presence, Size/AgeStructure, and Species Composition PURPOSE The incentive for many restoration activities in the CRE involves increasing habitat for rearing and migrating juvenile salmonid ESUs listed as threatened or endangered under ESA. One measure of success in effectiveness evaluations is an increase in salmonid habitat use at restored locations approaching the reference or parallelism. Evaluating changes in community structure is the minimum parameter for effectiveness monitoring. However, we advocate conducting more intense effort and greater sampling diversity over sites, habitat types, and times. This will increase the sensitivity of collected data for each metric and provide better identification of benefits for fish resulting from restoration. Higher orders of assessment intended to evaluate enhancement for listed salmon stocks and life strategies, such as residence time, growth, and survival, necessitate broader ranges of metrics, such as food availability, food consumption, age assessment, genetic stock identification, parasite load, chemical load assessments, and mark recovery data. Ultimately, relation of fish habitat use to physical conditions such as water quality, tidal conditions, hour of day, and day vs. night will be important. GOAL Evaluate species composition (lowest practical taxon), fish size (fork length or total length), and temporal abundance patterns (catch/m2 by date) in each habitat type of the area intended for restoration, in habitats of a reference area similar to that designated for restoration, and in the post-restoration area habitats. DESIGN The Recovery survey design should be utilized. Increased numbers of sample sites and higher frequency of sample dates will provide greater sensitivity in data analysis of fish use of restored sites. However, limitations of personnel and resources are the primary determinates for minimal sampling protocols. Primary data (fish/m2) provide direct assessment of change through time and differences among reference sites. These metrics for fish sampled post-restoration can then be correlated with metrics for other physical and biological features of each habitat to determine features that provide the greatest enhancement of fish use. EQUIPMENT There are a variety of acceptable gear types for sampling juvenile salmon and other fish in the CRE. Particular gear choices depend largely on the physical constraints at the sites: terrain, bottom contour, hydrography, and debris load will affect sampling gear selection and location of sampling sites. It is highly advisable to utilize the same gear at similar sites, although more than one gear type can be used at all sites (such as seines and traps). Appropriate sampling gear types include seines, fyke nets, barrier nets, and traps, as described below. Permits--Annually, a state fish sampling permit must be obtained from the Oregon Department of Fish and Wildlife or Washington Department of Fish and Wildlife to conduct sampling in the Columbia River
5.29
Evaluating Cumulative Ecosystem Response to Restoration Projects in the Columbia River Estuary, 2004
and its tributaries. An Endangered Species Act permit from NOAA Fisheries must also be obtained because there is a strong likelihood that naturally spawned tule stock Chinook salmon and chum salmon emanating from tributaries downstream from Bonneville Dam will be captured. At present those stocks are listed under the ESA; additionally, naturally spawned coho salmon may soon be listed. Ancillary Hardware & Materials—Dark-colored 20-gallon plastic garbage cans for holding containers (with 3/16 holes drilled in side for water overflow), dark colored plastic dish pan for anesthetic bath, dip net, measuring board, standardized waterproof data forms, fin clipper, plastic tissue storage vile, 70% ethanol solution, and anesthetic solution (MS 222 solution at about 50mg/l). SITE SELECTION Sampling site selection depends on the physical conditions necessary for the available sampling gear. Sites should be selected in each habitat type of the restoration area. Sites in the different habitat types of the reference area should be as similar as possible to those of the restoration area. It is beneficial to employ several gear types to overcome inherent biases of each sampling gear, but this may not be possible in small restoration projects. Additionally, it is best to systematically sample at established sites with the same gear type through time; in a limited sampling regime, randomizing sites and gear types will increase variability unassociated with changes from restoration. SAMPLING PERIODICITY The minimum frequency is 1 day/month, March thru October. More is better, but this period will encompass most salmonids residing in or passing through the estuary. As much as possible, standardize the tide cycle and time of day for all samples. Where repetitive depletion sampling in a cordoned off area (providing fish/m2 data) cannot be accomplished, more than one site should be sampled to provide several fish/sample data points at each period and at each area of different habitat type. SAMPLING PROTOCOL Seines and nets of various shapes, sizes, and methods of deployment provide the simplest technology and provide a reasonably degree of reproducibility. Seine size is dependent on the width, breadth, and depth of the water body. Seines can provide estimates of fish/m2 when combined with barrier nets or screened panels to block a channel or channel section and repetitive depletion sampling, However, seine sites must have relative uniform bottom contours and be clear of debris and boulders. Additionally, high currents diminish catch efficiency. Because of these restrictions, and depending on site characteristics, utilization of other gear types may be necessary, as described below. Beach seines require a shoreline area with sloping beach for ease of collection. Length of the seine depends on the area to be sampled. General dimensions are: 10 to 30 m long x 2 m deep using 1- to 2-cm (stretch measure) webbing and 0.6 cm mesh bunt in the middle. Step 1. Deploy the seine parallel to and a measured distance from the shore. tep 2. Retrieve it by pulling the two wings simultaneously to shore and crowd fish into the center bunt S for capture. Step 3. Use a dip net to transfer fish to holding containers. 5.30
Evaluating Cumulative Ecosystem Response to Restoration Projects in the Columbia River Estuary, 2004
Pole seines are easily adjustable for size of area and can be utilized in many locations because of the smaller size. However, numbers of fish captured may be small. General dimensions are: up to 10 m in length and 1.5 m depth (1- 2-cm stretch measure with 0.6 cm mesh bunt in the middle). Procedure is similar to seine nets. Fyke Trap Nets provide a method for sampling shallow, low-velocity tidal channels. This gear is dependent on volitional entry and water current for entrapment. Sufficient depth for sanctuary of captive fish during low water periods is necessary. Step 1. Set web tunnels (2 x 2 x 2 m long, 0.6-cm nylon mesh, with an attached fyke tunnel) at high tide in the highest order channel at a point above which the marsh channel system completely dewaters on a sampling tide. Step 2. Attach upstream facing wings of any length with 0.6-cm mesh to act as a barrier net to deflect fish into the fyke tunnel during ebb current. Step 3. After tidal channels drain, continue sampling in the remaining upstream pools with pole seines and dip nets. Measure the surface area of upstream channel at high tide to allow an estimate of fish/m2. Barrier Nets or Screened Panels are used in conjunction with traps and nets to close off all or portions of a sampling area to control entry and exit of fish (for greater precision of fish/m2 calculation). Nets and panels are constructed of 1- to 2-cm webbing (of sufficient length and depth for the site) bordered with corkline and leadline or solid framework of any desired construction materials. Use in conjunction with seines and fyke trap nets for sampling short reaches. Step 1. Deploy to completely enclose one section of the channel. Measure area of channel enclosed. Step 2. Collect fish with each seine sweep through the channel until the catch approaches zero (depletion sampling). Catches should show an exponential decay pattern with increasing sweep number, allowing estimation of fish densities (fish/m2 in the cordoned off reach). Center Pit Traps and Dipnets can be employed in marsh areas not accessible by boats and too shallow for seines where small fish inhabit shallow water (marsh areas) and cannot be otherwise captured. Brown plastic dish pans make an appropriate pit trap. Step 1. Bury traps flush with marsh surface at low water. Step 2. Allow tide to rise and fall. Fish are passively collected during ebb tides from either pit traps or natural impoundments using dip nets. SAMPLE PROCESSING After collection of fish by each of the gear types used at each site sampled, transfer (dipnet) the catch into a darkened and covered holding container—ensure that the water quality of the holding container is maintained near river conditions throughout the duration of processing. If the numbers of fish are too large and must be subsampled, crowd the fish into an area sufficiently small to limit stratification of different sizes and species. Using a dipnet, catch a subsample of fish collected from bottom to top from the center of the holding area. Place the fish into anesthetic solution (MS 222 ) until fish become lethargic and loose equilibrium. Identify species and individually measure fork-length of salmonids (tip of snout to 5.31
Evaluating Cumulative Ecosystem Response to Restoration Projects in the Columbia River Estuary, 2004
center of fork in caudal fin) and total length (tip of snout to end of caudal fin) of other fish. Place the measured fish into a holding container for recovery from anesthetic, maintaining water quality, prior to re-introducing the fish back to the river. Continue the subsample/processing procedure until 100 of the most prevalent fish have been processed then count and release remaining fish back to the river. If depletion sampling is conducted to obtain fish/m2 estimates, sample two times, hold each sample separately and do not release fish until sampling is complete or release recovered fish outside the cordoned off area. Fish identification to species if practical may be assisted with guides and keys available for this region: Scott and Crossman 1973; Carl et al. 1977; and McConnell and Snyder 1972. Field assessment of salmon stock identification is impractical because few fish will be marked. Marks encountered will generally be Coded Wire Tags (requiring an expensive detector and sacrifice of fish for identification), and Passive Integrated Transponder tags (requiring an expensive detector). However, tissue samples (1/2 of one pectoral fin) can be collected from up to 30 Chinook salmon each sampling period and placed in plastic vials with 70% ETOH and labeled with date, time, location, species, and size.
Calculations & Analysis 1. Catch: Absence/presence is minimum metric. If possible calculate fish /m2 by species. 2. Size frequency and length weight relationships. Compute mean and standard deviations by species for each date sampled. 3. Measures of fish community structure (diversity, evenness, dominance). For restoration projects with extensive resources, increased sampling efforts and assessment protocols will provide estimates of enhanced fish production such as growth, residence time, feeding rate, and food resources. See Seber and LeCren (1967) for statistics on two-sweep depletion method. REFERENCES B.C. Ministry of Environment, Lands and Parks (1997); Carl et al. (1977); McConnell and Snyder (1972); Scott and Crossman (1973)
5.32
Evaluating Cumulative Ecosystem Response to Restoration Projects in the Columbia River Estuary, 2004
5.6 Literature Cited Action Agencies (Bonneville Power Administration, U.S. Bureau of Reclamation, U.S. Army Corps of Engineer, and NOAA Fisheries). 2003. Draft Research, Monitoring and Evaluation plan for the NOAA-Fisheries 2000 Federal Columbia River Power System Biological Opinion. Bonneville Power Administration, U.S. Bureau of Reclamation, U.S. Army Corps of Engineers, and NOAA Fisheries, Portland, Oregon. www.nwr.noaa.gov/1hydrop/hydroweb/fedrec.htm B.C. Ministry of Environment, Lands and Parks. 1997. Fish Collection Methods and Standards. Version 4.0. Available on the internet at http://www.for.gov.bc.ca/ric Borde, A.B., R.M. Thom, S. Rumrill, and L.M. Miller. 2003. Geospatial habitat change analysis in Pacific Northwest coastal estuaries. Estuaries 26(4B):1104-1116. Bottom, D.L., C.A. Simenstad, A.M. Baptista, D.A. Jay, J. Burke, K.K. Jones, E. Casillas and M. Schiewe. 2005. Salmon at River’s End: The Role of the Estuary in the Decline and Recovery of Columbia River Salmon. University of Washington Press and NOAA-National Marine Fisheries Service, Seattle, WA. Burke, J.L. 2004. Life histories of juvenile Chinook salmon in Columbia River Estuary, 1916 to the present. Master Thesis, Oregon State University, Corvallis, Oregon. August, 2004. Callaway, J.C., G. Sullivan, J.S. Desmond, G.D. Williams, and J.B. Zedler. 2001. Assessment and monitoring. In J.B. Zedler (ed.) Handbook for Restoring Tidal Wetlands, pp.271-335, CRC Press, Boca Raton, Florida. Carl, G.C., W.A. Clemens, and C.C. Lindsey. 1977. The fresh-water fishes of British Columbia. British Columbia Provincial Museum, Victoria, Handbook No. 5. Coats, R.N., P.B. Williams, C.K. Cuffe, J.B. Zedler, D. Reed, S.M. Watry and J.S. Noller. 1995. Design guidelines for tidal channels in coastal wetlands. Report prepared for U.S. Army Corps of Engineers Waterways Experiment Station, Catalog. No. TA7W343.D47, Vicksburg, MS. Cornu, C.E. and S. Sadro. 2002. Physical and functional responses to experimental marsh surface elevation manipulation in Coos Bays’ South Slough. Res. Ecol 10: 474-486. Dawley, E.M., R. D. Ledgerwood, T. H. Blahm, C. W. Sims, J. T. Durkin, R. A. Kirn, A.E. Rankis, G. E. Monan, and F. J. Ossiander. 1986. Migrational Characteristics, Biological Observations, and Relative Survival of Juvenile Salmonids Entering the Columbia River Estuary, 1966-1983. Report to Bonneville Power Admin., DACW57-85-F-0623, 256 p. (Available from Dick Ledgerwood, NMFS, P.O. Box 155 Hammond OR, 977121. (503) 861 1818 ex 13. Estuary Restoration Act of 2000. Public Law 106-457, Nov. 7, 2000, 114 Stat. 1957, Title I—Estuary Restoration. Available URL: http://www.epa.gov/owow/oceans/habitat/index.html Finkbeiner, M.A. 2003. High-resolution multi-spectral remote sensing for intertidal oyster reef mapping and characterization in coastal South Carolina. Conference abstracts, 17th Biennial Conference, Estuarine Research Federation, September 14-18, 2003, Seattle,Washington. Frenkel, R.E. and J.C. Morlan. 1990. Restoration of the Salmon River Salt Marshes: Retrospect and Prospect. Department of GeoSciences, Oregon State University. Final Report to the U.S. Environmental Protection Agency.
5.33
Evaluating Cumulative Ecosystem Response to Restoration Projects in the Columbia River Estuary, 2004
Frenkel R.E. and J.C. Morlan 1991. Can we restore our salt marshes? Lessons from the Salmon River, Oregon. NW Envirnm, J. 7: 119-135). Healey, M.C. 1980. Utilization of the Nanaimo River estuary by juvenile Chinook salmon, Oncorhynchus tshawytscha. Fish. Bull. 77: 653-668. Hillman, T.W. 2004. Monitoring strategy for the upper Columbia Basin. Draft report prepared for the Upper Columbia Regional Technical Team of the Upper Columbia Salmon Recovery Board, Wenatchee, Washington, February 1, 2004. Hood, W.G. 2002a. Application of landscape allometry to restoration of tidal channels. Restoration Ecology 10(2):213-222. Hood, W.G. 2002. Landscape allometry: from tidal channel hydraulic geometry to benthic ecology. Can. J. Fish. Aquat. Sci. 59: 1418-1427. Hume, T.M. and R.G. Bell. 1993. Methods for determining tidal fluxes and material fluxes in estuarine cross-sections. Water Quality Centre Publication No. 22. Hamilton, New Zealand. Johnson G.E., R.M. Thom, A.H. Whiting, G.B. Sutherland, T. Berquam, B.D. Ebberts, N.M. Ricci, J.A. Southard, and J.D. Wilcox. 2003. An Ecosystem-Based Approach to Habitat Restoration Projects with Emphasis on Salmonids in the Columbia River Estuary. PNNL-14412, Prepared for Bonneville Power Administration, Portland, Oregon, Pacific Northwest National Laboratory, Richland, WA. Johnson, G.E., H.L., Diefenderfer, T.J., Berquam, B.D., Ebberts, C., Tortorci, J.D., Wilcox. 2004. Plan for Research, Monitoring, and Evaluation of Salmon in the Columbia River. PNNL-14632. Date final draft, August 10, 2004. Pacific Northwest National Laboratory, Richland, WA. Kentula, M.E., R.P. Brooks, S.E. Gwin, C.C. Holland, A.D. Sherman and Jj.C. Sifneos. 1992. An approach to improving decision making in wetland restoration and creation. EPA/600/R-92/150, U.S. Environmental Protection Agency Environmental Research Laboratory, Corvallis, Oregon. Kukulka, T. and D.A. Jay, 2003a. Impacts of Columbia River discharge on salmonid habitat: 1. a nonstationary fluvial tide model. Journal of Geophysical Research 108(C9):3293. Kukulka, T. and D.A. Jay, 2003b. Impacts of Columbia River discharge on salmonid habitat: 2. changes in shallow-water habitat. Journal of Geophysical Research 108(C9):3294. Larsen D.P., P.R. Kaufmann, T.M. Kincaid, N.S. Urguhart. 2003. Detecting persisitent change in the habitat of salmon-bearing streams in the Pacific Northwest. Can. J. Fish. Aquat. Sci. 61: 283-291. Levings, C.D. 1994. Feeding behavior of juvenile salmon and significance of habitat during estuary and early sea phase. Nordic J. Freshw. Res, 69: 7-16. Levings, C.D, K. Conlin, B. Raymond. 1991. Intertidal habitats used by juvenile Chinook salmon (Oncorhynchus tshawytscha) rearing in the North Arm of the Fraser River estuary. Mar. Pollution Bull. 22: 20-26. Levy, D.A. and T.G. Northcote. 1982. Juvenile salmon residency in a marsh area of the Fraser River estuary. Can. J. Fish. Aquat. Sci. 39: 270-276. Lichatowich, J.A., and L.E. Mobrand. 1995. Analysis of Chinook salmon in the Columbia River from an ecosystem perspective. Research Report, Mobrand Biometrics, Vashon, Washington.
5.34
Evaluating Cumulative Ecosystem Response to Restoration Projects in the Columbia River Estuary, 2004
Lohani, B. and D.C. Mason. 2001. Application of airborne scanning laser altimetry to the study of tidal channel geomorphology. ISPRS Journal Photogrammetry and Remote Sensing 56:100-120. McConnell, R.J. and G.R. Snyder. 1972. Key to field identification of anadromous juvenile salmonids in the Pacific Northwest. U.S. Dep.Commer., Natl. Ocean. Atmos. Admin., Natl. Mar. Fish. Serv., GPO 1979 690-465.6p. Miller, J.A. and C.A. Simenstad, 1997. A comparative assessment of a natural and created estuarine slough as rearing habitat for juvenile Chinook and Coho salmon. Estuaries 20(4):792-806. National Oceanic and Atmospheric Administration (NOAA). 2004. Monitoring requirements under the Estuary Restoration Act. Available URL: http://era.noaa.gov/htmls/era/era_monitoring.html. National Research Council. 1992. Restoration of aquaticecosystems: science, technology, and public policy, National Academic Press, Washington DC. Neckles, H.A., M. Dionne, D.M. Burdick, C.T. Roman, R. Buchsbaum, E. Hutchins. 2002. A monitoring protocol to assess tidal restoration of salt marshes on local and regional scales. Rest. Eco. Vol. 10 (3) pp. 556-563. Osenberg, G.W., R.J. Schmitt, S.J. Holbrook, K.E. Abu-Sara, and A.R. Flegal. 1994. Detection of environmental impacts: Natural variability, effect size, and power analysis. Ecol. App, 4: 16-30. OWEB (Oregon Watershed Enhansement Board). 1999. Water quality monitoring guidebook. Salem, OR. Raposa, K. 2002. Early responses of fishes and crustaceans to restoration of a tidally restricted New England salt marsh. Rest, Ecol. 10: 665-676. Reimers, P.E., and R.E. Loeffel. 1967. The length of residence of residence of juvenile fall Chinook salmon in selected Columbia River tributaries. Res. Briefs, Fish Comm. Oreg. 13(1):5-19 Rice, C.A., L.L. Johnson, P. Roni, B.E. Feist, W.G. Hood, L.M. Tear, C.A. Simenstad, and G.D. Williams, 2005. Monitoring rehabilitation in temperate North American estuaries. In: P. Roni (Ed.), Monitoring Stream and Watershed Restoration. American Fisheries Society, Bethesda, Maryland, pp. 165-204. Rich, W.H. 1920. Early history and seaward migration of Chinook salmon in the Columbia and Sacramento Rivers. U.S. Bur. Fish., Bull. 37:2-73. Roegner G.C. 1998. Hydrodynamic control of the supply of suspended chlorophyll a to estuarine infaunal bivalves. Est. Coast. Shelf Sci. 47: 319-331. Roegner, G.C., D.L. Bottom, A. Baptista, S. Hinton, C.A. Simenstad, E. Casillas, and K. Jones. 2004. Estuarine habitat and juvenile salmon – current and historical linkages in the lower Columbia River and estuary, 2003. Report of Research by Fish Ecology Division, NOAA Fisheries to Portland District U.S. Army Corps of Engineers. 41 pp. Roman, C.T., K.B. Raposa, S.C. Adamowicz, M.J. James-Pirri, J.G. Catena. 2002. Quantifying vegetation and nekton response to tidal restoration of a New England saltmarsh. Res. Ecol. 10: 450-460. Roni, P. T.J. Beechie, R.E. Bilby, F.E. Leonetti, M.M.Pollock, and G.R. Pess. 2002. A review of stream restoration techniques and a hierarchical strategy for prioritizing restoration in Pacific Northwest watersheds. North American J. Fish. Mgmt. 22: 1-20.
5.35
Evaluating Cumulative Ecosystem Response to Restoration Projects in the Columbia River Estuary, 2004
Sanderson, E.W., W.L. Ustin, T.C. Foin. 2000. The influence of tidal channels on the distribution of salt marsh plant species in Petaluma Marsh, CA, USA. Plant Ecology 146:29-41. Schuett-Hames, D., A.E. Pleus, E. Rashin, and J. Mathews. 1999. TFW monitoring program method manual for the stream temperature survey. Prepared for the Washington State department of natural resources under the timber, fish and wildlife agreement. TFW-AM9-99-005. Scott, W. B. and E.J. Crossman. 1973. Freshwater fishes of Canada. Fisheries Res. Bd. Of Canada. Bulletin 184. Seber, G.A.F., and E.D. Le Cren. 1967. Estimating population parameters from catches large relative to the population. Journal of Animal Ecology 36: 631-643 Shreffler, D.K. C.A. Simenstad, R.M. Thom. 1990. Temporary residence of juvenile salmon n in a restored estuarine wetland. Can. J. Fish. Aquat. Sci. 47: 2079-2084. Shreffler, D.K. C.A. Simenstad, R.M. Thom. 1992. Foraging by juvenile salmon in a restored estuarine wetland. Estuaries 15: 204-213. Simenstad, C.A. and J.R. Cordell. 2000. Ecological assessment criteria for restoring anadromous salmonid habitat in Pacific Northwest estuaries. Ecological Engineering 15:283-302. Simenstad, C.A., D.A. Jay and C.R. Sherwood, 1992. Impacts of watershed management on land-margin ecosystems: the Columbia River estuary as a case study. In: R.J. Naiman (Ed), Watershed Management: Balancing Sustainability and Environmental Change, Springer-Verlag, New York, pp. 266-306. Simenstad, C.A., C.D. Tanner, R.M. Thom and L.L. Conquest. 1991. Estuarine habitat assessment protocol. EPA 910/9-91-037. Prepared for U.S. EPA, Region 10 Office ,Puget Sound, Seattle, WA. Skalski, J.R., D.A. Coats and A.K. Fukuyama. 2001. Criteria for oil spill recovery: a case study of the intertidal community of Prince William Sound, Alaska, following the Exxon Valdez oil spill. Env. Man. 28(1):9-18. Stewart-Owen, A. and J.R. Bence. 2001. Temporal and spatial variation in environmental impact assessment. Ecol. Monogr. 71: 305-339. Steyer, G.D., C.E. Sasser, J.M. Visser, E.M. Swenson, J.A. Nyman, and R.C. Raynie. 2003. A proposed coast-wide reference monitoring system for evaluating wetland restoration trajectories in Louisiana. Environ. Monit. Assess. 81: 107-117. Tanner, C.D. J.R. Cordell, J. Rubey, L.M. Tear. 2002. Restoration of freshwater intertidal habitat functions at Spencer Is., Everett, Washington. Res. Ecol. 10: 564-576. Tegler, B., M. Sharp, M.A. Johnson. 2001. Ecological monitoring and assessment network’s proposed core monitoring variables: an early warning of environmental change. Environ. Monitor. Assess. 67: 29-56. Thom, R.M. and K.F. Wellman, 1996. Planning aquatic ecosystem restoration monitoring programs, IWR Report 96-R-23, prepared for Institute for Water Resources, U.S. Army Corps of Engineers, Alexandria, VA and Waterways Experimental Station, U.S. Army Corps of Engineers, Vicksburg, MS.
5.36
Evaluating Cumulative Ecosystem Response to Restoration Projects in the Columbia River Estuary, 2004
Thom, R.M., G.W. Williams, H.L. Diefenderfer. 2005. Balancing the need to develop coastal areas with the desire for an ecologically functioning coastal environment: Is net ecosystem mprovement possible? Res. Ecol 13:193-203. Thom, R.M., R. Zeigler and A.B. Borde. 2002. Floristic development patterns in a restored Elk River estuarine marsh, Grays Harbor, Washington. Rest. Eco. 10(3): 487-496. Thomas, D.W. 1983. Changes in the Columbia River estuary habitat types over the past century. Columbia River Estuary Data Development Program. 51 (Available from Columbia River Estuary Study Taskforce. P.O. Box 175, Astoria, OR 97103). Underwood, A.J. 1991. Beyond BACI: Experimental designs for detecting human environmental impacts on temporal variation in natural populations. Austr. J. Mar. Freshw. Rest. 42:569-587. Underwood, A.J. 1992. Beyond BACI: The detection of environmental impacts on populations in the real, but variable world. J. Exp. Mar. Biol. Ecol. 161: 145-178. Underwood, A.J. 1994. On beyond BACI: Sampling designs that might reliably detect environmental disturbances. Ecol.. App. 41: 3-15. Washington Salmon Recovery Funding Board. 2004. Protocol for monitoring effectiveness of riparian planting projects. MC-3. April, 2004. Weitkamp, L.A. 1994. A review of the effects of dams on the Columbia River estuarine environment, with special reference to salmonids. Report to US Department of Energy, BPA. 120 pages. (Available from National Marine Fisheries Service, 2725 Montlake Blvd. E., Seattle WA, 98112) Wetland Training Institute Environmental Laboratory. 1987. "Corps of Engineers Wetlands Delineation Manual," Technical Report Y-87-1, US Army Engineer Waterways Experiment Station, Vicksburg, Miss. http://el.erdc.usace.army.mil/elpubs/pdf/wlman87.pdf Williams, P.B. and M.K. Orr. 2002. Physical evolution of restored breached levee salt marshes in the San Francisco Bay estuary. Res. Ecol. 10: 527-537. Wright, A., W.A. Marcus, and R. Aspinall. 2000. Evaluation of multispectra;, fine scale digital imagery as a tool for mapping stream morphology. Geomorphology 22: 107-120. Zedler, J. B. 1988. Salt Marsh restoration: lessons from California. Pages 123-138 in J. CAines, ed. Rehabilitating damaged ecosystem. Volume 1. CRC Press, Boca Raton, Florida. Zedler, J.B., editor. 2001. Handbook for restoring tidal wetlands. CRC Press, Boca Raton, Florida.
5.37
Evaluating Cumulative Ecosystem Response to Restoration Projects in the Columbia River Estuary, 2004
5.38
Evaluating Cumulative Ecosystem Response to Restoration Projects in the Columbia River Estuary, 2004
6.0 Summary, Recommendations, and Management Implications 6.1 Summary of Findings Detecting the cumulative effects of multiple restoration projects on an ecosystem is a challenging yet critical problem. Restoration projects are typically expensive, and the return on this investment in terms of benefits to the ecosystem often is not well documented or understood. In systems where restoration is conducted at a variety of sites, these projects may add up to produce a system-wide benefit. Assessing cumulative effects is critical to understanding whether there has been a net improvement in the ecosystem from restoration actions or whether actions are only effective in a site-specific manner. The problem lies primarily in how to document this effect, especially in large and complex ecosystems like the Columbia River estuary. This study attempts a systematic approach to develop an assessment of cumulative effects of multiple restoration projects in the Columbia River estuary. In conclusion, in the first year of study in 2004, we reviewed the literature on cumulative ecosystem effects and from this we designed a weight of evidence approach to pursue development of cumulative ecosystem effects methodologies. To support methods specific to the CRE, we summarized the available literature on juvenile salmonid usage of CRE habitats. Finally, we proposed standard monitoring protocols to feed the cumulative effects assessment, as well as the broader needs of monitoring and evaluation for habitat restoration projects in the CRE. The primary findings from the four objectives initiated in 2004 (Year 1) are summarized next.
6.1.1 Objective 1. Review available scientific literature on evaluating cumulative ecosystem effects as it applies to the CRE and design an approach to develop cumulative effects assessment methods. The Year 1 literature review revealed the need for research to increase the scientific defensibility of restoration by assessing the cumulative effects. The review uncovered no comparable efforts in estuary restoration science. To summarize, our review of the literature documented that: •
While site-specific monitoring of restoration projects and long-term monitoring programs for water quality, habitat, or biota are common, no similar effort to assess cumulative effects of multiple restoration projects in a discreet system is being explicitly undertaken.
•
Throughout the literature in several sub-disciplines of ecology, assessments of cumulative impacts appear, especially related to habitat degradation and loss. Assessing or quantifying cumulative impacts has been largely through indices and descriptions of land-use changes associated with the loss of given habitats or the loss of specific resources (e.g., fisheries).
•
The Columbia River estuary is a large, complex, and dynamic system, making for difficulty in detecting a restoration “signal” from within background “noise” caused by regular flux driven by tides, river flow, climate, etc.
•
Designing a scale-appropriate (time and space) sampling scheme and selecting the best available metrics for measurement is key in determining if there is a cumulative effect and what its extent may be. Candidate metrics (in addition to minimum metrics, Section 6.1.4) include the following: 6.1
Evaluating Cumulative Ecosystem Response to Restoration Projects in the Columbia River Estuary, 2004
organic matter export and fate, correspondence between plant community and elevation, salmonid growth and residence time, species-area curves, productivity of swamp and marsh macrophytes, hydraulic geometry relationships, salmonid prey, sedimentation and accretion, nutrient cycling, and hydrology and flood storage. •
Determining the success and effects of multiple individual restoration projects will be critical in contributing to a holistic approach as outlined by this project.
Based on the literature review, we conceived a weight of evidence approach to develop cumulative effects assessment methods. This weight of evidence approach reduces the risk of mistakenly attributing causation in an analysis of cumulative ecosystem effects. The four lines of evidence we advocated are: 1.
Statistically based estuary-wide sampling for minimum structural and functional (process) indicators at project and reference sites.
2.
Spatial data processed in GIS including changes in land use and hydrological information.
3.
Focused research into data gaps to characterize appropriate “higher-order” indicators of fundamental processes in the system, such as organic matter export, and the relationships between elevation and vegetation.
4.
Focused research into fish-habitat relationships via mark/recapture technologies.
6.1.2 Objective 2. Summarize knowledge on estuary habitat usage by juvenile salmon as it relates to habitat restoration efforts. We summarized knowledge on estuary habitat usage by juvenile salmon in available literature from the 1920s to the present. Our main findings relative to measuring cumulative effects are as follows: •
Juvenile salmonid use of estuarine habitats appears specific to species, race, stock, distance of migration, and fish size.
•
Nearly 200 million fish emigrate from sub-basins in the Columbia River watershed each year and all pass through the estuary. At present, most do so rapidly. However, observations to date indicate that lower river stocks of ocean-type subyearling Chinook salmon (Oncorhyncus tshawytscha) in particular exhibit extended estuarine residence and lower river chum salmon (O. keta) and coho salmon (O. kisutch) also exhibit estuary-dependent life-history strategies.
•
Some proportion of upper river populations also exhibit extended use of tidal freshwater and estuarine habitats. These populations, some of which are naturally spawned and listed as threatened under the Endangered Species Act, can provide the focus for future research and facilitate evaluation of salmon performance in habitat restoration actions. Differences in overall abundances and life-history strategies among stocks emigrating from hundreds of locations in the Columbia River, however, create an ever-changing amalgam of individuals at any site and time.
•
Identification of sites and conditions in the Columbia River estuary that are important to enhancing survival and diversity of salmonid stocks depend on a clear understanding of spatial and temporal distribution of juvenile salmonids. Thus, it is imperative that individual fish be identifiable beyond general phenotype.
•
Current research endeavors utilizing a suite of physical and biochemical methods are underway by other researchers to help further quantify estuarine habitat use. 6.2
Evaluating Cumulative Ecosystem Response to Restoration Projects in the Columbia River Estuary, 2004
6.1.3 Objective 3. Provide a conceptual model of the Columbia River Estuary. The project team developed an interactive conceptual model, The Columbia River Estuary Conceptual Model, addressing the factors controlling habitat development in the estuary. The model is available on the internet at http://www.nwp.usace.army.mil/pm/lcr/science.asp. The model consolidated existing models of the CRE and other literature to provide a communication tool, a basis for numerical models of the estuary, and an organized structure for assessing the cumulative effects of restoration. The model requires maintenance, that is the addition of results from future studies of the estuary, in order to keep it current, and it has been designed using commonly available software and is easy to update. Features of the model are as follows: •
The model is organized according to relationships between stressors, controlling factors, ecosystem-complex structure, ecosystem-complex processes, and ecosystem-complex functions.
•
Readers can follow logical sequences interactively by clicking on hyperlinks of interest, because the model is written in html format.
•
The model serves as a management tool by contrasting well-understood linkages to data gaps and making relationships explicit.
•
The model displays habitat-forming processes, the understanding of which is key to restoration planning, as well as potential metrics for quantifying the effects of multiple restoration projects.
6.1.4 Objective 4. Draft standard protocols for monitoring habitat restoration projects. The project team developed, with the help of agencies and restoration project managers, a set of standard monitoring protocols (see Chapter 5) that on-the-ground restoration managers can reasonably conduct at most restoration project sites. Important elements of the protocols are as follows: •
Standardization and widespread dissemination of monitoring protocols is of time-critical importance because numerous restoration projects are currently being implemented in the estuary.
•
Since habitat restoration actions are being undertaken by a variety of governmental and nongovernmental entities, and are being funded by multiple sources, a collaborative approach to the implementation of restoration monitoring will be the most effective, and most useful to the cumulative effects evaluation.
•
To develop the monitoring protocols, we adapted monitoring methods available in the literature to typical project work in the CRE. In addition, we advocated state-of-the-art data collection protocols for future studies in the CRE, including data logging instrumentation and GIS-based analysis.
•
The protocols distinguish between structural and functional features of a given restoration site in order to capture an array of responses to treated sites.
•
Emphasis is placed on Before After Control Impact (BACI) sampling schemes which integrate both temporal and spatial scales into the effectiveness monitoring experimental design. Monitored parameters are sampled simultaneously at two (or more) locations (Control versus Impact) during both pre- and post restoration action (Before versus After).
•
We drafted standard monitoring protocols for the following monitoring metrics: 6.3
Evaluating Cumulative Ecosystem Response to Restoration Projects in the Columbia River Estuary, 2004
a. landscape features, b. bathymetry and topography, c. water quality (temperature, salinity, dissolved oxygen), d. hydrology (water elevation), e. fish temporal presence, size/age-structure, and species composition, f.
vegetation changes resulting from tidal reconnection, and
g. success rate of vegetation plantings. In developing these protocols, we adapted approaches from excellent works on monitoring methods, notably those by Callaway et al. (2001), Hillman (2004), Simenstad et al. (1991) and Rice et al. (2005). However, we depart from these previous works by concentrating on anticipated research goals for present and projected work in the CRE. Specifically, we are advocating state-of-the-art data collection formats for future studies in the CRE, including data logging instrumentation and GIS-based analysis. We view these research formats as providing the best possible input to managers for decisions regarding ecosystem restoration and especially salmon recovery. However, the technical expertise needed to collect and analyze these data require levels of technical skill best accomplished by professionals associated with a centralized management organization.
6.2 Recommendations We recommend research in 2005 to: •
Finalize the standard monitoring protocols in a user manual using results from focused field evaluations of particular protocols.
•
Continue to develop techniques to assess cumulative effects and field test critical elements of these techniques.
•
Design, coordinate, and communicate to interested parties a pilot monitoring program to assess cumulative effects.
•
Initiate development of an adaptive management system for COE habitat restoration monitoring that will identify the most important monitoring activities and establish guidelines for data management and dissemination.
•
Further develop the conceptual model and begin to apply it to planning restoration projects and identifying research needs.
To achieve these objectives, field studies will be required. In the next section, preliminary elements of a field study plan are outlined.
6.2.1 Field Studies in 2005 The purpose of the 2005 cumulative effects field studies is to initiate the evaluation of methods to assess and document the cumulative effects of restoration projects on the Columbia River estuary. The studies are based on efforts to develop standardized monitoring protocols and a review and synthesis of approaches to measure cumulative effects, both accomplished in 2004. Thus, field studies in 2005 have the following objectives: 6.4
Evaluating Cumulative Ecosystem Response to Restoration Projects in the Columbia River Estuary, 2004
1. Initiate the testing and evaluation of the “minimum” habitat monitoring metrics and protocols recommended for all restoration projects in the estuary; 2. Initiate the evaluation of the candidate “higher order” metrics expected to contribute to evaluating the cumulative effects of all restoration projects in the estuary. Both objectives contribute to the improvement of predictability, or the aim of identifying specific conditions that when created or restored in the CRE will produce certain outcomes in terms of the availability of habitats and their use by salmon. 6.2.1.1 Rationale Objective 1 continues the development of the monitoring protocols manual that was drafted in 2004, addressing remaining uncertainties in the selection and availability of particular methods to meet specific needs. During 2003-4 we developed a draft set of minimum recommended habitat monitoring protocols for the specific purpose of standardizing data collection at both restored and reference sites in the estuary. Having data collected on a set of metrics in a standard way facilitates comparisons among sites. In addition, it assures that the results from a growing set of restoration projects can be assessed for the entire ecosystem. That is, the results can be “added up” as part of the evaluation of the total effect of multiple restoration projects throughout the estuary. Finalizing the monitoring protocols manual requires the testing, development and customization of monitoring techniques for the CRE in a 2005 field study. Some monitoring protocols are general in nature or adapted from another estuary and, thus, require directed research to be applied specifically to the CRE. This fieldwork is necessary to ensure that the best available monitoring methods are applied. This year’s work will provide valuable information on the logistics and difficulties of implementation of the protocols, which will help to refine the protocols. Field research is also needed to develop methods for the cumulative assessment of restoration in the CRE under Objective 2, in order to evaluate “higher-order” metrics of cumulative effects, which typically represent fundamental ecosystem processes. This topic is currently not well understood and therefore the candidate higher-order metrics identified in 2004 will be evaluated through systematic data collection and analysis. Because data collection for objectives 1 and 2 will occur at the same sampling locations, much of the evaluation of higher-order metrics for Objective 2 will consist of conducting additional analyses on data collected to meet the requirements of Objective 1; in order to maximize efficiency, only a small proportion of the higher-order metrics require additional data collection in the field. Thus, the 2005 field studies are focused on any field research necessary to finalize the cumulative effects monitoring protocols manual and to develop a framework, indicators and methodology for cumulative effects assessment and adaptive management. The studies should not be construed as regular monitoring for the cumulative effects of restoration, which can only be conducted once the methodology has been tested. However, the data collected is expected to serve as important baseline and postimplementation information at the specific restoration sites selected for sampling before and after tidal inundation is restored.
6.5
Evaluating Cumulative Ecosystem Response to Restoration Projects in the Columbia River Estuary, 2004
6.2.1.2 Sampling Locations Field studies to address the objectives are expected to be conducted within two habitat types in the estuary: brackish or freshwater marsh and freshwater swamp. Large areas of swamps and marshes have been lost in the estuary (see Chapter 1 and Chapter 2) and due to the differences between these systems, particularly those associated with plant dominants (e.g., tree species in the swamps versus herbaceous or shrubby plants in marshes), they can be expected to have different responses to restoration treatments. Swamps and marshes also provide different habitat characteristics for salmon (i.e., with respect to plant productivity (detritus and associated invertebrate prey) and refugia characteristics (coniferous versus deciduous dominants). Within each one of these habitat types, we will conduct studies in one restoration site and in at least one reference site. Data from the reference sites will be used to help interpret data collected from the restoration sites as per standard procedures for post-restoration monitoring. Site selection is based in part on the timing of planned restoration, because the monitoring protocols require collecting data before and after implementation of restoration measures. Thus candidate restoration sites for field studies include the Johnson property and Kandoll property on Grays River; the Deep River site on Grays Bay; Charnelle Fee site on Youngs River (Youngs Bay); Lewis and Clark site on the Lewis and Clark River (Youngs Bay); Vera Slough (Youngs Bay), and the Ramsey Wetland Complex at the Lower Columbia Slough near the confluence of the Willamette and Columbia rivers. Dike breaches or removals are among the restoration measures at five of the six sites, and implementation has either occurred recently or is planned for the 2005 field season. Other restoration measures at the sites include tide gate removals or replacements, culvert removals or replacements, channel excavation, vegetation planting and invasive species management. Reference sites corresponding to each of the candidate sites are currently being identified, as the existence of suitable reference sites (i.e., geographic proximity, ecological similarity) is one criterion for the ultimate selection of restoration sites for field studies. Sampling points for each metric at each site will be developed on the basis of statistical requirements and monitoring protocols, using the base maps (i.e., aerial photograph and topographic layers) and an inspection of each selected site. 6.2.1.3 Attributes to be Sampled The five indicators and corresponding nine monitored attributes2 identified in Table 5.2 make up the minimum metrics recommended for all restoration projects in the CRE. The sampling protocols for the attributes are presented in Chapter 5. The nine attributes should be sampled at the two restoration sites and at a minimum of two reference sites at the frequencies recommended in Chapter 5 (summarized in Table 5.2) unless otherwise noted (i.e., if the recommended frequency is “annual” an attribute would be sampled one time in 2005). The number of sampling locations within each site will be driven by the statistical sampling design; however, the number of sites was selected based on available resources, as is frequently the case in restoration monititoring (Callaway et al. 2001). In addition to the nine minimum
2
The term “indicator” is used to describe a category of measurable “monitored attributes.”
6.6
Evaluating Cumulative Ecosystem Response to Restoration Projects in the Columbia River Estuary, 2004
monitoring attributes, ten candidate “higher-order” indicators of fundamental ecological processes identified in the 2004 literature review should be evaluated as described below. 6.2.1.4 Higher Order Indicators of Fundamental Ecological Processes Many of these “higher order” indicators can be evaluated by using the data collected for the minimum attributes (listed in Table 5.2) and by applying additional analyses. 1. Organic matter export and fate should be quantitatively evaluated by measuring the biomass of vegetation samples collected at “objective 1” vegetation transects at peak and minimum sampling times, and flux may be observed to help characterize the system. 2. Correspondence between plant community and elevation should be quantitatively evaluated by measuring the elevation of “objective 1” vegetation transects and analyzing vegetation data relative to this parameter. 3. Salmonid growth and residence time should be quantitatively measured using a mark and recapture technique at one of the four study sites in a pilot study. 4. Species-area curves should be generated by analyzing “objective 1” vegetation data relative to “objective 1” area restored data, and by analyzing “objective 1” fish presence data relative to channel features such as length, width, and depth and relative to fish collection method. 5. Productivity of swamp and marsh macrophytes should be indexed using the “objective 1” vegetation data and anecdotal observations should be made of productivity on flats (e.g., diatoms, blue-green algae) and productivity of submerged aquatic vegetation to help characterize the system and assess the need for additional quantitative productivity measurements. 6. Hydraulic geometry relationships including the length and width of tidal marsh and swamp channels should be quantitatively evaluated using geographic information systems and the “objective 1” base maps including aerial photograph, survey, LIDAR (for LIght Detection And Ranging a spatial elevation mapping tool), and water elevation layers as available. 7. Salmonid prey may be evaluated on the basis of known correspondence to vegetation and using “objective 1” vegetation data, or, if additional graduate student assistance is available, by the deployment of insect fallout traps or collection of salmon stomachs or benthic cores and subsequent keying of insects to Order (in the latter case, data would also be analyzed relative to vegetation and fish data). 8. Sedimentation and accretion should be evaluated in a comparative study to determine whether two methods (one substantially more expensive), sediment-elevation tables (SET) and horizon markers, produce results that correlate. 9. Nutrient cycling should initially (in 2005) be evaluated through the systematic sampling of water property gradients from the estuary up into restored and reference sites using a conductivitytemperature-depth instrument (CTD) to record conductivity, temperature, depth, optical backscatter, fluorescence/chlorophyll, and by collecting water samples from corresponding locations for nutrients (nitrogen and phosphorus) analysis, bracketing tides and storm events; benthic chambers may also be deployed in later work. 10. Hydrological and flood storage modeling, which requires data including tidal range, topography and soil type, should not be undertaken in conjunction with 2005 field studies; requisite data such as soil
6.7
Evaluating Cumulative Ecosystem Response to Restoration Projects in the Columbia River Estuary, 2004
type should be gathered from existing county surveys and verified in the field and tidal range and topography should be measured in Objective 1. 6.2.1.5 Sampling Design The ability to detect ecological change in a naturally varying environmental system is problematic. We advocate an effectiveness monitoring approach (Hillman 2004), which relies on comparisons between indicator attribute values from sites separated both temporally (before versus after) as well as spatially (control versus impact). The Before After Control Impact (BACI) sampling scheme integrates both temporal and spatial elements into the effectiveness monitoring experimental design (see Chapter 5). Monitored parameters are sampled simultaneously at two (or more) locations (Control versus Impact) during both pre- and post restoration action (Before versus After). It is recognized that difficulties can arise when choosing the control site in areas that have been highly modified. We recommend that, within the various ecological zones of the CRE, regional reference sites be identified and monitored. These areas can provide a range of “target” conditions for restoration activities. 6.2.1.6 Conclusion The ultimate goal is to arrive at a set of relatively simple measures that should provide good quantification of the signature of individual and collective restoration actions on the ecosystem. The two primary focus areas for evaluating cumulative effects are (a) habitat processes and functions, including landscape indicators and (b) juvenile salmon growth and survival. Habitat processes such as primary production support a number of functions associated with shallow water habitats such as food webs, organic matter flux, nutrient retention, sediment trapping, etc. These and other functions have been altered to a greater or lesser degree as a result of alteration of habitat and flow regime. Restoring the ecosystem means restoring these functions and the processes that support them. As described in the 2004 annual report (Diefenderfer et al. 2005), we also found that the evaluation of processes and functions should be conducted within a hydrogeomorphic/landscape context and at the appropriate scale. For example, the process of primary production is driven by the amount and type of vegetation, along with the total area of the ecosystem complex. In addition, factors such as wetting and drying, sediment type, and slope control the types and amounts of vegetation as well as the rate of production. Therefore, measurements in the 2005 field studies should be made at the appropriate scale and intensity and allocated within a hydrogeomorphic/landscape context. In part, this initial sampling should allow us to gain an understanding of how to conduct sampling in this manner. Juvenile salmonid growth and survival is linked to the factors controlling habitat processes as well as the habitat processes themselves. For example, the size of a shallow water habitat complex may be driven by tidal inundation and topography and correlated with the size, number and complexity of channels. Channels provide both the access to the productive marsh water interface where salmon feed, but also provide refuge during higher tides and river stages. In addition, the edge to volume ratio of marsh channels, shown to be important for long-term sustainability of these systems, is a function of size of the site. The benefit to juvenile salmon is a function of energy demands versus energy gains. Accessibility, prey production, reduced predation, lower current velocities, high edge to volume ratio, etc. are metrics that affect benefit. During 2005 we recommend initiating studies to evaluate methods to assess benefits to juvenile salmon in an attempt to assess the overall benefit to fish through measurement of growth and
6.8
Evaluating Cumulative Ecosystem Response to Restoration Projects in the Columbia River Estuary, 2004
residence time in habitat complexes. The methodology is intended to provide an integrated measure of the cumulative effect of habitat complexes of various types on relative fitness of the fish. The tasks for juvenile salmon growth and survival should include fish migration patterns, residence time, and growth.
6.2.2 Multi-Year Study In this section, the relationship of the current reporting year’s study to the 2005 field studies and the overall project objectives is summarized. The overall objectives of this multi-year study (2004-2009) are to: 1. Develop standard monitoring protocols and methods to prioritize monitoring activities that can be applied to CRE habitat restoration activities for listed salmon. 2. Develop the empirical basis for a cumulative assessment methodology, together with a set of metrics, a conceptual ecosystem model, and a conceptual framework depicting the cumulative effects of CRE restoration projects on key major ecosystem functions supporting listed salmon. 3. Design and implement field evaluations of the cumulative effects methodologies by applying standard methods, a COE geographic information system (GIS) database of habitat types and land ownership (private, federal, state, local), and sensors or remotely operated technologies to measure throughecosystem response of the cumulative effects of multiple habitat restoration projects on listed salmon. 4. Develop an adaptive management system including data management and dissemination to support decisions by the COE and others regarding CRE habitat restoration activities intended to increase population levels of listed salmon. This is a multi-year project that started in FY04. Table 6.1 summarizes progress to date for the tasks under each objective and indicates level of effort recommended for FY05 (Year 2). Status is as of December 31, 2004.
6.9
Evaluating Cumulative Ecosystem Response to Restoration Projects in the Columbia River Estuary, 2004
Table 6.1. Multi-Year Project Objectives and Tasks Objective 1. Standard monitoring protocols
2. Develop the empirical basis for a cumulative assessment methodology
3. Design and implement pilot field evaluations of the cumulative effects of restoration projects 4. Develop an adaptive management system
Task 1.1: Review literature 1.2: Review ongoing monitoring activities 1.3: Conduct an information exchange meeting 1.4: Develop a protocols manual 1.5: Identify deficiencies and perform focused field evaluations 2.1: Review new literature 2.2: Revise metrics for a cumulative assessment 2.3: Develop conceptual ecosystem model and cumulative effects framework 2.4: Summarize the cumulative effects methodology 2.5: Field-test cumulative assessment method(s) 3.1: Design and implement pilot field evaluations 3.2: Establish GIS database 3.3: Coordinate and communicate
4.1: Prioritize COE monitoring activities 4.2: Develop guidelines for data production 4.3: Provide specifications for a webbased database 4.4: Develop a landscape-scale adaptive management system 4.5: Coordinate and communicate to disseminate data
Status as of 12/31/04 Done; revise as new information becomes available Done; revise as new information becomes available Done; repeat if necessary as new information becomes available Started; primary task in FY05 Started; primary task in FY05 Done; revise as new information becomes available Done; revise as new information becomes available Done; revise as new information becomes available Started; primary task in FY05 Not started; primary in FY05 Not started; start in FY05 Done; revise as new information becomes available Started; primary task in FY05
Started; primary task in FY05 Not started; primary in FY05 Not started; start in FY05 Not started; start in FY05 Ditto
6.3 Management Implications Ultimately, this study will serve to consolidate our understanding of the variety of restorative and management actions that could result in benefits to ecosystem processes and to habitat structure in the Columbia River estuary. This is critical since the CRE system is highly important to potentially competing uses such as agriculture, shipping, and recreation. The study will provide a comprehensive guide to actions that effectively mitigate the ecosystem effects of these uses. This project also has direct and indirect management implications for resource management agencies, environmental organizations, and federal Action Agencies in the Columbia Basin.
6.10
Evaluating Cumulative Ecosystem Response to Restoration Projects in the Columbia River Estuary, 2004
6.3.1 Management Implication No. 1 – Decisions on Implementing CRE Habitat Restoration Projects There is enormous potential to establish effective habitat restoration strategies, as well as management of the Columbia River Estuary system as a whole, using a comprehensive dataset developed from a standard set of monitoring protocols. Given the standard protocols, the application of the data in a management scheme with a definitive programmatic infrastructure will be instrumental to 1) coordinate among groups conducting habitat restoration projects; 2) promulgate the protocols; 3) compile and analyze the data; and 4) develop specific management recommendations. The details for the makeup of such an infrastructure are not established at this point of the study. However, representation could include a diversity of groups from non-governmental organizations and regulatory agencies alike. In short, the outcome of analysis produced by this infrastructure could provide insight to ecosystem processes not fully understood by resource managers and regulators. Provided mechanisms are in place that are transparent and understood, managers can apply this information as important “lessons learned" for future restoration treatments and regulatory guidance (i.e., coastal zone management, shoreline master plans, flood hazard mitigation, etc.). In addition, reporting requirements are specified in the protocols so that data would be submitted in a standard format, which facilitates data interpretation. If applied widely, these indicators and protocols will provide the basis for inter-comparison among all restoration projects, and for accumulating the net results in terms of quantifiable metrics. For example, managers will be able to identify how much area is restored, how much of that area is comprised of the various habitat types, and how much plant matter is produced and exported to the estuarine food web. We will also be able to assess impediments to full restoration and established goals for projects, and identify ways to fix problems with poorly performing sites. These ultimately will help improve the success of the projects and result in more cost-efficient projects. The results can then be rolled up into summaries for both internal and external reports produced by agencies.
6.3.2 Management Implication No. 2 – Evaluation of the CRE Habitat Restoration Effort Despite the challenges, developing and implementing appropriate indicators and methods is the best way to enable estuary managers to track the effectiveness of their large investments in estuary habitat restoration projects and to improve conservation and restoration measures over time. The study is directed at showing whether projects have a “signal” in the ecosystem. For example, one signal in the Mississippi River delta is the amount and rate at which marsh area is regenerating. This signal has direct and indirect implications for maintaining ecological functions in the system, as well as reducing threats to infrastructure, such as roads, on the delta. In a similar way, restoration of ecosystem complexes in the CRE has direct and indirect implications for key processes and functions, such as organic matter production, biodiversity, and juvenile salmon fitness. Analogous to the protection of roads in Louisiana is the protection of roads, homes, and businesses through the flood storage capacity afforded by tidal wetlands and swamps in the CRE. The cumulative effects methodologies we are developing are intended to allow managers the capability to measure the effects of the CRE habitat restoration effort on a collective basis. The field sampling protocols (see Chapter 5) will allow sampling methods and database
6.11
Evaluating Cumulative Ecosystem Response to Restoration Projects in the Columbia River Estuary, 2004
development to be standardized, in turn permitting data to be analyzed estuary-wide. This will apply directly to the prioritization of environmental restoration and research monies.
6.3.3 Management Implication No. 3 – Water Resources Development Act: Restoration in the Columbia River Estuary Other authorities under which the Corps can develop restoration projects are Section 1135 of the Water Resources Development Act (WRDA) of 1986, Project Modification for Improvement of the Environment; Section 206 of WRDA 1996, Aquatic Ecosystem Restoration; Section 536 of the WRDA 2000, Lower Columbia River Ecosystem Restoration; and Section 306 of WRDA 1990, General Investigation Studies for Environmental Restoration. These four Corps authorities are all expected to benefit from the cumulative ecosystem response analysis. Section 1135 provides the authority to modify existing Corps projects to restore the environment and construct new projects to restore areas degraded by Corps projects. This is a cost shared authority and requires a non-federal sponsor to contribute 25% of the costs. A project is accepted for construction after a detailed investigation shows it is technically feasible, environmentally acceptable, and provides cost effective environmental benefits. Each project must be complete within itself, not a part of a larger project. The maximum federal expenditure per project is $5 million, which includes both planning and construction costs. Currently there are two ongoing Section 1135 projects in the CRE. Section 206 is very similar to Section 1135 and provides authority for the Corps to restore aquatic ecosystems that are not associated or connected with Corps projects. Like Section 1135, a project is accepted for construction after a detailed investigation shows it is technically feasible, environmentally acceptable, and provides cost effective environmental benefits; each project must be complete within itself, not a part of a larger project; and the maximum federal expenditure per project is $5 million, which includes both planning and construction costs. Project costs are shared 65% federal, 35% non-federal. Costs of lands, easements, and rights-of-way are non-federal and are creditable towards the 35% nonfederal cost share. The non-federal sponsor must assume responsibility for operation and maintenance of the project upon completion. Currently there is one ongoing Section 206 project in the CRE. Section 536 provides authority for the Corps to carry out ecosystem restoration projects necessary to protect, monitor and restore fish and wildlife habitat based on recommendations made by the Lower Columbia River Estuary Partnership (LCREP). In November 2004, the National Marine Fisheries Service released the 2004 Federal Columbia River Power System Biological Opinion (BO) for threatened and endangered species (salmon and steelhead). The BO specifies that the endangered salmon and steelhead runs of the Columbia River Basin depend on the estuary for survival. Section 536 will serve as the catalyst to bring together and implement current efforts by a number of governmental and private organizations to identify and cost share restoration projects. These organizations include the National Estuary Program; six state agencies from Oregon and Washington, four Federal agencies, recreation, ports, industry, agriculture, labor, commercial fishing, environmental interests as well as private citizens. Currently there are four active Section 536 projects, one under construction and three in the study phase. Section 306 provides authority to the Corps to undertake studies and build projects for environmental restoration and for water and related land resources problems and opportunities in response to directives, called authorizations, from the Congress. Congressional authorizations are contained in public laws, and 6.12
Evaluating Cumulative Ecosystem Response to Restoration Projects in the Columbia River Estuary, 2004
in resolutions of either the House Transportation and Infrastructure Committee or the Senate Environment and Public Works Committee. The focus of the studies is on determining whether a Federal project responding to the problems and opportunities of concern should be recommended, within the general bounds of Congressional interest, in authorizing Federal participation in water resources development. Presently the Corps has one ongoing General Investigation Study involving in the CRE. Although the emphasis of the cumulative ecosystem response analysis was originally the lower Columbia River and estuary, with an emphasis on ESA listed salmonids, it is apparent the outcome will have much farther reaching effects. In this study, a conceptual model of the site and landscape is presented as a central organizing structure for predicting and evaluating changes to the system following restoration, following an Institute for Water Resources study (Thom and Wellman 1996). This is responsive to USACE directives that restoration projects be conceived in a systems context (USACE 2000) using an ecosystem and/or watershed approach (USACE 1999). The implementation of ecological tools and concepts in the USACE planning process for ecosystem restoration continues to develop (Pastorok et al. 1997; Thom 1997; Yozzo et al. 1996). Thus, this study builds on earlier ecological understanding and existing planning tools to create an approach that supports several key planning processes associated with ecosystem restoration projects in the estuary, including those without fisheries-related goals. These processes include project prioritization, project effectiveness evaluation, and adaptive management. Restoration projects developed under any of the four Corps authorities can apply the results of this analysis. Additionally, other Corps and national ecosystem restoration programs will likely benefit from this work. It is not to say that this will be the blueprint for the evaluation of all ecosystem restoration activities, however it likely will act as the outline and guiding documentation for additional works to come.
6.3.4 Management Implication No. 4 – Effects on Listed Salmonids Subyearling fall Chinook salmon (Oncorhynchus tshawytscha) from endangered stocks in the Snake River migrate downstream through the lower Columbia River and estuary in summer and fall. These fish are hypothesized to benefit from shallow-water habitats in the tidal freshwater reach of the lower river (R Km 74-235) for feeding and refuge.3 Accordingly, in its September 2004 draft Biological Opinion4 on hydrosystem operations, NOAA Fisheries identified these lower Columbia River habitats as important to the continued existence of the Snake River evolutionarily significant unit. Overall, however, little is known about the presence of juvenile salmonids in shallow water habitats in the tidal freshwater reach of the lower river.5 Furthermore, fish sampling as part of status and trends monitoring in the tidal freshwater reach is sparse, as opposed to the relatively intensive sampling for juvenile salmon in the estuary proper
3
E. Casillas. 2004. Memorandum to R. Walton. (F/NWR1, NOAA Fisheries). August 31, 2004. In: NOAA Fisheries (2004). (See citation in the following footnote.)
4
NOAA Fisheries. 2004. Biological Opinion on Operation of the Federal Columbia River Power System. State/Tribal review draft. Log Number F/NWR/2004/00727. September 8, 2004.
5
Estuary/Ocean RME Subgroup. 2004. Plan for Research, Monitoring, and Evaluation of Salmon in the Columbia River Estuary. Final draft. Bonneville Power Administration. Portland, OR. August 10, 2004. 6.13
Evaluating Cumulative Ecosystem Response to Restoration Projects in the Columbia River Estuary, 2004
(rkm 0-74). Thus, there is a need for CRE research to address the gap for tidal freshwater fish sampling, especially for subyearling Chinook salmon, and to link this research with that elsewhere in the lower Columbia River and estuary. Furthermore, the NOAA Fisheries’ Biological Opinion and the Action Agencies’ Updated Proposed Action6 in 2004 specifically supported the habitat restoration effort currently underway at the Sandy River delta near Troutdale, Oregon. The cumulative effects assessment methods will include protocols to sample listed subyearling fish and, therefore, will be useful to managers working to protect this depleted population.
6.3.5 Management Implication No. 5 – Columbia Basin-Wide Cumulative Effects Assessments The Northwest Power and Conservation Council’s Fish and Wildlife Program involves the implementation of over $100M annually on projects for on-the-ground habitat restoration, monitoring, and research in the Columbia Basin. In any given subbasin, multiple habitat restoration projects are conducted, many of which are impractical to individually monitor because of small scale, limited funds, and other reasons. This necessitates monitoring action effectiveness in the form of cumulative effects at the subbasin scale (Jordan et al. 2003). Analysis methods for cumulative effects are currently being developed for the Council’s Fish and Wildlife Program (e.g., Hillman 2004). The objectives of these efforts are analogous to those of the cumulative effects study in the estuary in that both intend to establish the effects of habitat restoration actions on salmon. However, due to inherent differences in the ecological systems, the statistical sampling designs and the sampling methods necessarily differ. Nevertheless, by producing comparable scientific results describing the cumulative effects of restoration actions, managers will be able to assess the relative benefits of monies spent among various habitats from freshwater streams to the estuarine wetlands. Likewise, although metrics will differ (i.e., productivity and survival rates in the tributaties, presence/absence and growth and residence time in the estuary), managers will be able to use the combined data to track basin-wide effects of actions undertaken from the headwaters to the estuary.
6.3.6 Management Implication No. 6 – Collaborative Planning for Large-Scale River Systems Restoration A recent analysis by the National Research Council, clarifying the Corps’ ecosystem restoration mission, demonstrates the complexity of factors that need to be considered in order to restore the hydrologic and geomorphic processes of large river and coastal systems. The NRC (2004a-d) recommended the Corps adopt strategies including the following: integrated large-scale systems planning, adaptive management methods, expanded post-project evaluations, and a collaborative approach. Multijurisdictional environments complicate large-scale river basin and coastal systems planning (e.g. multiple states and tribes in the Columbia Basin), necessitating a collaborative approach. The development of a framework for cumulative effects assessment and standard protocols for the evaluation of individual projects in the CRE by the Portland District in this study exemplifies all four of these NRC recommendations. In effect, standardizing data collection throughout the estuary is critical for
6
USACE, Bureau of Reclamation (BOR), and BPA. 2004. Updated Proposed Action for the Biological Opinion Remand. Final draft. Portland, OR. August 30, 2004. 6.14
Evaluating Cumulative Ecosystem Response to Restoration Projects in the Columbia River Estuary, 2004
analyzing changes following restoration treatments, and the development of a regional protocols manual by the Corps contributes to this end. In earlier Institute for Water Resources assessments (e.g., Harrington and Feather 1996), the identification and inclusion of stakeholders in the planning process was also cited as a means of strengthening the knowledge base in the project planning process. This cumulative effects study has brought together restoration project managers from a variety of organizations (see Appendix A) and included their input in the development of recommendations for minimum monitoring metrics and in the selection of monitoring methods. In 2005, the study will extend this collaborative effort to include a) review of the protocols and cumulative effects assessment procedures by estuarine and fisheries science experts, and b) data collection in conjunction with non-Corps estuary restoration projects to ensure the widespread applicability and adoption of the standard protocols manual, which will be essential to the success of future estuary-wide analyses. Thus, the NRC’s recommendations are guiding the effort to assess the cumulative effects of restoration in the Columbia River estuary. With this study, the Portland District is demonstrating the implementation of national level guidelines – large-scale systems planning, adaptive management, postproject evaluation, and a collaborative approach – in the Pacific Northwest region on the estuary of one of the largest rivers in the nation.
6.3.7 Summary In conclusion, with substantial work already underway to restore aquatic habitats in the CRE to help recover salmon populations, detecting the cumulative effects of multiple restoration projects on the CRE ecosystem is a challenging yet critical problem. Restoration projects are typically expensive, and the return on investment in terms of benefits to the ecosystem often is not well documented or understood. In systems where restoration is conducted at a variety of sites, however, these projects may add up to produce a system-wide benefit. Assessing cumulative effects is critical to understanding whether there has been a net improvement in the ecosystem from restoration actions or whether actions are only effective in a site-specific manner. The problem lies primarily in how to document this effect, especially in large and complex ecosystems like the CRE. This study is an attempt at a systematic approach to developing a cumulative effects assessment of multiple restoration projects in the Columbia River estuary. The key management implication from this study will be the capability to assess whether CRE habitat restoration is having a measurable, cumulative effect on the CRE ecosystem and, ultimately, contributing to the recovery of listed salmonids in the Columbia Basin, especially Snake River fall Chinook salmon.
6.4 Literature Cited Callaway, J.C., G. Sullivan, J.S. Desmond, G.D. Williams, and J.B. Zedler. 2001. Assessment and monitoring. In J.B. Zedler (ed.) Handbook for restoring tidal wetlands, pp.271-335, CRC Press, Boca Raton, Florida. Diefenderfer, H.L., C. Roegner, R.M. Thom, E. Dawley, A.H. Whiting, G.E. Johnson, K.L. Sobocinski, M.G. Anderson, and B.D. Ebberts. 2005. Evaluating cumulative ecosystem response to restoration projects in the Columbia River estuary. Draft report prepared for the U. S. Army Corps of Engineers,
6.15
Evaluating Cumulative Ecosystem Response to Restoration Projects in the Columbia River Estuary, 2004
Portland District by Pacific Northwest National Laboratory Marine Sciences Laboratory, NOAA Fisheries Pt. Adams Biological Field Station, and the Columbia River Estuary Study Taskforce. Harrington, K.W. and T.D. Feather, Evaluation of environmental investments procedures: interim overview manual, IWR Report 96-R-18, prepared for Institute for Water Resources, U.S. Army Corps of Engineers, Alexandria, VA, 1996. Hillman, T.W. 2004. Monitoring strategy for the upper Columbia basin. Draft report prepared for the Upper Columbia Regional Technical Team, Upper Columbia Salmon Recovery Board, Wenatchee, Washington, February 1, 2004. Prepared by BioAnalysts, Inc., Eagle, Idaho. Jordan, C., J. Geiselman, M. Newsom, and J. Athearn (eds.). 2003. Research, monitoring, and evaluation plan for the NOAA-Fisheries 2000 Federal Columbia River Power System biological opinion. Draft. September 11, 2003. Available at http://www.salmonrecovery.gov/implementation NRC (National Research Council). 1992. Restoration of aquatic ecosystems. National Academy Press, Washington, D.C. National Research Council, 2004a. Adaptive management for water resources project planning. Panel on Adaptive Management for Resource Stewardship, Committee to Assess the U.S. Army Corps of Engineers Methods of Analysis and Peer Review for Water Resources Project Planning, The National Academies Press, Washington, DC. National Research Council, 2004b. Analytical methods and approaches for water resources project planning. Panel on Methods and Techniques of Project Analysis, Committee to Assess the U.S. Army Corps of Engineers Methods of Analysis and Peer Review for Water Resources Project Planning, The National Academies Press, Washington, DC. National Research Council, 2004c. River basins and coastal systems planning within the U.S. Army Corps of Engineers. Panel on River Basin and Coastal Systems Planning, Committee to Assess the U.S. Army Corps of Engineers Methods of Analysis and Peer Review for Water Resources Project Planning, The National Academies Press, Washington, DC. National Research Council, 2004d. U.S. Army Corps of Engineers water resources planning: a new opportunity for service. Coordinating Committee, Committee to Assess the U.S. Army Corps of Engineers Methods of Analysis and Peer Review for Water Resources Project Planning, The National Academies Press, Washington, DC. NOAA Fisheries. 2004. Biological Opinion on Operation of the Federal Columbia River Power System. State/Tribal review draft. Log Number F/NWR/2004/00727. September 8, 2004. Rice, C.A., L.L. Johnson, P. Roni, B.E. Feist, W.G. Hood, L.M. Tear, C.A. Simenstad, and G.D. Williams, 2005. Monitoring rehabilitation in temperate North American estuaries. In: P. Roni (Ed.), Monitoring Stream and Watershed Restoration. American Fisheries Society, Bethesda, Maryland, pp. 165-204. Thom, R.M. and K.F. Wellman, Planning aquatic ecosystem restoration monitoring programs, IWR Report 96-R-23, prepared for Institute for Water Resources, U.S. Army Corps of Engineers, Alexandria, VA and Waterways Experimental Station, U.S. Army Corps of Engineers, Vicksburg, MS, 1996. U.S. Army Corps of Engineers, Planning guidance notebook, ER 1105-2-100, U.S. Army Corps of 6.16
Evaluating Cumulative Ecosystem Response to Restoration Projects in the Columbia River Estuary, 2004
Engineers, Washington, D.C., 2000. U.S. Army Corps of Engineers, Ecosystem restoration - supporting policy information, EP 1165-2-502, U.S. Army Corps of Engineers, Washington, D.C., 1999. Pastorok, R.A., A. MacDonald, J.R. Sampson, P. Wilber, D.J. Yozzo and J.P. Titre, An ecological decision framework for environmental restoration projects, Ecological Engineering, 9, 89, 1997. Simenstad, C.A., C.D. Tanner, R.M. Thom and L.L. Conquest. 1991. Estuarine habitat assessment protocol. EPA 910/9-91-037. Prepared for U.S. EPA, Region 10, Office of Puget Sound, Seattle, WA. Thom, R.M., System-development matrix for adaptive management of coastal ecosystem restoration projects, Ecological Engineering, 9, 219, 1997. Thom, R.M., R. Zeigler and A.B. Borde, 2002. Floristic development patterns in a restored Elk River estuarine marsh, Grays Harbor, Washington. Restoration Ecology 10(3):487-496. Yozzo, D., Titre, J. and J. Sexton, eds. Planning and evaluating restoration of aquatic habitats from an ecological perspective, IWR Report 96-EL-4, submitted in association with the U.S. Army Corps of Engineers Waterways Experiment Station and PTI Environmental Services, Bellevue, WA and prepared for Institute for Water Resources, U.S. Army Corps of Engineers, Alexandria, VA, 1996
6.17
Evaluating Cumulative Ecosystem Response to Restoration Projects in the Columbia River Estuary, 2004
.
6.18
Evaluating Cumulative Ecosystem Response to Restoration Projects in the Columbia River Estuary, 2004
Appendix A
Proceedings of the Columbia River Estuary Restoration Project Managers’ Meeting on Restoration Monitoring
Evaluating Cumulative Ecosystem Response to Restoration Projects in the Columbia River Estuary, 2004
Evaluating Cumulative Ecosystem Response to Restoration Projects in the Columbia River Estuary, 2004
Appendix A Proceedings of the Columbia River Estuary Restoration Project Managers’ Meeting on Restoration Monitoring Under the auspices of the USACE AFEP project to evaluate cumulative ecosystem response to restoration projects in the Columbia River estuary, a meeting was convened on June 23, 2004, for the purpose of involving restoration project managers in identifying minimum monitoring indicators and developing appropriate protocols. The meeting was convened by the Lower Columbia River Estuary Partnership, U.S. Army Corps of Engineers, Pacific Northwest National Laboratory, and NOAA National Marine Fisheries Service at the offices of the Estuary Partnership in Portland, OR. At the meeting, staff from PNNL and NOAA Fisheries presented the approach for the cumulative effects assessment, and progress to date including draft tables of minimum indicators and project goals. In turn, restoration project managers presented project monitoring methods and plans, and staff from the Estuary Partnership presented information on planned projects in the estuary. Proceedings of the meeting were prepared by staff of the Estuary Partnership and Pacific Northwest National Laboratory and compiled on a CD, which was distributed by the partnership. Minutes, below, were prepared by Michael G. Anderson.
A.1
Evaluating Cumulative Ecosystem Response to Restoration Projects in the Columbia River Estuary, 2004
Participants Jason Karnezis LCREP1 Matt Burlin LCREP1 Scott McEwen LCREP1 Curtis Roegner* NOAA2 Blaine Ebberts* ACE3 Taunja Berquam ACE3 Ron Thom* Battelle/PNNL4 Heida Diefenderfer* Battelle/PNNL4 Greg Williams* Battelle/PNNL4 Kathryn Sobocinski* Battelle/PNNL4 Michael Anderson* Battelle/PNNL4 Earl Dawley* Consultant5
Allan Whiting* CREST6 Todd Cullison CREST6 Craig Haskell USGS7 Tim Counihan USGS7 Michelle Michaud OPRD8 Jack Wiles OPRD8 Ian Sinks CLT9 Dave Sahagian SBWC10 Robert Warren Sea Resources11 Joe Hymer PSMFC12 Janelle St. Pierre ACFM13
1
Lower Columbia River Estuary Partnership National Oceanic and Atmospheric Administration 3 U.S. Army Corps of Engineers 4 Battelle/Pacific Northwest National Laboratory 5 Consultant- retired- National Marine Fisheries Service 6 Columbia River Estuary Study Taskforce 7 US Geological Survey 8 Oregon Parks and Recreation Department 9 Columbia Land Trust 10 Scappoose Bay Watershed Council 11 Sea Resources 12 Pacific States Marine Fisheries Commission 13 Ash Creek Forrest Management 2
* Cumulative Effects Project Team
A.2
Evaluating Cumulative Ecosystem Response to Restoration Projects in the Columbia River Estuary, 2004
Presentations Standardized Monitoring to Assess the Cumulative Effects of Restoration (Curtis Roegner/Heida Diefenderfer) •
“Evaluating the Cumulative Ecosystem Response to Restoration Projects in the Columbia River Estuary,” a current project being funded by the U.S. Army Corps of Engineers.
•
Within this project a manual of standard monitoring protocols will be produced, but the first step is to determine which habitat parameters need to be measured.
•
Heida described a few frameworks that the project is currently using
•
o
implementation effectiveness and validation monitoring
o
Habitat opportunity
o
Habitat capacity
o
Realized function
Curtis explained the conceptual hierarchy of monitoring protocols. There are two main monitoring avenues that will be used; o
physical features and
o
biological features
•
Both will be measured using the same techniques so they are comparable. The manual in which these will be housed, will provide methodology and recommendations for all features. Also, a time series of measurements is needed (pre and post) monitoring.
•
The purpose of the protocols for project-specific monitoring is to standardize data collection across the estuary and essentially use each site as a sample. All “samples” then can be used to evaluate the cumulative effects of multiple restoration projects within the estuary and plume.
Approaches to Restoration Monitoring: Project and Program (Ron Thom) Ron gave a Power Point presentation on the steps used to construct a monitoring program and associated projects. o
Define goals and objectives (a very important first step).
o
Develop the conceptual model- define controlling factors.
o
Choose performance criteria- (relevant to goal, easily measured, science-based).
o
Choose monitoring parameters and methods (metrics)- measurable and repeatable.
o
Determine level of effort and a cost estimate (are goals being met?, conduct a pre-study to gain confidence in your project).
o
Envision program and determine roles- commitment for the long term.
o
Manage data to assure quality and interpret results.
A.3
Evaluating Cumulative Ecosystem Response to Restoration Projects in the Columbia River Estuary, 2004
o
Manage the contracts.
o
Act on results (adaptive management)- mid-course corrections by project manager if necessary.
o
Disseminate information.
o
In some situations pre-monitoring may be needed to establish a benchmark on which to compare future data.
o
Uncertainties must be researched and projects must tighten up uncertainties in order to obtain funding.
Example Project Monitoring Plan: Grays River Restoration (Allan Whiting and Ian Sinks) o
On the ground projects are poised to begin in Grays River; a dike breach covering 450 acres of land.
o
CREST is establishing protocols for the project (critical need to standardize protocols between agencies).
o
So far the project has established a reference site and 3 treatment sites that will be reconnected to the tide via a dike breach.
o
The team is conducting some pre-monitoring to capture natural variability within the habitat.
o
The overall project needs are; a manual of protocols for monitoring consistency, funding required for QA/QC of data, year by year project guidelines, and a potential stewardship/monitoring fund to help fund pre-monitoring.
o
Another item that was discussed during this presentation and later on in the meeting was the ideas of having a single entity provide monitoring equipment so that each individual restoration project doesn’t need to carry the burden of having to purchase expensive equipment. LCREP could potentially facilitate this need.
Columbia River Estuary Restoration Projects: By Category and Project Managers LCREP -Scott McEwen and Jason Karnezis o
presented a color map of the Columbia River Estuary that depicted four different types of projects; dike breach, chum channel restoration, revegetation projects and tidegate removal. The map contained projects supported by LCREP and others.
PSMFC - Joe Hymer, Lacamas Creek restoration o
Steve Shroeder constructed a monitoring plan in the format of a cookbook, originally for Duncan Creek (a prototype that can be applied to other areas), providing the necessary components for chum channel restoration.
o
The study team conducted some pre-monitoring work to assess project validity. The premonitoring work consisted of spawning ground surveys, fish counts, GPS work to find locations of tributaries and redds and water quality characteristics needed for salmon
A.4
Evaluating Cumulative Ecosystem Response to Restoration Projects in the Columbia River Estuary, 2004
survivability. A watershed geomorphic assessment was also completed to look for slope failure areas. o
The minimum goal for a salmon survival rate within the designed channel is 40% or more.
o
Gravel composition and salmonid juveniles will be monitored after construction.
o
Juvenile salmonids will be put in a strontium bath, which leaves a mark on the otolith. This will help in the monitoring efforts because scientists will be able to track individual fish over their lifetime.
Sea Resources- Robert Warren, Fort Columbia Tidal Wetland Restoration o
This restoration project will be a partial tidal reconnection by removal of a tidegate with the ultimate goal of restoring lost tidal habitats in the Chinook River Watershed and in the process, restore self-sustaining salmon populations.
o
For this project Robert talked about two underlying assumptions; A. Degradation and loss of estuarine habitats has reduced the life history diversity of salmon populations and B. These salmon had life history patterns that used the estuary.
o
The species of salmon they are most interested in are Coho, Chum, Chinook, Coastal Cutthroat, and Steelhead. This study is using pit tags in fish and water quality information to monitor project attributes.
Ash Creek Forrest Management -Janelle St. Pierre, Revegetation Project on Sun Dial Island, Sandy River o
The site has been significantly altered.
o
Originally, the channel was dammed and the flow was diverted into the Little Sandy River. The Forrest Service would like to remove the dam and restore the original channel.
o
The site has been worked on since 1997 and was grazed up until 1991.
o
They are trying to control invasive species by planting Ash, Cottonwood, Dogwood and Willow.
o
This project is currently using three monitoring techniques;
1. Photo point monitoring; 2. Management techniques (adaptive management) to assess success and failure and; 3. Large-scale restoration (50-100 acre restoration blocks). o
They will be monitoring vegetation survival rates as well as monitoring birds every 5 years. The one missing component for the project is the monitoring of fish (pre and post dike removal).
o
Project cost is a major issue.
A.5
Evaluating Cumulative Ecosystem Response to Restoration Projects in the Columbia River Estuary, 2004
LCREP- Scott McEwen, project data matrix (Restoration Projects in the Floodplain and Tidally-Influenced Areas of the Columbia River Estuary from 1999 to the present) o
As a group we checked the matrix for mistakes and added new information to it.
Prioritizing Monitoring Indicators: PNNL- Heida Diefenderfer, table categorizing project goals, Hydrologic Reconnection and Vegetation Enhancement/Improvement projects o How much detail is necessary? We need to make these as comprehensive as possible; we need protocols for minimums as well as more extensive protocols for larger projects. o Need: to prioritize over flights for those attributes requiring aerial photography. o What about duck projects where hydrologic reconnection may not be necessary? NOAA- Curtis Roegner, draft tables containing minimum monitoring requirements for hydrologic reconnection and habitat revegetation projects o Both sets of protocols contain physical and biological features to monitor. o These protocols were designed to be a minimum set that can be used by all entities doing habitat restoration work within the Columbia River Estuary. o These protocols are an attempt to standardize monitoring efforts within the CRE to obtain scientifically valid and comparable data. This would be a primary set of data to collect, but would facilitate the start of “higher order” analysis that may not be feasible for all restoration entities to accomplish.
Overall Meeting Questions, Ideas and Concerns 1. It was flushed out during the talk that equipment used for the monitoring protocols is expensive to purchase. So the idea was brought up of having a single entity (e.g. LCPEP) purchase all the monitoring equipment needed and rent it out to each restoration group. That would also require the guidance of a trained professional to show the group how to use the equipment. LCREP could take a lead in facilitating partnerships between the various restoration groups and the trained professionals. 2. Another issue related to this was the use of aerial photography as recommended for a number of the protocols. It was suggested that projects coordinate their funds to have an estuary-wide assessment completed instead of having each individual restoration project pay for the expensive aerial photographs. 3. Another question that came up during the meeting was, what do you do with the data once it is collected, where is it stored and who will analyze it? The PNAMP program is looking into ways to accomplish this. Also, it was suggested that a web-based system should be implemented for the easy access and sharing of data. 4. How do you get people to commit to long-term monitoring? That is another question that needs to be addressed. The answer that was discussed was to put a line in the grant and that says that you will be funded for X amount of years. Put the amount of money for restoration in the contract. Another idea was
A.6
Evaluating Cumulative Ecosystem Response to Restoration Projects in the Columbia River Estuary, 2004
to give incentives to those who follow the rules. Also, developing partnerships was posed as an option to split large costs. 5. Projects concerning revegetation need to take into account other attributes in addition to vegetation success to get a holistic picture of changes in the landscape.
Conclusion on CRE Monitoring Protocols and Manual All restoration entities showed enthusiasm and need for the minimum monitoring protocol manual and said that what has been proposed is feasible. Some also asked when they would be available for use. Many restoration projects have already begun and many project managers would like to have these sets of protocols as soon as possible. All project sponsors, after reviewing the minimum monitoring protocol tables agreed that they are doable and are consistent with the plans being created now.
A.7
Evaluating Cumulative Ecosystem Response to Restoration Projects in the Columbia River Estuary, 2004
A.8