Abdalla, I. (2007). Evaluating effectiveness of e-blackboard system using TAM framework: A structural analysis approach. AACE Journal, 15(3), 279-287.
Evaluating Effectiveness of E-Blackboard System Using TAM Framework: A Structural Analysis Approach **Invited as a paper from E-Learn 2005**
IBRAHIM ABDALLA United Arab Emirates University Abu-Dhabi, UAE
[email protected]
Recently, the educational settings have witnessed a growing use of web-based ICT applications and courseware development tools to supplement traditional teaching. Limited studies have evaluated effectiveness of such new technologies. In this article, a survey was conducted to evaluate the effectiveness of e-Blackboard instructional platform system in terms of students’ perceptions based on the students’ interactive behaviour with the ICT-rich learning environment. The classical Technology Acceptance Model (TAM) framework was utilized. Results suggest that the ease of use as well as the usefulness of technology positively influences student’s attitudes towards the system, which in turn determines technology’s effectiveness. Perception of usefulness also significantly influences technology effectiveness.
Recent developments in web-based learning have benefited tremendously from the developments in easy-to-use courseware management systems (CMS) such as TopClass, WebMentor, WebCT, and e-Blackboard, all of
Association for the Advancement of Computing In Education Journal, 15(3) which offer almost the same basic features of instructional platform. The CMS e-Blackboard was introduced to the UAE University (UAEU) in 2002 as part of the strategic plan to integrate ICT into the curricula. The UAEU investment in educational software and multimedia was coupled with great efforts to shift to computer-aided classrooms. This shift was materialised by the implementation of the Laptop Project in 2002. The primary objectives of the Laptop Project were to achieve an instructional and learning paradigm shift as well as develop improvements in: (a) curriculum integration and offerings, (b) shifting from lecture-based to student-based environment, (c) furnishing life long learning skills, (d) asynchronous and synchronous communication skills, (e) student-centred learning skills, and (f) team building and cooperation skills. Furthermore, the investment included an expansion of network and wireless connections throughout the UAEU campuses and dorms, together with providing free Internet access to all UAEU community. Training in e-Blackboard and related e-learning multimedia applications was conducted for both students and faculty. Implementation of the web-based delivery mechanisms into the traditional presentation of academic information is largely based on two approaches emphasizing: (a) synchronous teaching methods through mini lectures, class discussions, and in class student teamwork, and (b) asynchronous teaching methods, which are independent of student’s locations and provide 24/7 access to e-course contents. Both approaches use such communication tools in e-Blackboard as e-mail, bulletin boards, and chat rooms for providing interaction among students and faculty. Various e-Blackboard tools are also used by the instructors to manage the e-course and tracking students’ grades and interaction as well as create and post course content and learning aids such as quizzes and external links. This study aimed at evaluating the effectiveness of e-Blackboard instructional tools to enhance the e-learning process. Based on a target sample of undergraduate students, four factors were considered to assess effectiveness: (a) ease of use, (b) perception of usefulness, (c) student’s attitude, and (d) student’s behaviour. In this context, effectiveness is defined in terms of student’s perception following interactions between behaviour and the learning environment. Technology Acceptance Model (TAM) and Technology Effectiveness Model (TEM) were incorporated.
280
Association for the Advancement of Computing In Education Journal, 15(3) EVOLVING PHASES OF E-LEARNING E-learning itself has as many meanings as there are a wide array of components involved in designing different e-learning processes and environments. It varies from one that has a small electronic component to that sophisticated one, which conducts everything through pervasive use of w-ICTs. Such varied meanings would of course yield several models; each of them answers the needs of an e-learning process. Therefore, different e-learning models have different combinations of various blended components (Taha, 2004). Hoppe and Breitner (2003) traced the evolution of asynchronous learning, which took place through three appreciable dominant systems: z
Stand-alone (1950-90)
z
Internet-based (1993-2004)
z
Mobile e-learning (2005- )
METHODOLOGY The study incorporated questionnaire survey designed on theoretical references of previous relevant works (e.g., Rainbow & Sadler-Smith, 2003; Poon, Low, & Yong, 2004). Likert’s five-scale of extremity was employed to indicate the degree of acceptance as 1 indicates strongly disagree unto 5 for strongly agree.
Research Participants A sample of 518 UAEU undergraduate students drawn from colleges of engineering (COE), information technology (CIT), business and economics (CBE), was involved in the questionnaire survey. The surveyed students were enrolled in 24 sections representing 18 e-Blackboard courses. All students in the sample completed at least one web-based course offered through e-Blackboard.
281
Association for the Advancement of Computing In Education Journal, 15(3) Research Instruments and Data Collection The questionnaire was distributed by hand to students while they were sitting for the final Fall-semester (January 5, 2005) examination. The participants were requested to stay for a longer time, after finishing their exam, to complete the questionnaire on their perception of the effectiveness of e-Blackboard. In addition to the demographic information part, the participating students were asked to indicate their perception and level of agreement with a number of measures that have been acknowledged by previous research studies as having an influence on the effectiveness of webbased learning. The measures that were considered in this study included student’s perception regarding (a) e-Blackboard ease of use, (b) usefulness, (c) attitude, and (d) cognitive behaviour. A multistage sampling approach was used to sample students at random. Three colleges were selected. Seven, nine, and eight sections were selected randomly from COE, CIT, and CBE, respectively.
DATA ANALYSIS
Sample Demographics Genderwise, 65% of the respondent population was female students and 35% male students. Respondents’ years of age ranged from 17 to 28 with an average of 20.7 years. Eighty-nine percent (89%) of the student respondents were UAE students, whereas 11% were international students.
Course Websites Experience Thirty-four percent (34%) and 47% of student respondents interacted with instructors and peers over seven times and one to three times per week, respectively. They logged in to the e-course homepage on e-Blackboard more frequently after classes than during classes or weekends. Over 90% of
282
Association for the Advancement of Computing In Education Journal, 15(3) the respondents had good experiences in using a laptop and surfing the Web. Ninety percent (90%) of the respondents do access the Internet at home and/or the university campus. Eighty percent (80%) used compatible modems to the UAEU wireless network for reaching e-resources or scholarly use of the Web.
STRUCTURAL MODEL AND RESEARCH HYPOTHESES Perceived ease of use (PEOU) and perceived usefulness (PU) of technology are the primary constructs of the model for understanding IT use and acceptance (TAM) that was developed by Davis, Bagozzi, & Warshaw (1989). The TAM framework was used to assess the effectiveness of eBlackboard courseware as a web-based learning technology, as well as understanding the interaction between the learners’ behaviour such as involvement, participation, cognitive engagement, motivation, and so forth within an ICT-rich learning environment. Based on previous research, TAM and extended TAM models (e.g., Stoel & Lee, 2003; Selim, 2003) the following TEM was proposed to examine student’s perception of technology effectiveness. The PEOU and PU hypothesized to determine learner’s attitude (LATT) towards the course management system (CMS) technology. These hypotheses were key to tackling the interactions between user behaviour and e-Blackboard environment to determine the effectiveness of the technology (EOT): H1: H2: H3: H4:
PEOU positively influences LATT PU positively influences LATT PU positively influences EOT LATT positively influences EOT
PEOU was conceptualized using six indicators (see Appendix) with a Chronobach’s α reliability coefficient of 0.903. PU was captured using five indicators with a Chronobach’s α reliability coefficient of 0.881. LATT was measured using three indicators; the Chronobach’s α reliability coefficient was given as 0.848. Finally, EOT was based on four indicators; Chronobach’s α reliability coefficient of 0.812 was reported.
283
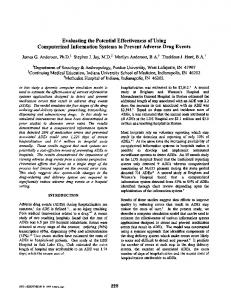
Association for the Advancement of Computing In Education Journal, 15(3) RESULTS LISREL programme was used to estimate the structural parameters of the proposed technology effectiveness model (TEM), based on confirmatory factor analysis (CFA). Figure 1 displays the model fit, parameters, and corresponding t-statistics. Chi-square for the model was given as 257.16 with 130 degrees of freedom; however, due to large sample size effect (n >200), this test was discounted (Sharma, 1996; Tanaka, 1993).
Figure 1. Technology Effectiveness Model (TEM)
Alternatively, a relative chi-square fit index, calculated by dividing the chisquare value by the degrees of freedom ùÓ was given as 1.98 (257.16/ 130). According to Kline (1998), a value of a relative chi-square index of 3 or less suggests an adequate model fit. The Incremental Fit Index (IFI) and Standardized Root Mean Square Residual (SRMR) were given as 0.92 and 0.045, respectively, to suggest a good fit to the data. Other fit indices were also within acceptable limits. These include AGFI, RMSEA, NFI, CFI, and NNFI, which were given as 0.81, 0.043, 0.90, 0.92, and 0.91, respectively.
All path coefficients were significant (p