(RDB) has facilitated editorial review and data mining studies. Simultaneously, the PDF has grown significantly due to strategic collaborations with large ...
EVALUATING EXPERIMENTAL METHODS AND TECHNIQUES IN X-RAY DIFFRACTION USING 280,000 DATA SETS IN THE POWDER DIFFRACTION FILE T. G. FAWCETT, S. N. KABBEKODU, J. FABER, F. NEEDHAM and F. MCCLUNE International Centre for Diffraction Data ABSTRACT Release 2003 of the Powder Diffraction File (PDF) contains ~280,000 unique entries organized in a series of tables in a relational database format. The PDF is available in two products, PDF-4/Full File and PDF-4/Organics, which allow users to access and query over 150 million filled entry fields. An editorial database is used to generate the commercial products that contain tables of experimental details and statistical evaluation criteria used by the editors to evaluate quality and determine quality marks for each entry in the PDF. This editorial database has nearly doubled the searchable entry fields. This database was mined to evaluate experimental methods in X-ray diffraction. Both experimental powder diffraction data and data calculated from predominantly single crystal X-ray structural analyses were assigned statistical quality criteria. For experimental powder data, the average delta two theta values for all d-spacings in the entry set were used. Calculated data were evaluated using R factor values as the primary quality criteria. A Quality Index, which measures the errors in refined unit cell parameters divided by the magnitude of the cell parameter, can be used to compare all types of data. Experimental variables were then analyzed versus these criteria. Variables include optic configuration, (i.e. Seeman-Bohlin, Guinier, Debye-Scherrer), use of internal and external standards, use of monochromators, wavelength divergence, wavelength selection, equipment radius, specimen transparency and specimen absorption. This study significantly differs from prior round robin analyses in that the use of the database allows us to study very large population sets for every variable analyzed. INTRODUCTION The recent conversion of the Powder Diffraction File (PDF) to a relational database (RDB) has facilitated editorial review and data mining studies. Simultaneously, the PDF has grown significantly due to strategic collaborations with large crystallographic database organizations. The data in the PDF now represents a significant population of the world’s X-ray analyses. These two developments were combined to conduct a study of experimental techniques by data mining the large collection of material data sets present in the PDF. EXPERIMENTAL The Powder Diffraction File (PDF) editorial database was used in this analysis. This editorial database is a master database used to generate ICDD’s commercial products. In
comparison to the commercial products it contains additional data fields and in-process data prior to publication. For this study, the in-process data included material data sets that had been entered into the system and had passed initial review by the ICDD’s automated data checking programs, it did not include newly entered data prior to statistical analysis. This corresponds to the data which have passed the second step of the ICDD’s four-tier editorial review process. The ICDD editorial process complies with ISO 9001:2000 standard [1]. The editorial database is very dynamic as data sets are being evaluated, edited and added on a daily basis. Any analysis of this database needs to be done as a snapshot in time. At the time of this analysis, ~ June 2003, the database contained 279,854 unique entries and included in-process material data sets and all material data sets in Release 2003 PDF4/Full File and Release 2003 PDF-4/Organics. By September 2003, the editorial database contained an additional ~68,957 entries in preparation for Release 2004 of PDF4/Organics. The data in the Powder Diffraction File is received from several different sources, converted into a common format and editorially reviewed. In recent years, the ICDD has entered into a series of strategic partnerships with crystallographic database organizations to provide a comprehensive coverage of materials for the diffraction community. Table I outlines the number of material data sets used in this analysis as of June 2003 and the source organizations for the data. Table I. Data Sources for the Powder Diffraction File Editorial Database, Snapshot as of June 2003
Source Organization (Database) International Centre for Diffraction Data (PDF) Cambridge Crystallographic Data Centre (CSD) FIZ Karlsruhe (ICSD) National Institute for Standards and Technology
Material Data Sets
Type of Data
92,011
Powders, Diversified
122,816*
Single Crystal, Organics, Organometallics Powder, single crystal, Inorganics Powder, single crystal, Metals and Alloys
56,614 8,423
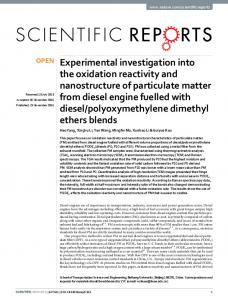
* CSD version 5.18 Since this article’s focus is on experimental methodology, readers need to realize that the PDF editorial database contains significant bias. Every data set has been statistically analyzed and reviewed by the editorial procedures and editorial teams of the source organization and then again by the editorial procedures and staff at the ICDD. This is shown schematically in Figure 1. For example, considerable time and effort has been expended removing duplicate entries from the above sources. The editorial review at the ICDD rejects data from a crystallographic database if the statistical analysis reveals that crystallographic parameters (space group, unit cell, thermal parameters) or structural disorders cannot be resolved sufficiently to accurately calculate a powder pattern. This
has the net effect of removing most of the poorest quality data prior to the database analysis.
Multiple sources, edited to improve quality and produce a common database format. MPDS Data
ICDD Grants
MPDS Editors
FIZ Data
FIZ Editors
ICDD Lit. Search
CCDC Data
CCDC Editors
NIST Data
NIST Editors
For editorial review see ICDD Public Report at www.icdd.com
ICDD Four Step Editorial Review
Data Published in PDF
Figure 1. Editorial work flow for data entries in the Powder Diffraction File. Literature data is extracted or created (grants) by one of six sources. Contributing crystallographic organizations perform an editorial review. Edited data is then processed through a four step review process at the ICDD. Organizations are defined in Table I, MPDS is Material Phases Data Systems.
The editorial database is in a relational database format (RDB) [2]. RDB’s store information in several interrelated tables. The feature gives pliable access to the database facilitating data mining studies [3,4]. The format is compatible with the use of Boolean operators and combined search conditions to rapidly extract information. As shown in Table II, the data itself is organized and classified by dozens of classification systems which are linked to a common chemical name and formula by the PDF number.
Chemical Name Empirical Formula Quality Index Quality Mark Mineral Name Common Name CAS Number Subfile Indicators Mineral Classification Pearson Symbol Zeolite Classification
Radiation Wavelength Filter d-Spacing range Intensity Method I/Ic References Temperature Pressure d-spacings Reliability Factor
System Standardized Cell Parameters Space Group Standard Space Group Cell Parameters Axial Ratios Volume Standardized Cell Volume Z Calculated Z Dobs Instrumentation Dcalc Calc. Molecular Weight Figure of Merit Intensities Melting Point Representative Structure Reduced Cell Color Optical Properties Miller Indices
Table II. Representative Classification Fields in the Powder Diffraction File
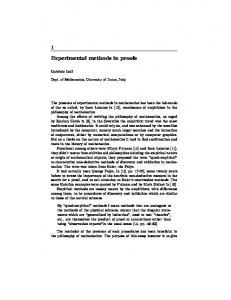
Select fields were queried to examine the influence of experimental technique. These fields related to quality measurements and to instrumental and experimental conditions. DISCUSSION Figure 2 demonstrates the Quality Index distribution for major portions of the PDF. The The quality index is calculated from the estimated standard deviation of a unit cell parameter divided by the value of the unit cell parameter and is measured in parts per million (ppm). For crystallographic systems with multiple cell edges the quality index is averaged, therefore there is a single quality index for each material data set. The number is then converted to a letter scale with each letter representing an order of magnitude in the quality index. For example, a material data set was published for silicon [5], PDF 0027-1402, with a reported a cell edge of 5.43088(4)Å. The measured quality index of the specimen is 7 ppm (0.00004/5.43088 x 106) which translates to a letter of A. If the measured quality index was 70 ppm, this would translate to a letter of B, and so on. Minus denotes the high end of each letter range. In some of the following figures the letters D, E or F are omitted if they had zero population. Numbers in the following figures do not exactly match the numbers presented in Table I since not all data sets have refined unit cell parameters. The exact population studied is given in each figure. The quality index is based on refined peak positions and is a measurement of the precision of the determination.
Quality Index For CSD Sourced Data
Quality Index For ICDD Experimental Data
80
30
70 25 % Population
% Population
60 50 40 30
20 15 10
20 5
10 0
0
A
A-
B
BC Quality Index
C-
D
D-
A
A-
B
BC CQuality Index
D
D-
F
Quality Index for ICSD/NIST Sourced Data 60
% Population
50 40 30 20 10 0 A
A-
B
BC CQuality Index
D
D-
F
Figure 2. Quality Index population distributions (%) for subsets contained in the Powder Diffraction File a) 122,816 material data sets sourced from CCDC, b) 69,882 material data sets sourced from the ICDD and c) 52,534 material data sets sourced from ICSD and NIST.
These data sets have been edited to improve the quality of data. The ICDD editorial system independently calculates and refines a unit cell. This unit cell is compared to the author’s reported value and replaces the author’s cell if the calculation is a significant improvement. The Quality Index populations shown in Figure 2b were taken after editorial review where ~50% of the lattice determinations have been editorially improved. The Quality Index can also be influenced by the type of material being analyzed, its crystallinity, crystal system, and linear coefficient of thermal expansion. The later is important since expansion/contraction is often measured in ppm and temperatures may vary by a few degrees or more during the course of an experiment. For example, the data in Figure 2a are primarily from organic and organometallic compounds. The large population of data with a B- Quality Index would signify high precision considering the high thermal expansion and low symmetry typical in many of these compounds. Alternatively, the larger % populations of A, A-, and B Quality Indices shown in Figure 2c are consistent with the population of well crystallized, low expansion ceramics. The broad distribution of Quality Indices in Figure 2b is consistent with the diversified material base which includes highly crystalline ceramics as well as a large collection of clays and polymers which are dimensionally ordered and/or poorly crystalline. These later materials are often more suitable for analysis by powder diffraction due to these constraints. Star Patterns Distribution
Crystal Structures with R70% star quality designations for analyses using these standards. The excellent results for alumina plate are intriguing since the plate does not correct for specimen displacement which is often cited [8] as the largest source of error in powder diffraction experiments. It does promote the effectiveness of using a pre-prepared specimen in obtaining consistency and high precision. A pre-prepared specimen, such as SRM 1976, reduces specimen transparency and absorption errors [7,8] to a constant. The results are not necessarily contradictory since QI is primarily a measurement of precision, not accuracy. An excellent discussion of the use of cell parameter esd’s and how they compare in interlaboratory round robins is given in reference 10 by Masciocchi and Artioli. They state that precision can often be measured in ppm, but that accuracy beyond 10-4 is difficult to obtain. A similar result was reported on d-spacing accuracy (d-quality) by Wong-Ng and Hubbard [11]. Authors note: At the end of the above study the authors had identified the influence of time on the precision of the data (Figure 3) as well as the influence on the type of standard used (Figure 6). We realized that some of the data trends shown in Figure 6, particularly those for well established older standard reference materials could be influenced by both factors. To separate out the influences we studied only those material data sets supplied by qualified laboratories (ICDD grantee’s) and produced after the year 1990. In studying 4,034 post 1990 data sets using Si as a standard reference material we saw a dramatic improvement in the QI distribution in that the total % of high precision data (A&B Quality Index) rose to ~ 95% of the distribution.
CONCLUSIONS The PDF of ~280,000 materials was data mined to examine trends in experimental methods and quality. The study clearly showed the improvement in quality and precision of X-ray analyses data over the past 100 years and the dramatic improvement in the last 30 years. A nearly linear increase in powder diffraction “star” quality data over the past 30 years can be traced to the practice and use of calibration standards. The study confirmed, with large populations of data, previously observed improvements in precision with the use of focusing and parafocusing optics, larger radii, and the use of incident beam monochromatic radiation. The study also confirmed that matching the angular calibration range of the specimen to the standard is important in obtaining precise data. Greater than 50% of the reported lattice dimensions were improvised by careful refinement during the ICDD’s editorial process. Overall, the quality of large database populations reflects the types of materials studied, the hardware used, and data reduction procedures. Acknowledgements: The authors would like to thank the contributing database organizations, thousands of crystallographers and material scientists, and hundreds of editors around the globe who have made this study of the Powder Diffraction File possible. REFERENCES [1] International Centre for Diffraction Data, “Public Report 2002”, (2002), 4-5. The report is also available at www.icdd.com [2] J. Faber and T. Fawcett, The Powder Diffraction File: present and future, Acta Cryst. (2002), B58, 325-332. [3] S. N. Kabekkodu, J. Faber and T. Fawcett, “New Powder Diffraction File (PDF-4) in relational database format: advantages and data-mining capabilities”, Acta Cryst. (2002), B58, 333-337. [4] J. Faber and F. Needham, “The New Organic Powder Diffraction File: Applications for Polymorph and Search-Indexing”, American Pharmacuetical Review (2002), 70-74. [5] Silicon , PDF 00-27-1402, National Bureau of Standards, Monograph 25, 13, 35 (1976). This data corresponds to Standard Reference Material (SRM) 640. [6] D. B. Cullity, Elements of X-ray Diffraction, Addison-Wesley Publishing Co., Inc., Reading, Massachusetts (1967). [7] H. P. Klug and L. E. Alexander, X-ray Diffraction Procedures, John Wiley & Sons, N.Y., N.Y. (1974). [8] R. Jenkins and R. L. Snyder, X-ray Powder Diffractometry, John Wiley & Sons, N.Y., N.Y. (1996). [9] Standard Reference Materials for X-ray diffraction available from the National Institute of Standards and Technology (NIST) Standard Reference Materials, National Institute of Standards and Technology,100 Bureau Drive, Stop 2322 Gaithersburg, MD 20899-2322.
[10] N. Maschiocchi and G. Artioli, “Lattice Parameter Determination from Powder Diffraction Data: Results from a Round Robin Project”, Methods and Practices, ICDD publishers, Newtown Square, PA (1997). [11] W. Wong-Ng and C. R. Hubbard, “Standard References for X-ray Diffraction, Part II. Calibration Using D-Spacing Standards”, Methods and Practices, ICDD publishers, Newtown Square, PA (1997). ICDD® and PDF® are registered in the U.S. Patent and Trademark Office. Powder Diffraction File is a trademark of the JCPDS-International Centre for Diffraction Data.