Copyright 2000 Institute of Electrical and Electronics Engineers. Reprinted from Proceedings DARPA Information Survivability Conference and Exposition (DISCEX) 2000, IEEE Computer Society Press, Los Alamitos, CA. This material is posted here with permission of the IEEE. Such permission of the IEEE does not in any way imply IEEE endorsement of any MIT/Lincoln Laboratory’s products or services. Internal or personal use of this material is permitted. However, permission to reprint/republish this material for advertising or promotional purposes or for creating new collective works for resale or redistribution must be obtained from the IEEE by sending a blank email message to
[email protected]. By choosing to view this document, you agree to all provisions of the copyright laws protecting it.
Evaluating Intrusion Detection Systems: The 1998 DARPA Off-line Intrusion Detection Evaluation*
Richard P. Lippmann, David J. Fried, Isaac Graf, Joshua W. Haines, Kristopher R. Kendall, David McClung, Dan Weber, Seth E. Webster, Dan Wyschogrod, Robert K. Cunningham, and Marc A. Zissman Lincoln Laboratory MIT, 244 Wood Street, Lexington, MA 02173-9108 Email:
[email protected] or
[email protected]
*This work was sponsored by Rome Laboratory and the Department of Defense Advanced Research Projects Agency under Air Force Contract F19628-95-C-0002. Opinions, interpretations, conclusions, and recommendations are those of the author and are not necessarily endorsed by the United States Air Force.
1
Evaluating Intrusion Detection Systems: The 1998 DARPA Off-line Intrusion Detection Evaluation* Richard P. Lippmann, David J. Fried, Isaac Graf, Joshua W. Haines, Kristopher R. Kendall, David McClung, Dan Weber, Seth E. Webster, Dan Wyschogrod, Robert K. Cunningham, and Marc A. Zissman Lincoln Laboratory MIT, 244 Wood Street, Lexington, MA 02173-9108 Email:
[email protected] or
[email protected]
ABSTRACT A intrusion detection evaluation test bed was developed which generated normal traffic similar to that on a government site containing 100’s of users on 1000’s of hosts. More than 300 instances of 38 different automated attacks were launched against victim UNIX hosts in seven weeks of training data and two weeks of test data. Six research groups participated in a blind evaluation and results were analyzed for probe, denialof-service (DoS), remote-to-local (R2L), and user to root (U2R) attacks. The best systems detected old attacks included in the training data, at moderate detection rates ranging from 63% to 93% at a false alarm rate of 10 false alarms per day. Detection rates were much worse for new and novel R2L and DoS attacks included only in the test data. The best systems failed to detect roughly half these new attacks which included damaging access to root-level privileges by remote users. These results suggest that further research should focus on developing techniques to find new attacks instead of extending existing rule-based approaches.
1. Introduction Heavy reliance on the internet and worldwide connectivity has greatly increased the potential damage that can be inflicted by attacks launched over the internet against remote systems. It is difficult to prevent such attacks by the use of security policies, firewalls, or other mechanisms because system and application software always contains unknown weaknesses or bugs. In addition, complex, often unforeseen, interactions
between software components and/or network protocols are continually exploited by attackers. Successful attacks inevitably occur despite the best security precautions. Intrusion detection systems have become an essential component of computer security to detect these attacks before they inflict widespread damage. A review of current approaches to intrusion detection is available in [1]. Some approaches detect attacks in real time and can stop an attack in progress. Others provide after-the-fact information about attacks and can help repair damage, understand the attack mechanism, and reduce the possibility of future attacks of the same type. More advanced intrusion detection systems detect never-before-seen, new, attacks, while the more typical systems detect previously seen, known attacks. Evaluations of developing technologies such as those used for intrusion detection are essential to focus effort, document existing capabilities, and guide research. For example, yearly DARPA-sponsored evaluations in the speech recognition area have contributed substantially to rapid technical progress [2]. Periodic speech evaluations have focused research on difficult technical problems, motivated researchers to build advanced systems, facilitated information sharing, provided common corpora, and made it easier for new researchers to enter this field and explore alternate approaches [2]. Despite the importance of intrusion detection systems in limiting the damage inflicted by new attacks, we are aware of no evaluations prior to 1998 that (1) Generated an intrusion detection evaluation corpus which could be shared by many
*
This work was sponsored by Rome Laboratory and the Department of Defense Advanced Research Projects Agency under Air Force Contract F19628-95-C-0002. Opinions, interpretations, conclusions, and recommendations are those of the author and are not necessarily endorsed by the United States Air Force.
12
researchers, (2) Evaluated many intrusion detection systems, (3) Included a wide variety of attacks, and (4) Measured both attack detection rates and false alarm rates for realistic normal traffic. Most prior research in this area evaluated individual systems using a small number of attacks and little background traffic (e.g. [3,4,5]) or evaluated systems using confidential inhouse red-teaming experiments where attacks are launched by teams of experts against a test or operational network. An evaluation of many systems with a shared corpus is difficult for many reasons. First, operational networks can not normally be used for evaluations due to service disruptions caused by attacks and the need to maintain privacy and security which mitigates the possibility of sharing network traffic data with others. Second, intrusion detection systems use a variety of non-standardized input data sources including host-based audit data and network traffic data. Finally, existing and new attacks must be developed and successfully launched against a wide range of hardware and software. The goal of the research reported in this paper was to address these issues and perform careful evaluations in support of the DARPA Information Survivability and Information Assurance Programs which have been developing new approaches to intrusion detection [6]. These evaluations were planned to serve the same role for the field of intrusion detection that the DARPA Speech Recognition evaluations serve in the field of speech recognition. The remainder of this paper focuses on the 1998 off-line intrusion detection evaluation. The design goals of this evaluation are reviewed, the approach taken to develop an evaluation test bed is described, the approach taken to developing attacks on this test bed is presented, and results of the 1998 off-line evaluation are then reviewed. A summary and discussion of future plans follow.
2. GOALS AND OVERVIEW The 1998 off-line intrusion detection evaluation was the first in a planned series of annual evaluations conducted by MIT Lincoln Laboratory under DARPA sponsorship. These evaluations are designed to focus research efforts on core technical issues and provide unbiased measurement of current performance levels. The primary purpose of the evaluations is to drive iterative performance improvements in participating systems by revealing strengths and weaknesses and helping researchers focus on eliminating weaknesses. To insure that the greatest numbers of researchers can participate, common shared corpora are created that can be distributed and used by a wide range of researchers. Such corpora simplify entrance into this field and make it possible to compare alternate approaches. To make sure the evaluation could uncover weaknesses in many types of intrusion detection systems, widely varied attacks were developed that span the types of attacks which might be used by both novice and highly skilled attackers. Efforts were also made to keep the evaluation simple and to
encourage the widest participation possible by eliminating security and privacy concerns and providing data types used by the majority of intrusion detection systems. Simplicity and more widespread participation were obtained in the first 1998 evaluation by focusing on UNIX hosts and outside attacks originating from remote hosts. A novel feature of this evaluation is the use of receiver operating characteristic (ROC) techniques to evaluate intrusion detection systems. The ROC approach analyzes the tradeoff between false alarm and detection rates for detection systems. ROC analysis was originally developed in the field of signal detection [7,8]. More recently, it has become the standard approach to evaluate detection systems and have been used in fields as diverse as language and speaker identification [9] and medical risk prediction [10]. ROC curves for intrusion detection indicate how the detection rate changes as internal thresholds are varied to generate more or fewer false alarms to tradeoff detection accuracy against analyst workload. Measuring the detection rate alone only indicates the types of attacks that an intrusion detection system may detect. Such measurements do not indicate the human workload required to analyze false alarms generated by normal background traffic. False alarm rates above 100’s per day make a system almost unusable, even with high detection accuracy, because putative detections or alerts generated can not be believed and security analysts must spend many hours each day dismissing false alarms. Low false alarm rates combined with high detection rates, however, mean that the putative detection outputs can be trusted and that the human labor required to confirm detections is minimized. Most intrusion detection systems provide some degree of configuration to allow experts to customize the system to a given environment. To avoid learning how to run and customize each intrusion detection system, to reduce the time required to perform the evaluation, and to perform a fair comparison, we elected to perform an off-line blind evaluation of all systems. Two sets of data were provided to partipants. First, seven weeks of training data were provided from July to mid September 1998. This training data contained normal background traffic and labeled attacks. Expert users or system developers configured their systems and trained any learning algorithms to achieve the highest detection rates and the lowest false alarm rates on this training data. Then two weeks of unlabeled test data was provided at the end of October. Participants ran their intrusion detection systems on this test data and returned a list of all attacks detected, without knowledge of the locations or of the types of attacks. This approach made it easy to participate, ensured that all participants are evaluated fairly and with minimum bias, and lead to the development of evaluation corpora that can be used by many researches for system design and refinement. Practical
13
1000’s UNIX Hosts 100’s User Automata
Inside Air Force Base Router
•Secretaries •Programmers •Workers •Managers •System Administrators •Attackers
Services/Protocols •http •smtp •pop3 •ftp •irc •telnet
•X •SQL/telnet •dns •finger •snmp •time
Sniffer
Outside Internet
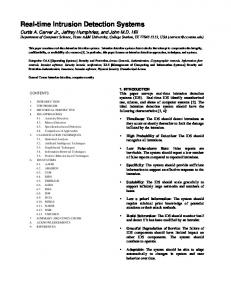
Figure 1. The evaluation test bed creates many types of live traffic using 1000’s of virtual hosts and 100’s of user automata to simulate a small Air Force base separated by a router from the Internet. concerns such as memory requirements, system processor requirements, and ease of use were not measured. A second real-time evaulation was performed in tandem with this off-line evaluation to address these practical issues. This real-time evaluation used four hours of background traffic and included a smaller number of complete packaged systems that could be delivered and run on a test network [11]. It made use of many of the traffic generation tools and attacks developed for the offline evaluation.
3. Evaluation Test Bed Three approaches were initially explored to generate a corpus that could be widely distributed and that included both background traffic and attacks. The first proposal was to capture operational traffic both during normal operations and with controlled live attacks against selected components of an actual network. This was not possible because it would release private information, compromise security, and it could damage systems and stop important network activities. A second proposal was to sanitize sampled operational data and insert attacks into this sanitized data. A few simple analyses showed that this again was not possible due to the difficulty of removing all security-related and private information from network traffic and the complexity of preventing the introduction of artifacts when attacks are inserted. Sanitization alone would require examining every email message, file transfer, and browser interaction to eliminate private or confidential information. It would also require changing all user names, IP addresses, file names, system names, and any other site-specific information. The final proposal, which we followed, was to recreate normal and attack traffic on a private
network using real hosts, live attacks, and live background traffic. Figure 1 shows a conceptual view of the evaluation test bed that was created. This test bed generates live traffic similar to that seen between a small Air Force base and the Internet. Custom software automata simulate hundreds of programmers, secretaries, managers, and other types of users running common UNIX application programs. In addition, custom software allows a small number of actual hosts to appear as if they were 1000’s of hosts with different IP addresses. Many types of traffic are generated which use a variety of network services. User automata send and receive mail, browse web sites, send and receive files using FTP, use telnet to log into remote computers and perform work, send and receive IRC messages, monitor the router remotely using SNMP, and perform other tasks. The overall proportion of traffic from different services and the variability of traffic with time of day are similar to that observed on Air Force Bases. Protective devices such as firewalls were omitted because the focus was on detecting attacks, and not preventing attacks. All attacks are launched from the outside of the simulated base and thus evidence of each attack is available in the network traffic captured by the sniffer positioned at the entrance to the base. Figure 2 shows a more detailed block diagram of the evaluation test bed. The inside of the simulated Air Force base contains three machines which are the most frequent victims of attacks (Linux 2.0.27, SunOS 4.1.4, Sun Solaris 2.5.1), and a gateway to hundreds of other inside emulated PCs and workstations. The outside of the simulated base simulates the Internet. It contains a sniffer to capture traffic, a gateway to hundreds of emulated workstations on many other subnets and a second
14
INSIDE
OUTSIDE
INSIDE GATEWAY
OUTSIDE WS GATEWAY
OUTSIDE WEB GATEWAY
PC
WORK STATION
PC
WORK STATION
WORK STATION
WEB SERVER
PC
WORK STATION
WORK STATION
WEB SERVER
WORK STATION
WEB SERVER
CISCO ROUTER VICTIMS LINUX
SUNOS
DISK DUMPS
SNIFFER
SOLARIS
SOLARIS
AUDIT DATA
SNIFFED DATA
Figure 2. Detailed block diagram of test bed with three inside victims, gateways, and three types of collected data. gateway to thousands of emulated web servers. Data collected to evaluate intrusion detection systems include network sniffing data from the outside sniffer, Sun Basic Security Module (BSM) audit data collected from the Solaris host, and nightly full disk dumps from the three UNIX victim machines. In addition to automatic traffic, human actors sometimes generate background traffic and attacks from the gateways when the traffic or attack is too complex to automate.
4. Background Traffic Generation Background traffic was necessary to determine the false alarm rates of intrusion detection systems. A large amount of web, telnet, and mail traffic was generated between the inside PC’s and workstations and the outside workstations and web sites. In addition, there are many user automata of various types (e.g. secretaries, programmers, managers) on outside workstations who perform work using telnet and other services on the three inside victim machines and the other inside workstations. The three gateway machines contain operating system kernel modifications similar to those used in [11] in conjunction with custom software web, mail, telnet, and other servers to allow a small number of actual hosts to appear as if they were 1000’s of hosts with different IP addresses. The contents of network traffic such as SMTP, HTTP, and FTP file transfers are either statistically similar to live traffic, or sampled from public-domain sources. For example, some email message contents are created using statistical bigrams frequencies to preserve word and two-word sequence statistics from a sampling of roughly 10,000 actual email messages to and from computer professionals filtered using a 40,000 word dictionary to remove names and other private information. Other email messages are actual messages from a variety of public-domain mail list servers. Similar approaches were used to produce content for FTP file transfers.
Content of the web servers was initially captured using a custom web automaton that was run on the real Internet. This automaton was programmed to visit thousands of web sites popular with university and government personnel with a frequency that depended on the site’s popularity and to visit a random number of links at each site before traversing to another site. It generated a large database of public-domain site content, which was transferred to the evaluation test bed. This was necessary because the evaluation test bed was disconnected from the Internet for security reasons and live web sites could thus not be accessed. When the test bed was run, browsing automata accessed web pages through the outside web gateway. This gateway used custom software to emulate thousands of web sites. Telnet sessions were generated from statistical profiles of user types that were used to generate interactive sessions. These statistical profiles indicated the frequency of occurrence of different UNIX commands (e.g. mail, lynx, ls, cd, vi, cc, and man), typical login times and telnet session durations, typical source and destination machines, and other information. For example, programmers primarily edited C programs, compiled these programs, sent mail, read UNIX manual pages, and ran programs. Secretaries edited documents, and sent mail. There were also a large number of users who primarily sent and received mail and browsed web sites. Public domain sources were used to obtain software programs created by simulated programmers, documents created by secretaries, and other content. As suggested in [3], a modified version of the expect language was used to create user automata which behaved as if they were users typing at keyboards. Human actors performed more complex tasks. They upgraded software, added users, changed passwords, remotely accessed programs with graphical user interfaces, and performed other system administration tasks.
15
Table 1. Attack types used in the evaluation. New attacks that occurred only in the test data are bold. Denial Of Service
Remote to Local
User to Root
Surveillance/ Probing
Solaris
SunOS
Linux
apache2 back mailbomb neptune ping of death process table smurf syslogd udp-storm dictionary ftp-write guest http-tunnel phf xlock xsnoop
apache2 back land mailbomb neptune ping of death process table smurf udp-storm dictionary ftp-write guest phf xlock xsnoop
at eject ffbconfig fdformat ps ip sweep mscan nmap saint satan
loadmodule
apache2 back mailbomb neptune ping of death process table smurf teardrop udp-storm dictionary ftp-write guest imap named phf sendmail xlock xsnoop perl xterm
ip sweep mscan nmap saint satan
5. Attacks The 32 different attack types shown in Table 1 were used in the evaluation. Attacks used during both training and testing are shown using normal type. New and novel never-before-seen attacks used only in the test data are shown in bold. Detailed information on these attacks is available in [12]. Attacks were selected to permit evaluation of UNIX intrusion detection systems that protect Sun Solaris, SunOS, and Linux hosts and routers. The attacks had a variety of goals. The upper row of Table 1 contains denial of service (DoS) attacks designed to disrupt a host or network service. Some DoS attacks (e.g. smurf) exessively load a legitimate network service, others (e.g. teardrop, Ping of Death) create malformed packets which are incorrectly handled by the victim machine, and others (e.g. apache2, back, syslogd) take advantage of software bugs in network daemon programs. The second row of Table 1 contains Remote to Local (R2L) attacks. In these attacks, an attacker who does not have an account on a victim machine, sends packets to that machine and gains local access. Some R2L attacks exploit buffer overflows in network server software (e.g. imap, named, sendmail), others exploit weak or misconfigured security policies (e.g. dictionary, ftp-write, guest) and one (xsnoop) is a trojan password capture program. The snmp-get R2L attack against the router is a password
ip sweep mscan nmap saint satan
Cisco Router
snmp-get
ip sweep mscan nmap saint satan
guessing attack where the community password of the router is guessed and an attacker then uses SNMP to monitor the router. The third row of Table 1 contains user to root (U2R) attacks where a local user on a machine is able to obtain privileges normally reserved for the UNIX root or super user. Some U2R attacks exploit poorly written system programs that run at root level which are susceptible to buffer overflows (e.g. eject, ffbconfig, fdformat), others exploit weaknesses in path name verification (e.g. loadmodule), bugs in some versions of suidperl (e.g. perl), and other software weaknesses. The bottom row of Table 1 contains probe or scan attacks. These include many programs that can automatically scan a network of computers to gather information or find known vulnerabilities. Such probes are often precursors to more dangerous attacks because they provide a map of machines and services and pinpoint weak points in a network. Some of these scanning tools (e.g. satan, saint, and mscan) enable even an unskilled attacker to check hundreds of machines on a network for known vulnerabilities. Attack development was a major effort that involved many components. First the attack mechanism was analyzed and a working attack was developed on the evaluation test bed for analysis and tuning. This analysis was performed to determine whether the attacked worked in the test bed or whether new software and/or services are required to support the attack. It
16
enabled us to capture the types of network traffic generated by the attack, to develop stealthy versions of the attack, and to design additional background traffic to run during the evaluation that provides normal usage of services and/or programs required by the attack. For example, to make attacks that generate X-windows traffic more difficult to detect, normal users also generate some X-windows traffic during the evaluation. The attack was then automated, stealthy versions of some attacks were developed and tested, procedures were developed to verify that the attack worked, required background traffic was generated, and documentation was created. This process required from one week to one month per attack. In some cases, transcripts of actual Air Force intrusions were used to develop attack scenarios. When such transcripts were not available, attacks were developed using publicly known attacks and accounts of intrusions on civilian computer systems Novel attacks were developed by looking for unexploited system or network weaknesses. The new HTTP-tunnel attack used what looked like normal web browsing to create a covert channel between an attacker and a victim machine. Custom software installed on a victim browsed the web once a day and contacted what looked like a normal web server. This server, however, was a remote attacker who could interact with the victim, download files from the victim, and run UNIX commands on the victim using what looked like normal HTTP replies to queries. This attack was difficult to detect within the large amount of normal HTTP traffic. The novel sendmail buffer overflow attack exploited a weakness in the MIME translation code of a particular version of sendmail. One carefully crafted email message containing a buffer overflow sent to a victim created a new entry in the victim’s password file that allowed an attacker to telnet in and login as root. The novel process-table attack uses up all process table entries on a victim machine. It continuously opens finger connections to the victim at a rate that is fast enough to eventually fill up the process table, but not too fast to trigger system thresholds that would disallow new connections. Finally, the at attack is a
normal buffer overflow that is installed, but then set to run at a later time using the UNIX “at” command. This attack was included to determine whether intrusion detection systems could trace a delayed “time bomb” style attack back to the original network connection where the attack was installed. Half of the U2R and R2L attacks included actions after the attacker achieved root or local access on the victim machine. Actions included modifying or examining the password, shadow, or .rhosts file, creating a suid root shell, using telnet to connect to other sites, and installing trojan executables, a sniffer, or a server on a high level port. Roughly 25% of the U2R attacks were stealthy. The attack source code and outputs of commands issued from root shells were encrypted using uuencode or small custom C programs, wildcards were used to hide critical UNIX commands, actions were delayed, and the setup, attack, and post-attack actions were spread over multiple telnet sessions. In addition, roughly 10% of the probes were made stealthy by running sweeps slowly and by examining ports and/or IP addresses in random instead of sequential order.
6. Labeling Training and Test Data Training data with labeled attacks was first provided to participants from July to mid September 1999 to allow them to tune and train their intrusion detection systems. Unlabeled test data was then provided in late October for a blind evaluation. List files were used to both label attacks in training data and score network connections in unlabeled test data. These files contain entries for every important TCP network connection as well as for ICMP, and UDP packets. Table 2 shows selected lines from a list file containing more than 287,000 entries from one day of training data. List files provided with training data indicated those connections which were parts of attacks and list files returned by participants for test data indicated those network connections selected to be parts of attacks by intrusion detection systems. A separate line in each list file describes each TCP connection and each UDP or ICMP packet. Each line begins with a unique identification number, the start date and
Table 2. Entries extracted from a training list file that labels network connections and attacks for one day. # 1 4 8 9 42 43 44 53 73 76 8383 9966 10096
Start Date 07/03/1998 07/03/1998 07/03/1998 07/03/1998 07/03/1998 07/03/1998 07/03/1998 07/03/1998 07/03/1998 07/03/1998 07/03/1998 07/03/1998 07/03/1998
Start Time 08:00:01 08:00:02 08:01:03 08:01:06 08:01:50 08:01:51 08:01:51 08:01:52 08:01:52 08:01:53 11:12:16 11:46:39 11:49:39
Duration 00:00:01 00:00:01 00:00:01 00:00:02 00:00:29 00:00:01 00:00:01 00:00:01 00:00:02 00:00:01 00:01:26 00:00:01 00:00:01
Service eco/i domain/u smtp smtp ftp http http http ftp-data snmp/u telnet tcpmux 2
Src Port 53 1026 1027 1106 1107 1104 1297 20 161 20504 1234 1234
Dest Port 53 25 25 21 80 80 80 1685 1523 23 1 2
Src IP Address 192.168.001.005 172.016.112.020 172.016.113.084 172.016.113.084 172.016.112.149 172.016.116.044 172.016.116.044 172.016.116.044 197.218.177.069 192.168.001.001 197.218.177.069 205.160.208.190 205.160.208.190
Dest IP Address 192.168.001.001 192.168.001.010 194.007.248.153 135.013.216.191 197.218.177.069 167.008.029.015 167.008.029.015 167.008.029.015 172.016.112.149 194.027.251.021 172.016.113.050 172.016.113.050 172.016.113.050
Attack Score/Name 0 0 0 0 0 0 0 0 0 0 1 Loadmodule 1 Portsweep 1 Portsweep
17
attacks in the training data. The first entry at roughly 8:00 AM is a normal ICMP echo packet. This is followed by normal domain name server, mail, FTP, and web traffic. There is a user to root loadmodule attack in telnet session labeled number 8383 at 11:12 AM and then a portsweep attack begins at 11:46 AM examining lower number ports first and sweeping up. There were more than 287,000 other entries in this list file. The other entries were omitted for clarity. List files also include a short hand notation to indicate when many packets of the same type occur (e.g. ICMP echo-reply packets that are part of a smurf attack) to reduce their size.
time for the first byte in the connection or packet, the duration until the final byte was transmitted, and a service name. The service name contains either the common port name for TCP and UDP connections or the packet type for ICMP packets. Names for non-TCP protocols are terminated by a slash followed by a single letter that indicates the service (e.g. an “i” for ICMP and a “u” for UDP). Following the name are the source and destination port for TCP and UDP connections, the source and destination IP addresses, the attack score and the attack name. The attack score is zero and the name is a dash for connections that are not part of an attack. In the training data, the attack score is set to 1 and the name is a text string to label connections associated with attacks. In the test data, attacks are not labeled. Instead, all attack scores are zero and all attack names are “-“. It is the responsibility of participants to process the test data and then label list file entries corresponding to presumed or putative attacks. Scores of connections associated with attacks were to be set to non-zero values where more positive values indicated greater certainty of an attack. Attack names were to contain either the name of an old attack that was provided in the training data or a more generic attack category name (e.g. probe, DoS, U2R, R2L) for new attacks.
Figure 3 shows all the network connections in a single day of training data corresponding to the list file in Table 2. It illustrates the wide variety of network traffic types, the variation of traffic over a day, the visibility of some network attacks, the relative percentages of different types of traffic, and the duration of common TCP connections. The test bed runs each day from 8:00 AM until roughly 6:00 AM of the next day on every week day as shown by the horizontal axis of this figure. The two-hour gap in the morning is used to upload audit files and sniffer data, to download traffic generation files, to reboot all machines, and to prepare for the next day of the test bed run. The vertical regions in Figure 3 bounded by horizontal lines contain traffic for different services and protocols. The
The list file in Table 2 shows examples of many types of Internet traffic as well as components of two different labeled Service Count X11 2 update/g 0 time 267 snmp 13,151 smtp 3,584 pop3 282 ntp/u 143 ident 309 irc 263 http 4,341 ftp-data 1,987 ftp 392 finger 425 eco/i 127 ecr/i 527,848 domain/u 1,279 telnet other
NEPTUNE (synflood)
FORMAT - 1
SMURF
ROOTKIT (tftp)
335 241,043 6
8
10
12
14
16
LOADPORT EJECT MODULE SWEEP
18
20
22 24 26 Time (hours)
28
30
FORMAT - 2
Figure 3. Network traffic from a single day of training data with attacks labeled.
18
column entries at the left of each region specify the service or packet type and the number of connections or packets of each type. For example there were 3,584 SMTP mail transfer TCP connections, 4,341 web HTTP TCP connections, and 127 echo ICMP packets. Each line segment represents a single network connection and lines representing succesive sessions are displaced vertically slightly and wrap around within each vertical region. The length of the lines represents the duration of each network connection. Lines begin with a greater-than sign “>” and end with a less-than sign “