Statistical Cybermetrics Research Group, School of Technology, University of. Wolverhampton ... Australia uses "citation
Evaluating Altmetrics1 Pardeep Sud, Mike Thelwall Statistical Cybermetrics Research Group, School of Technology, University of Wolverhampton, Wulfruna Street, Wolverhampton WV1 1SB, UK. The rise of the social web and its uptake by scholars has led to the creation of altmetrics, which are social web metrics for academic publications. These new metrics can, in theory, be used in an evaluative role, to give early estimates of the impact of publications or to give estimates of non-traditional types of impact. They can also be used as an information seeking aid: to help draw a digital library user’s attention to papers that have attracted social web mentions. If altmetrics are to be trusted then they must be evaluated to see if the claims made about them are reasonable. Drawing upon previous citation analysis debates and web citation analysis research, this article discusses altmetric evaluation strategies, including correlation tests, content analyses, interviews and pragmatic analyses. It recommends that a range of methods are needed for altmetric evaluations, that the methods should focus on identifying the relative strengths of influences on altmetric creation, and that such evaluations should be prioritised in a logical order. Keywords: Altmetrics, indicators, webometrics
Introduction Evaluating the importance of articles before reading them is important for scholars who lack the time to read all relevant papers and for non-experts passing judgements on researchers for appointment, promotion, funding or other purposes. Although peer review is at the heart of many academic evaluations, the key quantitative indicators have been based upon citations. This is based upon the assumption that articles that have made important contributions to a field of research are more likely to be cited as new investigations build upon their ideas or discoveries (Merton, 1973). Citations have been used to evaluate individual academics or departments, usually in conjunction with peer review and other sources of evidence, such as external funding receipts (e.g., national research evaluation in Australia uses "citation analysis, peer review, research income, esteem measures and applied measures [as well as] the refined journal indicator"2 and the UK uses research income, citations in some cases, peer review, impact statements and PhD completion rates3). More recently, citations have also been added to digital libraries as metadata about articles in lists presented to users. They are sometimes also used to rank search results lists so that the user sees the most cited, and hence perhaps the most important, publications first. A key limitation of citations is timeliness: it may take years for an article to become cited because it must be read and incorporated into future research first, and this then needs to be published for the citation to be indexed. This is a limitation when using citations to help evaluate the work of young scholars or in digital libraries. In the latter case timeliness is a particular problem because scholars who are familiar with a field would mainly need to keep up-to-date with the most recently published work, which would be 1
Scientometrics, in press http://www.arc.gov.au/era/faq.htm 3 http://www.ref.ac.uk/pubs/2011-02/#d.en.69578 2
uncited except in unusual cases. The social web may help to satisfy the need for timely metrics because an article may be publicly endorsed, or at least mentioned, in the social web within hours of publication. For example, those who read or scan new articles on the day of publication may subjectively select the most interesting to tweet or blog about, archive in a reference manager site like Mendeley.com or CiteULike, mention in a social network site or discuss in an online forum. A publisher can thus harvest the social web for article mentions and report these to users as metadata or use it to help rank results lists. Similarly an academic might present a portfolio of social web for their articles as evidence for the impact of their recent work when applying for promotion or tenure (see the EU project on this theme: http://research-acumen.eu/). Observations such as these have led to a new research area, altmetrics (Priem, Taraborelli, Groth, & Neylon, 2011; Priem, Piwowar, & Hemminger, 2012; Bar-Ilan, Haustein, Peters, Priem, Shema, & Terliesner, 2012), which is concerned with metrics for scholarly publications and activities derived from the social web. Nevertheless, whilst it may seem plausible that articles that are mentioned often in the social web are important, evidence of this is needed if altmetrics are to be taken seriously in evaluations. Moreover, given that there are many different parts of the social web, evidence about the value and relative importance of each one for altmetrics would be useful for publishers seeking to use them effectively. Altmetrics also need to be evaluated because articles may be mentioned in the social web for negative reasons, such as to criticise them (Shema, Bar-Ilan, & Thelwall, 2012), to accuse the authors of fraud, to discuss retracted papers (Marcus & Oransky, 2011), for irrelevant reasons such as spam, or automated mentions (e.g., a journal tweeting all its articles, when published), or because they have funny or interesting titles. The social web may also be employed for different parts of the science system, such as by students sharing resources or discussing issues rather than by practicing scientists and so altmetrics may point to different kinds of articles as useful – such as those that are easier to understand. Following on from the above, citations from the social web may indicate a different kind of value than that indicated by traditional citations – for example more oriented towards applications than utility to science (see also: Mohammadi & Thelwall, in press). This is because the social web is used by the general public and may be used by academics differently from the ways in which they cite in scholarly publications. For example, if a social reference sharing service like Bibsonomy is widely used by students then altmetrics based upon it may indicate the educational rather than the scientific impact of publications. Similarly, if it mostly the public that tweet about articles in a particular subject (e.g., health or astronomy) then Twitter-based altmetrics for this subject may indicate the societal impact of articles to some extent (see also Desai, Shariff, Shariff et al. 2012). Hence, altmetrics indicating a type of impact ignored by traditional citation metrics would be particularly valuable to those seeking to assess the quality or utility of research as broadly as possible. Another issue is that the calculation of altmetrics may not be straightforward because it may be difficult to comprehensively and accurately count citations in the social web. As an example of this, the lack of a comprehensive directory of blogs means that it would not be possible to count all citations from blogs. From a different perspective, counting the number of people who bookmarked an article online may be difficult if some people maintain multiple social web bookmarking accounts and others share accounts. There is also a degree of systematic citing on the social web, such as journals tweeting all of their articles, and this may skew metrics. Perhaps most significantly, however, if any
particular altmetric becomes highly valued then authors, editors or publishers may attempt to artificially inflate their scores and the lack of a quality control mechanism within the social web would make this difficult to stop. Evaluating an altmetric is not simple. Even citations, which are produced in a quality controlled environment and have been researched for decades, are controversial in two senses: whether they should be used at all (MacRoberts & MacRoberts, 1996; Seglen, 1998) and how their meaning should be interpreted (i.e., what they indicate) (Moed, 2005). Nevertheless past research into citations, patent citations and webometrics has produced a range of accepted methods for evaluating metrics. This article reviews these methods in the context of their potential use for altmetrics and makes overall recommendations for future altmetric evaluation strategies.
Research Value The purpose of most research-related indicators is to help to distinguish between higher and lower value research. The concept of research value is not simple, however, and there is no universally agreed definition. Studies may be deemed valuable in the extent to which they contribute towards the ultimate goal of research, such as understanding and controlling the natural world (natural sciences) producing and understanding beauty (art) and understanding the nature of what it is to be human (humanities). The arbiters of quality in practice for publications are probably the scholars of the field within which it was written and the senior scholars in particular. This is most evident in the role of reviewers as gatekeepers of quality for journals and often for academic books, conference papers and other outputs, such as art exhibitions and performances. Perhaps partly as a result of this, peer review seems to be often seen as the gold standard of research evaluation. Whilst critics of peer review can point to biases caused by prejudices in the reviewers (Lee, Sugimoto, & Zhang, 2013), such as institutional bias (Peters & Cecia, 1982), sexism (Wennerås & Wold, 1997) (although gender bias seems to have now disappeared from manuscript refereeing in the sciences: "journal reviewers do not reject papers because they are written by women" (Ceci & Williams, 2011)), nepotism (Wennerås & Wold, 1997), bias against research that supports competing theoretical perspectives (Mahoney, 1977), and bias against research competing for limited publication space (Blackburn & Hakel, 2006). Nevertheless, evidence of bias may have been exaggerated (Lee et al., 2013) and there does not seem to be a superior practical alternative, other than combining peer review with other sources of evidence. A range of factors are important in order to judge whether an article is of sufficiently high quality to publish. These factors depend upon disciplinary norms and can also vary by discipline and journal, often appearing on journal web sites as part of the author guidelines. Some common considerations include the following (Bornmann, Nast, & Daniel, 2008; Horrobin, 1990). • Methodological design and soundness (if appropriate). • Novelty of findings, methods or argument. • Relevance or importance of contribution to the field or progress towards field goals (see also Whitley, 2000). • Adequacy of theory and literature references. Whilst the above could be interpreted as binary dichotomies, they are probably all variable along a scale. Even methodological soundness seems to be rarely binary since, outside of the formal sciences, all methods have some limitations. Hence the quality of a paper may be
approximately equated with the extent to which it scores well on the above factors. Given the centrality of peer review, it seems likely that the above factors are also used by scholars, formally or informally, to evaluate published works. It seems logical that articles scoring well on the above factors would be more likely to be highly cited. Presumably authors would not want to base their work on previous studies with poor methods and so would not cite work that fails this test. Moreover, work that is not very novel has little claim to be cited because the prior work that is similar can be cited instead. Finally, articles that are not important to field goals do not point in directions that are useful for scientists to follow. From a wider perspective, however, good research may attract few citations because it solves and closes off an important problem, it is primarily useful for applications or field-related practice or it refutes a previous influential paper (MacRoberts & MacRoberts, 1996). Although inconsistencies in citation counts seem to diminish when taken for a sufficiently large collection of documents (van Raan, 1998; Moed, 2005), this is not helpful when metrics are needed for individual articles. Altmetrics may help in some cases by helping to identify articles that are important even though they are uncited.
Evaluation Methods A range of methods have previously been used to investigate or evaluate academic-related metrics. Although correlation tests seem to be the most popular, other methods are also needed for triangulation, giving different insights into the results. For example, one discussion of patent citations claimed that 10 different types of study would be needed to give enough evidence to validate patent citations for use in evaluations (Oppenheim, 2000). These included investigating the connections between patent citations and various other related phenomena, such as knowledge transfer, as well as investigating the various components of the system that creates patent citations, such as the skill and motives of those creating the citations.
Correlation with peer review and other metrics The most common technique to help evaluate a research-related metric has been to calculate the correlation between it and another source of evidence. This approach has been extensively used in webometrics to evaluate the evidence provided by links to journal web sites or individual articles (Vaughan & Huysen, 2002; Vaughan & Shaw, 2003; Vaughan & Shaw, 2005) or URL citations (Kousha & Thelwall, 2007) to articles or citations from various parts of the web (Kousha & Thelwall, 2008; Kousha & Thelwall, 2009; Kousha, Thelwall, & Rezaie, 2010; Thelwall & Kousha, 2008). It has also been introduced for altmetrics, playing a similar role (Li, Thelwall, & Giustini, 2012). The type of correlation used is normally Spearman because citation data is typically too skewed for the normality assumption of a Pearson test and has too many zeros to be transformed by a mathematical function into a normal (Gaussian) distribution. Given the accepted value of peer judgements, the best correlation to calculate would be between a rank order produced by peer review and the rank order produced by the metric. In practice however, it seems to be difficult to get appropriate experts to rank lists of publications and so citation metrics are often used instead on the basis that citations are an established research impact data source. In theory any other metric that should correlate with research quality could also be used, but there do not seem to be any other easily available logical candidates.
The rationale for calculating the correlation between a new metric and other source of research evidence (e.g., peer review rankings or citation scores) is that if they both reflect the quality of publications then the rankings should be related, giving rise to a positive correlation coefficient. In the hypothetical case that two metrics both measure pure research quality (assuming that this exists) then their correlation would always be positive, with a magnitude determined only by the amount of natural random fluctuations in the data. In the more realistic case that both measure slightly different aspects of research quality (e.g., educational utility or value for future scholarship) then the extent of the correlation would also depend upon how closely related these two aspects were. Finally, most metrics also probably reflect unwanted systematic causes of bias (e.g., institutional bias or time-dependency) which will also affect the correlation and may even change its sign. The potential for systematic causes of bias discussed above means that a positive correlation between a new metric and an established research indicator does not prove that the new indicator measures an aspect of research because the correlation could be spurious or caused by a factor unrelated to research. Conversely, a negative correlation does not disprove the relationship because there may be an underlying research-related positive relationship that is suppressed by a factor unrelated to research. Hence, the onus is on the researcher to remove potential sources of bias as far as possible. For example, it is typical to conduct studies for articles published within a limited time window to reduce the impact of time differences on the results. It is also common to attempt to make collections of articles as homogeneous as possible, such as by taking them all from the same journal or field and excluding reviews. It seems that, in practice, positive correlations are accepted as evidence of a research relationship if there is no obvious source of bias in the comparison made. The normal requirement for the test is that the correlation coefficient is statistically significant and greater than zero.
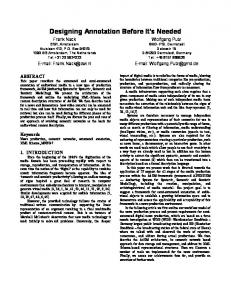
Figure 1. An abstract diagram of factors affecting the relationship between altmetrics and citation counts. Arrows indicate that the source potentially affects the target. All arrows may have different strengths. Altmetric biases might include amusing titles, common biases might include author gender, nationality and publication language, and citation biases might include article type and particular relevance to science itself.
Figure 1 illustrates the major factors affecting the relationship between altmetric scores and citation counts. It can also be used to show the complexity of using correlations between altmetric scores and citation counts as follows. Assume that research quality and common biases do not exist, and that the arrows between citation counts and altmetric scores also do not exist. In this simple case, altmetric scores are affected by biases that do not affect citation counts, such as (hypothetically) the extent to which the articles have funny titles and the extent to which they relate to the social web. Altmetric scores do not perfectly reflect these factors, however, and there are normal random variations in the extent to which these major factors directly lead to social web mentions and altmetric scores. Similarly, citation counts may be influenced by biases that are irrelevant to altmetrics, such as (hypothetically) the field in which the article is published and whether it is a review article. These citation biases include the possibility that applied research and articles with value outside of science are less cited than their research value would indicate. In this case, any correlation between altmetric scores and citation counts for a specific data set can be expected to be not significantly different from zero. Now assume that the arrows between citation counts and altmetric scores are included but that the research quality and common biases variables are still removed. In this setting, altmetric scores partially cause citation counts (e.g., authors find out about articles from Twitter and later cite them) and the citation counts partially cause altmetric scores (e.g., readers tweet about an article after finding it from a citation in a new paper). In this case, a significant positive correlation should be expected between altmetric scores and citation counts. The strength of the correlation would depend on the relative strengths of the random variations, the unique biases and the strengths of the connections between altmetric scores and citation counts. Most worryingly, in this context, there is no research quality influence on either citation counts or altmetric scores but a significant positive correlation can still be expected between them. More realistically, however, research quality might be a cause of citation counts but not of altmetric scores and this changes the situation because the feedback from citation counts to altmetric scores is now partly determined by research quality. Hence, in this case to prove that altmetric scores partly reflect research quality, it would need to be shown that they are partly influenced by citations, but this seems to be the weakest connection in the diagram because social web mentions are normally much faster to appear than academic citations. Finally, suppose that the complete diagram in Figure 1 is true. Then the correlation between altmetric scores and citation counts will reflect research quality, common biases, the feedback between altmetric scores and citation counts, and the relative strengths of these with the unique biases and random variations for both citation counts and altmetric scores. Crucially, the strength of the correlation between altmetric scores and citation counts could, in theory, be just as related to factors irrelevant to research quality (e.g., whether the article is a review, its language or the gender or nationality of its authors) than to research quality. The most important lessons from the diagram are thus that finding a significant correlation is not enough to show that altmetrics point to good quality articles. To help show that altmetrics predominantly reflect research quality, it is also important to attempt to show that (a) common biases have a relatively small influence in comparison to research quality, and (b) that there is a connection between research quality and altmetric scores. For (a) interviews and questionnaires may help to identify the factors that cause people to both cite articles and mention them on the social web, and for (b), interviews and
questionnaires may help to determine that research quality is at least one of the reasons why articles are discussed on the social web. In addition to the above, any research that demonstrates that the desired connection (research quality to altmetrics) exists or is relatively strong will support the value of altmetrics, as will any evidence that the common biases and the altmetric biases are both weak. Note also that strengths of the connections are affected by scale in the sense of the number of documents investigated. Most obviously, the strength of the random factors will become relatively weaker for larger collections of articles, but the strength of the other connections may also change. This can occur for field-specific biases that average out (or get introduced) in large multiple-field collections of articles in comparison to small single-field collections. The validity of altmetrics is not an absolute: they may be valid in some contexts but not in others. This is also true for citations and an important case in point is that the use of citations to compare between fields with differing citation patterns (e.g., medicine and sociology) is not valid – in such cases the common biases would outweigh the common research quality factors. Hence, an important aspect of the evaluation of altmetrics is to identify contexts in which it is reasonable to use them.
The sign test A problem with correlation tests for altmetrics is that the use of the social web is rapidly increasing and so recent articles are likely to have more mentions in the social web, on average, than older articles whereas older articles are likely to have more citations than newer ones and so there is a bias towards negative correlations between altmetrics and citation counts. The standard method to minimise time biases in scientometrics is to use a short citation window (e.g., one year) for a significant period in the past (e.g., at least 3-5 years ago) to minimise the effect of the time differences (Levitt & Thelwall, 2011). The use of such a citation window is a disadvantage for altmetrics because social web use is increasing quickly and there can be a substantial increase in the use of a social web service even within a single year. In response to this issue, a new test has been developed, the sign test (Thelwall, Haustein, Larivière, & Sugimoto, 2013). The sign test is a simple method to avoid biases caused by time differences. Suppose that three articles are published consecutively and that after a period of time they have attracted C1, C2 and C3 citations and A1, A2 and A3 scores on a particular altmetric. The sign test assesses whether a prediction of the difference in citations for the middle article compared to the others would be successful, based upon any difference in altmetric score for the middle article compared to the altmetric scores of the others. The test has three possible outcomes. • Success: A2 > (A1+A3)/2 and C2 > (C1+C3)/2 • Success: A2 < (A1+A3)/2 and C2 < (C1+C3)/2 • Fail: A2 > (A1+A3)/2 and C2 < (C1+C3)/2 • Fail: A2 < (A1+A3)/2 and C2 > (C1+C3)/2 • Null: All other cases. In other words A2 must be different from the average of A1 and A3 to get a result other than null. If A2 is larger than the average of A1 and A3, then the altmetric predicts that the citations, C2 for the middle article should also be larger than the average citations for the other two articles, (C1+C3)/2. If this is true, the test is a success. If it is false then the test is a fail, unless the scores are equal, in which case the result is null. The logic reverses if A2 is
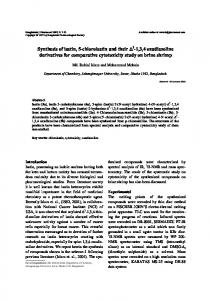
smaller than the average of A1 and A3. The sign test is to compare the number of successes with the number of failures for this test over a large number of articles. If the number of successes is significantly higher than the number of failures then this gives evidence that if time was eliminated then citation counts and altmetric scores would correlate. The limitations of the sign test include all the limitations of the correlation test except for time bias and include an extra limitation that the size of the sign test proportion is not a reliable indicator of the strength of any underlying relationship. Hence, in statistical terms the sign test cannot be used for evidence of the effect size (in terms of the correlation magnitude) of the prediction. The sign test can, in theory, be modified to make predictions based upon additional adjacent articles in the following logical way, where n > 1 can be any whole number. Using a larger n makes the test more stable due to the greater degree of averaging, but reduces the total number of articles that can be tested. �� • Success: �� � �∑� �� �� /2� and �� � �∑�� � �� �� /2�. • • • •
� � � � �� �� Success: �� � �∑� �� �� /2� and �� � �∑� �� �� /2�. � � � � �� �� Fail: �� � �∑� �� �� /2� and �� � �∑� �� �� /2�. � � � � �� �� Fail: �� � �∑� �� �� /2� and �� � �∑� �� �� /2�. � � � �
Null: All other cases.
Creator motivation interviews or questionnaires Perhaps the most direct way to assess whether a metric is related to research value would be to interview a sample of the creators of the raw data (e.g., the tweeters for the tweet count altmetric) to find out why they created the data (e.g., a tweet) and if this reason was at least partially dependent upon research quality. For example, if all tweeters interviewed claimed only to tweet links to articles that they considered to be useful for research then it would be reasonable to claim tweet link counts as research value indicators. In contrast, if many tweeters reported a common different motivation, such as tweeting articles with funny titles or with research that the general public could understand than this would point to tweet counts not being useful research quality indicators. In practice it is likely that a range of motivations would be elicited by interviews (Priem & Costello, 2010) and so in order for a metric to be useful then the dominant reason(s) should be research use or quality and the other reasons should not introduce systematic sources of bias (i.e., common biases), unless they are too rare to be significant. Creator motivation interviews have featured in few studies for three reasons: they are time consuming to conduct; they can only include a small proportion of relevant authors; and authors may not be reliable because they have forgotten, do not understand or mask the reasons why they created the data (Brooks, 1986; Case & Higgins, 2000). Nevertheless, such interviews may give insights that are known only to the creators of the data and hence would not be evident from other methods. For example, interviews with tweeting academics revealed that some tweeted on the basis of reading blogs discussing articles rather than the articles themselves (Priem & Costello, 2010). Similarly, questionnaires and interviews with UK PhD students and academics found that adoption of social web services was "fragmented" and that conference organisers could encourage uptake within a research community (Procter, Williams, Stewart, et al., 2010). The scope for
future qualitative research seems limitless because of the range of social web services available and likely differences in uptake and styles of use between researchers based upon countries, disciplines, fields and ages. What would be particularly useful in this regard, therefore, would be theories that would help to generalise patterns of use so that the inevitable large gaps in knowledge (e.g., for unexamined countries or disciplines) would not cause problems.
User motivation interviews or questionnaires In addition to finding out why people cite in the social web, it is also important to understand which people use the social web to access citations. More generally, it would also be useful to know who uses the social web for scholarly purposes and which parts they use (Weller, Dornstädter, Freimanis, Klein, & Perez, 2010). This can be investigated using interviews and questionnaires, with the same considerations as above.
Source Content Analysis A practical alternative to author interviews or questionnaires is to conduct a content analysis of a random sample of raw data (social web posts with citations) to categorise its context or the apparent citation motivations (Priem & Costello, 2010). This has the advantages that it is non-intrusive, can probably be conducted on a larger scale than interviews or questionnaires, and does not rely upon author memories. Its disadvantages are that insufficient context may be available for a reliable classification in some or all cases, coders may be fooled by clever spam, and it is labour-intensive to do well. The amount of context and hence the usefulness of this approach varies by data source. For example, tweets may be too short for it to work well but blog posts should typically give enough context for reliable coding. Any context analysis should follow standard guidelines: using careful descriptions and multiple coders and reporting inter-coder reliability (Neuendorf, 2002). Content analyses for metrics have been rarely used but deserve to be more common because in addition to giving evidence about why the raw data was created, which can help to validate metrics as research indicators, they can improve wider understanding of the meaning of the metrics though revealing their typical use contexts. As for interviews, in order for a content analysis to provide evidence of research value in the associated indicator, the dominant (not necessarily the majority) category should be research related and the remainder should not introduce systematic sources of bias, unless they are much smaller. These provisos may be a reason why these approaches are not widely used: unless research reasons are in an overwhelming majority, a qualitative argument must be made for the remaining categories not introducing systematic bias.
Pragmatic Evaluations A final type of evaluation is pragmatic (Helic, Strohmaier, Trattner, Muhr, & Lerman, 2011): evaluating altmetrics within the context of the system using them or in terms of their use to help a specific research assessment. For a publisher web site the evaluation could follow any of the methods used to test information retrieval systems. For example, users could be given information seeking tasks, with the time taken to complete them and the satisfaction with the system measured, comparing users of the system with and without the altmetrics. This would require setting up experiments and would be somewhat artificial. A more natural test might be to introduce the metrics into the system and then obtain feedback from users
about whether they liked and used them. A positive outcome of such a study would have the limitation that users might like the altmetrics because they pointed to fun irrelevant articles and so the users should be explicitly asked about whether the altmetrics help them to meet their primary goals for using the system. The results would still be subjective, however, and the best that could be hoped for would be discovering that users believed that the altmetrics pointed them to important or useful articles. In research assessments a pragmatic evaluation would involve discovering the opinions of some or all of the participants about their perceptions of the usefulness of the altmetrics involved. Depending upon the scale of the evaluations, this could take the form of interviews or questionnaires.
Summary and recommendations With the increasing uptake of altmetrics there is a need to evaluate them so that publishers can choose which to use within their online systems and evaluators should take notice of them when making funding, appointment or promotion decisions. The methods described in this article (correlation and sign tests, creator interviews or questionnaires, source content analysis and pragmatic evaluations) can all give evidence about the value or meaning of altmetrics. Whilst all of the methods have limitations, these can be at least partially overcome by using multiple different types (method triangulation). The following strategy is recommended for altmetric evaluations of a specific new source (e.g., twitter citations), based upon the above discussion. 1. Correlations and sign tests with citation data are a logical first step because they are relatively straightforward to collect sufficient data for, including from the Web of Science, Scopus and Google Scholar, because they have the transparency of simple quantitative tests, and because citation counts are a relatively well understood impact measure. Hence a first stage for altmetric evaluation should be citation correlation tests for a range of different scientific fields to identify where they are likely to work. In successful areas the other methods should then be applied. Correlation tests should also help to identify contexts in which it seems reasonable to apply altmetrics. For example, it is likely that it will not be valid to compare them across different fields since this would introduce biases that are stronger than any connection to research quality. 2. Content analysis of selected sources of altmetric citations is a logical second step because of the greater journal coverage that is possible in comparison to interviews. This and interviews are also necessary to help identify types of impacts reflected by altmetrics, especially those not reflected by traditional citations (e.g., societal and educational impacts). 3. Interviews, because they are time consuming, are most efficiently used for particularly important or interesting cases, such as prolific or influential social web content producers, important fields or key journals. Creator motivation interviews should be prioritised over user interviews because creation motivations are likely to have a more direct influence on the validity of altmetrics. 4. Pragmatic evaluations a. Pragmatic evaluations for information retrieval systems seem to be the most difficult for academics to set up but are essential as a final step if altmetrics are to be used in this context.
b. If altmetrics are used in research evaluations then pragmatic assessments from this source should be a parallel final step.
Acknowledgement This study is part of the FP7 EU-funded project ACUMEN on assessing Web indicators in research evaluation.
References Bar-Ilan, J., Haustein, S., Peters, I., Priem, J., Shema, H., & Terliesner, J. (2012). Beyond citations: Scholars' visibility on the social Web, 17th International Conference on Science and Technology Indicators (STI2012), Science-Metrix and OST, Montreal (pp. 98-109). Blackburn, J. L., & Hakel, M. D. (2006). An examination of sources of peer-review bias. Psychological Science, 17(5), 378-382. doi: 10.1111/j.1467-9280.2006.01715.x Bornmann, L., Nast, I., & Daniel, H. -D. (2008). Do editors and referees look for signs of scientific misconduct when reviewing manuscripts? A quantitative content analysis of studies that examined review criteria and reasons for accepting and rejecting manuscripts for publication. Scientometrics, 77(3), 415-432. Brooks, T. A. (1986). Evidence of complex citer motivations. Journal of the American Society for Information Science, 37, 34-36. Case, D. O., & Higgins, G. M. (2000). How can we investigate citation behaviour? A study of reasons for citing literature in communication. Journal of the American Society for Information Science, 51(7), 635-645. Ceci, S. J., & Williams, W. M. (2011). Understanding current causes of women’s underrepresentation in science. Proceedings of the National Academy of Sciences of the United States of America, 108(8), 3157-3162. Desai, T., Shariff, A., Shariff, A., Kats, M., Fang, X., et al. (2012). Tweeting the meeting: An indepth analysis of Twitter activity at Kidney Week 2011. PLoS ONE 7(7), e40253. doi:10.1371/journal.pone.0040253 Helic, H., Strohmaier, M., Trattner, C., Muhr, M., & Lerman, K. (2011). Pragmatic evaluation of folksonomies. Proceedings of the 20th international conference on world wide web (WWW2011) (pp. 417-426). New York, NY: ACM. Horrobin, D. F. (1990). The philosophical basis of peer review and the suppression of innovation. Journal of the American Medical Association, 263(10), 1438-1441. Kousha, K., & Thelwall, M. (2007). Google scholar citations and Google Web/URL citations: A multi-discipline exploratory analysis. Journal of the American Society for Information Science and Technology, 58(7), 1055-1065. Kousha, K., & Thelwall, M. (2008). Assessing the impact of disciplinary research on teaching: An automatic analysis of online syllabuses. Journal of the American Society for Information Science and Technology, 59(13), 2060-2069. Kousha, K., & Thelwall, M. (2009). Google book search: Citation analysis for social science and the humanities. Journal of the American Society for Information Science and Technology, 60(8), 1537-1549. Kousha, K., Thelwall, M., & Rezaie, S. (2010). Using the web for research evaluation: The integrated online impact indicator. Journal of Informetrics, 4(1), 124-135. Lee, C., Sugimoto, C. R., & Zhang, G. (2013). Bias in peer review. Journal of American Society for Information Science and Technology, 64(1), 2-17.
Levitt, J., & Thelwall, M. (2011). A combined bibliometric indicator to predict article impact. Information Processing & Management, 47(2), 300-3008. Li, X., Thelwall, M., & Giustini, D. (2012). Validating online reference managers for scholarly impact measurement, Scientometrics, 91(2), 461-471. MacRoberts, M. H., & MacRoberts, B. R. (1996). Problems of citation analysis. Scientometrics, 36(3), 435-444. Mohammadi, E. & Thelwall, M. (in press). Assessing non-standard article impact using F1000 labels. Scientometrics. Mahoney, M. J. (1977). Publication prejudices: An experimental study of confirmatory bias in the peer review system. Cognitive Therapy and Research, 1(2), 161-175. Marcus, A., & Oransky, I. (2011). Science publishing: The paper is not sacred. Nature, 480, 449-450. Merton, R. K. (1973). The sociology of science. theoretical and empirical investigations. Chicago: University of Chicago Press. Moed, H. F. (2005). Citation analysis in research evaluation. New York: Springer. Neuendorf, K. (2002). The content analysis guidebook. London: Sage. Oppenheim, C. (2000). Do patent citations count? In B. Cronin, & H. B. Atkins (Eds.), The web of knowledge: A festschrift in honor of Eugene Garfield (pp. 405-432). Metford, NJ: Information Today Inc. ASIS Monograph Series. Peters, D. P., & Cecia, S. J. (1982). Peer-review practices of psychological journals: The fate of published articles, submitted again. Behavioral and Brain Sciences, 5, 187-195. Priem, J., Taraborelli, D., Groth, P., & Neylon, C. (2011). Altmetrics: a manifesto. Available: http://altmetrics.org/manifesto/ Priem, J., Piwowar, H.A. & Hemminger, B.M. (2012). Altmetrics in the wild: using social media to explore scholarly impact. Available: http://arxiv.org/abs/1203.4745v1 Priem, J., & Costello, K. L. (2010). How and why scholars cite on twitter. Proceedings of the American society for information science and technology (ASIST 2010) (pp. 1-4) doi: 10.1002/meet.14504701201 Procter, R., Williams, R., Stewart, J., Poschen, M., Snee, H., Voss, A., & Asgari-Targhi, M. (2010). Adoption and use of Web 2.0 in scholarly communications. Philosophical Transactions of the Royal Society A, 368 (1926), 4039-4056. Seglen, P. O. (1998). Citation rates and journal impact factors are not suitable for evaluation of research. ACTA Orthopaedica Scandinavica, 69(3), 224-229. Shema, H., Bar-Ilan, J., & Thelwall, M. (2012). Research blogs and the discussion of scholarly information. PLOS ONE, 7(5), e35869. doi: 10.1371/journal.pone.0035869 Thelwall, M., Haustein, S., Larivière, V., & Sugimoto, C. R. (2013). Do altmetrics work? Twitter and ten other social web services, PLOS ONE, 8(5), e64841. doi:10.1371/journal.pone.0064841 Thelwall, M., & Kousha, K. (2008). Online presentations as a source of scientific impact?: An analysis of PowerPoint files citing academic journals. Journal of the American Society for Information Science and Technology, 59(5), 805-815. van Raan, A.F.J. (1998). In matters of quantitative studies of science the fault of theorists is offering too little and asking too much. Scientometrics, 43(1), 129-148. Vaughan, L. & Huysen, K. (2002). Relationship between links to journal Web sites and impact factors, ASLIB Proceedings 54(6), 356-361.
Vaughan, L., & Shaw, D. (2003). Bibliographic and web citations: What is the difference? Journal of the American Society for Information Science and Technology, 54(14), 13131322. Vaughan, L., & Shaw, D. (2005). Web citation data for impact assessment: A comparison of four science disciplines. Journal of the American Society for Information Science & Technology, 56(10), 1075-1087. Weller, K., Dornstädter, R., Freimanis, R., Klein, R. N., & Perez, M. (2010). Social software in academia: Three studies on users’ acceptance of web 2.0 services. Proceedings of the 2nd Web Science Conference (WebSci10), Retrieved May 29, 2013 from: http://www.phil-fak.uniduesseldorf.de/fileadmin/Redaktion/Institute/Informationswissenschaft/weller/websci 10_submission_62.pdf Wennerås, C., & Wold, A. (1997). Nepotism and sexism in peer-review. Nature, 387, 341343. Whitley, R. (2000). The intellectual and social organization of the sciences (2nd ed.). Oxford: Oxford University Press.