INSTITUTE OF PHYSICS PUBLISHING Phys. Med. Biol. 51 (2006) 845–854
PHYSICS IN MEDICINE AND BIOLOGY
doi:10.1088/0031-9155/51/4/006
Evaluating microcirculation by pulsatile laser Doppler signal P T Chao1,2,3, M Y Jan3, H Hsiu3,4, T L Hsu3, W K Wang1,3 and Y Y Lin Wang2,3 1 Department of Electrical Engineering, National Taiwan University, Taipei, Taiwan, Republic of China 2 Department of Physics, National Taiwan Normal University, Taipei, Taiwan, Republic of China 3 Biophysics Lab, Institute of Physics, Academia Sinica, Nankang, Taipei, Taiwan, Republic of China 4 Department of Electrical Engineering, Yuan-ze University, Chun-Li, Taiwan, Republic of China
E-mail:
[email protected]
Received 6 October 2005, in final form 21 November 2005 Published 25 January 2006 Online at stacks.iop.org/PMB/51/845 Abstract Laser Doppler flowmetry (LDF) is a popular method for monitoring the microcirculation, but it does not provide absolute measurements. Instead, the mean flux response or energy distribution in the frequency domain is generally compared before and after stimulus. Using the heartbeat as a trigger, we investigated whether the relation between pressure and flux can be used to discriminate different microcirculatory conditions. We propose the following three pulsatile indices for evaluating the microcirculation condition from the normalized pressure and flux segment with a synchronized-averaging method: peak delay time (PDT), pressure rise time and flux rise time (FRT). The abdominal aortic blood pressure and renal cortex flux (RCF) signals were measured in spontaneously hypertensive rats (SHR) and Wistar Kyoto rats (WKY). The mean value of the RCF did not differ between SHR and WKY. However, the PDT was longer in SHR (87.14 ± 5.54 ms, mean ± SD) than in WKY (76.92 ± 2.62 ms; p < 0.001). The FRT was also longer in SHR (66.56 ± 1.98 ms) than in WKY (58.02 ± 1.77 ms; p < 0.001). We propose that a new dimension for comparing the LDF signals, which the results from the present study show, can be used to discriminate RCF signals that cannot be discriminated using traditional methods. (Some figures in this article are in colour only in the electronic version)
0031-9155/06/040845+10$30.00 © 2006 IOP Publishing Ltd Printed in the UK
845
846
P T Chao et al
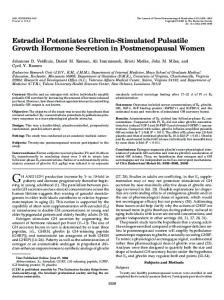
1. Introduction Laser Doppler flowmetry (LDF) is a popular method for monitoring the microcirculation. It has clinical advantages such as being noninvasive and having a rapid response, but its main drawback of providing only a relative quantitative measurement index restricts its usefulness (Shepherd and Oberg 1990). Studies have observed dc flux responses before and after stimulus in the time domain (Farkas et al 2004, Stewart et al 2004), which reflect the physiological effects of hormone or sympathetic nerve action; and have compared the power spectrum distribution in the frequency domain (Soderstrom et al 2003, Urbancic-Rovan et al 2004), which takes longer measurement time and hence the subject might produce motion artefacts. A rapid, non-intervention method for evaluating different microcirculatory conditions is necessary. In this study, we developed a new pulsatile-based signal processing method for LDF signals that does not require external interventions and requires only brief measurements. The time lag between pressure and LDF signals is calculated by using the pressure pulse as a self-trigger. We have previously demonstrated that blood pressure and microcirculation flux fluctuations are coherent, with the phase difference between these quantities being restricted to a small range (Jan et al 2000). Seki made similar observations in distal arterioles (Seki et al 2004). We hypothesized that the time lag between the blood pressure and the peripheral perfusion could reveal physiological properties of the flux driving process and the underlying anatomical condition. In this study, we measured the abdominal aortic blood pressure (AABP) and renal cortex flux (RCF) signals in spontaneously hypertensive rats (SHR) and Wistar Kyoto rats (WKY). Mature SHR (with renal hypertension) have significantly smaller afferent arteriole diameters (Skov and Mulvany 2004, Yamamoto et al 2001) and a structurally based increase in the glomerular resistance (Iversen et al 1998, Anderson et al 2000, Ketta et al 2001). Parameters calculated using the pulsatile-based method in WKY and SHR were compared to determine if they could be used to differentiate the renal microvascular structures. 2. Materials and methods 2.1. Animal preparation and experimental setup The investigation conforms with the Guide for the Care and Use of Laboratory Animals published by the US National Institutes of Health. The experimental animals were housed in our animal care facility with a 12 h light/dark cycle, and were fed water ad libitum and food (Labdiet 5001 rodent diet, PMI Nutrition International, Brentwood, MO, USA) prior to the experiment. WKY were obtained from the experimental animal centre of National Taiwan University, Taipei, Taiwan, and SHR were obtained from the experimental animal centre of Tzu-chi University, Hualien, Taiwan. Figure 1 illustrates the experimental setup. Five male WKY and five male SHR were anaesthetized with urethane (300 mg kg−1 for WKY, 180 mg kg−1 for SHR, i.p.), and then placed on a heated pad to maintain the body temperature. A polythene tube (PE 10, BectonDickinson, USA) was inserted from the iliac artery into the abdominal aorta of each rat with a catheter-tip pressure transducer (P10EZ, Viggo-Spectramed, USA) to measure AABP. LDF (MBF3, Moor Instruments, UK) was used for the RCF measurement with a time constant of 0.02 s and a cut-off frequency of 14.9 kHz. RBC in capillary is usually moving with speed lower than 7 mm s−1, so we selected 14.9 kHz as ‘upper cut-off Doppler shift frequency’ to fit the speed. The laser operating wavelength is 780 nm and the output power is less than 1.6 mW.
Pulsatile-based method for evaluating microcirculation
847
optic fibre
PC
P10EZ Pressure transducer
Figure 1. Experimental setup.
The left kidney was exposed from the dorsal side and immobilized with sterilized gauze sponges. The fatty capsule was separated carefully so as to avoid bleeding, and the surface of the kidney was infused with normal saline at 37 ◦ C to stop it drying during the experiments. An LDF optical fibre probe (P10M+P17, plastic fibre with 500 µm o.d., Moor Instruments) was gently touched perpendicularly against the surface of the renal cortex to acquire the RCF signal. Recording did not begin until at least 30 min after all surgical procedures had been completed. We attempted to utilize the characteristic of the reduced renal arteriole diameters in mature SHR with elevated blood pressure (Skov and Mulvany 2004, Yamamoto et al 2001), with the aim of reducing the need for direct observations of microvascular structure. 2.2. Data acquisition Both AABP and RCF signals were recorded and sampled simultaneously and synchronously. Both signals were connected to a simultaneous sample-and-hold card (AX753, AXIOM Technology, Taiwan) and then to an A/D converter card (AX5621, AXIOM Technology) at a higher than usual sampling rate of 500 Hz to get enough information for the profile of each pulse. We performed at least three 10 min measurements on each rat, with a 30 min interval between each measurement period. 2.3. Signal processing of pulsatile component Data files with obvious motion artefacts were discarded. Each 10 min data set was separated into ten 1 min data sequence sets to process the pulsatile component. The mean, standard deviation (SD) and coefficient of variation (CV; SD/mean) of the heart rate and blood pressure in each 1 min sequence were calculated. In order to be sure that rats were physiologically stable, chosen data sequences had to satisfy the following criteria: (1) heart rate CV of less than 3%, (2) CV of diastolic pressure of less than 3% and (3) criteria for the maturity of rats: diastolic pressure higher than 60 mmHg for WKY and 90 mmHg for SHR. Unlike traditional LDF signal processing in which a low-pass filter is used to eliminate the pulsatile component, we use anti-noise time domain synchronized averaging (Rangrraj 2002) to enhance the pulsatile component of the RCF (Jan et al 2000). This method is applied extensively to event-related potential measurements obtained by repeated application of a
848
P T Chao et al
(a)
Figure 2. (a) Flowchart of pulsatile signal processing. (b) Step 1: 1 min blood pressure (upper line) and RCF (lower line) signals. (c) Step 2: 2 s blood pressure (upper line) and RCF (lower line) signals, showing that RCF is roughly pulsatile and apparently coherent with the blood pressure. It is a short section of (b) that shows the detailed cutting process. (d) Steps 3 and 4: normalized pressure pulse and flux pulse profiles, in which 356 pulses were averaged into one averaged pulse. It can be seen that the RCF is coherent with blood pressure after synchronized averaging. The local maximum and minimum points were figured out. (e) Step 5: normalized pressure pulse and flux pulse profiles, indicating the three pulsatile time indices.
stimulus to increase the signal-to-noise ratio (Leppert et al 2003). Here we treated the blood pressure wave as the stimulus signal and the RCF as the evoked signal. Figures 2(a)–(e) illustrate the process of deciding pulse timing. Each 1 min data sequence was signal-processed, and we used the blood pressure waveform to determine each pulse. We cut the pressure wave and identified the cardiac component according to the neighbouring two lowest points. And then we cut the flux wave at the same cut point. The cut segments of these signals were synchronously averaged into one averaged segment. The pulsatile component (defined as the averaged pulse minus its diastolic value) of both AABP and RCF signals were acquired and then normalized to the same scale. AABP and RCF local maximum and minimum positions were found and three pulsatile time indices were calculated.
Pulsatile-based method for evaluating microcirculation
849
(b)
(c)
Figure 2. (Continued.)
We used the following three indices to evaluate the flux condition on the normalized pressure and flux segment. • • • •
Peak delay time (PDT). Time difference between the pressure and flux peaks. Pressure rise time (PRT). Time difference between the lowest and highest pressures. Flux rise time (FRT). Time difference between the lowest and highest fluxes. All signal processing was performed with MATLAB (IBM PC version, MathWorks, Natick, MA).
2.4. Statistical analyses Each measurement produced ten 1 min data sets of PDT, PRT and FRT values, for which the mean, SD and CV values were calculated. Student’s t-test was used to compare the
850
P T Chao et al (d)
Time (s) (e)
Time (s)
Figure 2. (Continued.)
three parameters between SHR and WKY, with differences considered as significant when p < 0.001. 3. Results The basic physiological parameters of body weight, heart rate, blood pressure and mean RCF of both experimental animal groups are listed in table 1. The mean RCF did not differ significantly between SHR and WKY.
Pulsatile-based method for evaluating microcirculation
851
100 90 80 Time (ms)
70 60 50
WKY SHR
40 30 20 10 0
PRT
PDT
FRT
Figure 3. Mean and SD values of our three indices for SHR and WKY, showing that the PRT is similar ( p = 0.12) between the two groups. However, the PDT and FRT are significantly longer in SHR than in WKY ( p < 0.001).
Table 1. Basic physiological parameters of the two animal models.
WKY (n = 5) SHR (n = 5)
Body weight (g)
Heart rate (beats s–1)
Blood pressure (mmHg)
RCF (au)
297.00 ± 31.14 386.00 ± 23.02
6.69 ± 0.25 5.55 ± 0.22
78.45 ± 8.58 130.96 ± 17.05
1020.41 ± 447.28 1045.18 ± 177.53
The mean and SD values of our three time parameters for both animal models are shown in figure 3. The PRT is similar between the two groups (SHR: 28.46 ± 3.11 ms, mean ± SD; WKY: 25.83 ± 2.19 ms; p = 0.12). The PDT was longer in SHR (87.14 ± 5.54 ms) than in WKY (76.92 ± 2.62 ms; p < 0.001). The FRT was also longer in SHR (66.56 ± 1.98 ms) than in WKY (58.02 ± 1.77 ms; p < 0.001). Each animal group contained 5 rats and 12 selected measurements that satisfied our designated criteria. The mean CV of the PDT and FRT for all 10 min measurements were 2.40% and 3.29% for SHR, and 2.13% and 3.13% for WKY, respectively.
4. Discussion 4.1. Possible interpretation of the changes in PDT and FRT Table 1 and figure 3 indicate that the two strains of rats cannot be distinguished using the traditional method for evaluating microcirculation. In contrast, FRT and PDT reveal clear differences between the two animal groups. FRT refers to the time taken for the RCF from the lowest point to the highest point in a cardiac cycle. A longer FRT indicates a delayed peak in the RCF, which may be attributable to a slower erythrocyte velocity. Although the mean arterial pressure is higher in SHR, the superficial glomerular pressures of SHR and WKY are similar (Iversen et al 1998). Under a similar driving force, a slower blood flow should be associated with a higher resistance, and this is consistent with the renal phenotype of SHR (Iversen et al 1998, Anderson et al 2000, Ketta et al 2001).
852
P T Chao et al
PDT refers to the time difference between the pressure and flux peak, and equals the time that a pressure change is transmitted from the main artery to renal arterioles (T1) plus the time for blood to move into the measured capillaries (T2). SHR exhibit a higher wave velocity (Marque et al 1999), so T1 and PDT should be shorter. In contrast, our data showed that PDT is significant longer, which indicates that T2 of SHR must be longer. A longer T2 means that distal pressure-flow transmission is slower, which could be attributed to an obstructed structure and higher resistance (Iversen et al 1998, Anderson et al 2000, Ketta et al 2001). A similar idea about the FRT and PDT has been used extensively in photoplethysmography (PPG) measurements. Erts et al (2005) and Allen et al (2005) both considered the pulse transmit time and the rise time of PPG, and concluded that the simple-to-calculate timing difference provided good diagnostic accuracy. 4.2. Advantages of pulsatile-based analysis Most LDF studies have focused merely on the dynamic response to an outside stimulus such as post-occlusive reactive hyperaemia and thermal hyperaemia (Farkas et al 2004, Stewart et al 2004). Instead, we have used the heartbeat as the stimulus, which does not require an external trigger. This provides a tool for more detailed investigations of local tissue properties in normal physiological states. Owing to scattering of the LDF signal, we applied a synchronized-averaging method to enhance the signal-to-noise ratio. The processed RCF signal showed the information of flow patterns under pulsatile pressure. The pulsatile (ac) component of a periodic signal elucidates specific characteristics of a physiological system. For example, O’Rourke (2003) and O’Rourke et al (2004) show that the shape of the pressure pulse reveals the stiffness of the arterial system. In this study, we utilize the ac part of both AABP and RCF signals to distinguish differences in microcirculation conditions. The small variance found in our 10 min measurements indicates that the measurement time can be reduced to 1 min or less using the pulsatile-based method. 4.3. Potential effects of physiological factors 4.3.1. Heart rate. The heart rate differed between our two experimental groups, but the PRT was similar (figure 3). The FRT and PDT only describe the timing of the rising (systolic) part of the AABP and RCF pulse. The pressure pulse being the stimulus and the PRT being similar infers that the RCF pulse is driven under a similar-timing pressure pulse. Therefore, different heart rates will not affect the results from our method. 4.3.2. Pulse amplitude. This method compared the delay and rising time between LD and pressure pulse, and pulse amplitude is important to this method. Pressure pulse is usually large and easy to measure. LD pulse can be small in some situations. An appropriate signal processing technique, such as averaging more waves, is needed for extracting the pulse signal. A pulsatile phenomenon is generally found in microcirculation researches (Zweifach 1973), so this method could also be applied. 4.3.3. RBC volume and blood oxygen level. LD flux is the product of the RBC volume and RBC moving speed. If the RBC volume and oxygen level change in a short time, it does affect the LD flux profile due to complex autoregulation of blood supplies. Our pulsatile indices could also be affected. In this report, HR and AABP CV were taken as the index of
Pulsatile-based method for evaluating microcirculation
853
physiological stability. Both indices would be influenced if the blood oxygen level and RBC volume dramatically changed. The blood oxygen level and RBC volume in the arterial systems between SHR and WKY do not differ a lot. We did not assess these two parameters in the experiment. However, no significant change of HR and AABP during the experiment was found. Both changes of RBC volume and oxygen level should be small and there should also be few potential errors from these two factors. 4.4. Application By replacing the delicate microscopy surgery required to place measurement devices on tiny arterioles, our new method maximizes the benefits of LDF such as easy installation, rapid response and reduced effort. The results from the present study show that the proposed method may distinguish different microcirculatory conditions, and it made it possible for direct clinical use such as evaluating the fingers (extremity) of diabetics, burned skin, and transplanted skin or organs.
Acknowledgment The authors thank the National Science Council of Taiwan for partially supporting this work.
References Allen J, Oates C P, Lees T A and Murray A 2005 Photoplethysmography detection of lower limb peripheral arterial occlusive disease: a comparison of pulse timing, amplitude and shape characteristics Physiol. Meas. 26 811–21 Anderson W P, Kett M M, Stevenson K M, Edgley A J, Denton K M and Fitzgerald S M 2000 Renovascular hypertension: structural changes in the renal vasculature Hypertension 36 648–52 Erts R, Spigulis J, Kukulis I and Ozols M 2005 Bilateral photoplethysmography studies of the leg arterial stenosis Physiol. Meas. 26 865–74 Farkas K, Kolossvary E, Jarai Z, Nemcsik J and Farsang C 2004 Non-invasive assessment of microvascular endothelial function by laser Doppler flowmetry in patients with essential hypertension Atherosclerosis 173 97–102 Iversen B M, Amann K, Kvam F I, Wang X and Ofstad J 1998 Increased glomerular capillary pressure and size mediate glomerulosclerosis in SHR juxtamedullary cortex Am. J. Physiol. (Pt 2) 274 F365–73 Jan M Y, Hsiu H, Hsu T L, Wang Lin Y Y and Wang W K 2000 The importance of the pulsatile microcirculation in relation to hypertension IEEE Eng. Med. Biol. 19 106–11 Ketta M M, Bergstromb G, Alcornc D, John F Bertramd and Warwick P Andersona 2001 Renal vascular resistance properties and glomerular protection in early established SHR hypertension J. Hypertension 19 1505–12 Leppert D, Goodin D S and Aminoff M J 2003 Stimulus recognition and its relationship to the cerebral event-related potential Neurology 61 1533–7 Marque V, Kieffer P, Atkinson J and Lartaud-Idjouadiene I 1999 Elastic properties and composition of the aortic wall in old spontaneously hypertensive rats Hypertension 34 415–22 O’Rourke M F 2003 Arterial pressure waveforms in hypertension Minerva Med. 94 229–50 O’Rourke M F, Nichols W W and Safar M E 2004 Pulse waveform analysis and arterial stiffness: realism can replace evangelism and scepticism J. Hypertension 22 1633–4 Rangrraj M R 2002 Biomedical Signal Processing: A Case-Study Approach (New York: Wiley) Seki J, Satomura Y and Ooi Y 2004 Velocity pulse advances pressure pulse by close to 45 degrees in the rat pial arterioles Biorheology 41 45–52 Shepherd A P and Oberg P A 1990 Laser-Doppler Blood Flowmetry (Norwell, MA: Kluwer) Skov K and Mulvany M J 2004 Structure of renal afferent arterioles in the pathogenesis of hypertension Acta Physiol. Scand. 181 397–405 Soderstrom T, Stefanovska A, Veber M and Svensson H 2003 Involvement of sympathetic nerve activity in skin blood flow oscillations in humans Am. J. Physiol. Heart Circ. Physiol. 284 H1638–46
854
P T Chao et al
Stewart J, Kohen A, Brouder D, Rahim F, Adler S, Garrick R and Goligorsky M S 2004 Noninvasive interrogation of microvasculature for signs of endothelial dysfunction in patients with chronic renal failure Am. J. Physiol. Heart Circ. Physiol. 287 H2687–96 Urbancic-Rovan V, Stefanovska A, Bernjak A, Azman-Juvan K and Kocijancic A 2004 Skin blood flow in the upper and lower extremities of diabetic patients with and without autonomic neuropathy J. Vasc. Res. 41 535–45 Yamamoto T, Tomura Y, Tanaka H and Kajiya F 2001 In vivo visualization of characteristics of renal microcirculation in hypertensive and diabetic rats Am. J. Physiol. Renal Physiol. 281 F571–7 Zweifach B W 1973 Microcirculation Annu. Rev. Physiol. 35 117–50