Evaluating the strategy begins with the recognition there are no short cuts. .... of techniques is needed to unravel what lies behind the rise in correlation and ..... Further reading on our forward-looking scenario approach can be found on our ...
Evaluating Multi-Asset Strategies
May 2016 This document is intended for institutional investors and investment professionals only and should not be distributed to or relied upon by retail clients.
Evaluating multi-asset strategies
As increasing numbers of investors recognize the many potential benefits of a multi-asset approach, we explore how best to assess multi-asset outcomes. In particular, we highlight the importance of looking beyond simple correlation measures. Rather, only by employing a range of techniques can we seek to deepen our understanding of multi-asset strategies and gain real insight into their underlying drivers. K. Stuart Peskin, CFA Investment Director, Standard Life Investments Boston
Multi-asset strategies are successfully gaining ground within institutional portfolios, and their role is likely to grow. This is no mean accomplishment. Institutional portfolios typically are well-tuned structures that require re-shaping to accommodate additional strategies. Despite the barriers, it is estimated that assets allocated to multi-asset strategies will increase by 10% annually over the next several years, making it one of the most rapidly growing investment approaches in the US.* A Greenwich Associates study of US institutional investors commissioned by Standard Life Investments underlines the many benefits of multi-asset strategies. These include potential for improved diversity, greater liquidity and reduced volatility. Also advantageous is their ability to fit readily alongside a variety of investment approaches and asset class categories. That said, multi-asset strategies come with challenges, including even simply defining the term ‘multi-asset’. This paper addresses a particularly problematic area – how to evaluate multi-asset strategy outcomes. Evaluating the strategy begins with the recognition there are no short cuts. Relying on only one or two measures for evaluation can lead to misinterpretation of the historical investment results achieved from multi-asset strategies. Instead, it is advisable to use a variety of evaluation techniques. One of these – correlation – we discuss in depth, as we believe it is misunderstood in many dimensions of multi-asset investing. We go on to examine some of the more useful performance and risk analytics that can help us understand what drives multi-asset investment outcomes.
*The New Imperatives: Gaining an Edge in North American Asset Management (McKinsey & Company, Dec. 2014), p. 17.
2 Evaluating Multi-Asset Strategies
Limitations of correlation in evaluating strategies and markets For multi-asset investors who strive to interpret a manager’s investment strategies and understand markets at the macro level, correlation stands out as a preferred measure. It is one of a handful of commonly used statistics, along with beta, Sharpe ratios and others. As one element of a robust evaluation process, correlation is a useful metric – measurement of the connections between different investment exposures is an essential component of the investor’s toolkit. However, problems arise when the limitations of correlation are not fully appreciated. Correlation complexities Statisticians and social scientists have written volumes about the dangers attached to interpreting correlation. In fact, there is a Wikipedia webpage dedicated to the concept that correlation does not imply causation (https://en.wikipedia.org/wiki/Correlation_does_not_imply_causation). Similarly, another routinely debunked myth is that highly correlated variables are destined for the same performance outcome. Various capital market studies highlight how an instantaneous measure of co-movement may not provide the full story: ¬ average correlation does not capture tail dependence ¬ correlations change when regime shifts happen, so there is a danger of averaging through the change ¬ correlation is very sensitive to individual outlier events which can lead to unstable correlation results. Investors unaware of these limitations may apply correlation results in an overly simplistic manner. We look at each of the above in turn.
Evaluating Multi-Asset Strategies 3
Correlation and tail dependence One tail-dependent relationship that correlation fails to capture is that between equities and investment grade corporate fixed income (IG credit). In turbulent periods, these two asset classes tend to move in close alignment. Despite this, the correlation of stocks (represented by the S&P 500 Index) and IG credit (represented by Barclays US Corporate Fixed Income Index) has averaged just -0.04 in the US over the last 10 years using a weekly time window. Interestingly, only a negligible increase in correlation was seen even during the most turbulent months of the global financial crisis. While equities and IG credit had a similar pattern of performance, correlation showed little evidence of this connection. This illustrates the risk of an asset class relationship going undetected when we rely on correlation. At Standard Life Investments, we sought to address this problem by developing our own robust methods to monitor markets, going beyond historical correlation. One of the measures we use is designed to highlight sudden, discrete changes in asset class relationships by comparing the last observation of correlation to the recent trend. We also track gradual but significant changes in correlation by comparing its level at the beginning and end of a time period. In the next section, we show why this is important.
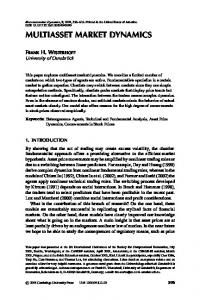
Correlation and regime shifts Over the past 10 years, the weekly correlation of the US dollar/euro exchange rate and European stocks has averaged -0.2. From this information, one might infer that this currency pair and European equities have no strong relationship. However, during this time, there were substantial swings in correlation (see Exhibit 1). For instance, reviewing one-year rolling periods, correlation swung between a low of -0.63 in May 2010 and a peak of 0.59 in February 2015. In our assessment, there have been unique strong, persistent market drivers influencing correlation over the timeframe. Specifically, the episode of strongly negative correlation in May 2010 coincides with the worst of the Eurozone crisis. The period of positive correlation in February 2015 we believe was associated with European Central Bank quantitative easing. Seeking some early indication of this type of regime shift, we monitor unusual market behavior by combining correlation with volatility, rather than by looking at correlation alone. When both correlation and volatility move sharply and to a degree that is statistically significant, our ‘unusualness’ index spikes. Alerted by this information, our multi-asset investment specialists examine world and market events in order to understand the root of this exceptional correlation and volatility behavior. In particular, they question whether it might herald a regime shift that will take time to work into longer-term correlation statistics.
4 Evaluating Multi-Asset Strategies
Correlation and sensitivity to ‘outlier’ events Multi-asset investors seek consistent and practical methods to evaluate correlations between their portfolio exposures. Using methods based on historical events, the degree to which an individual event may destabilize correlation figures can be surprising. Exhibit 1 displays the impact of Switzerland’s abrupt and chaotic removal of its three-year-old currency linkage with the euro in January 2015. Financial markets were seized with panic: within minutes, the Swiss franc soared over 20% versus other currencies, while Swiss equities plummeted. This had a very dramatic effect on correlation calculations.
Exhibit 1: Historic correlation 0.80 0.60
Correlation
0.40
Correlation of USD and European currencies to equities begins showing structural change in European Central Bank policy
0.20 0.00 -0.20 -0.40
Swiss National Bank abandons euro peg - resulting in unstable historic correlation
-0.60 -0.80 02/01/2009
02/01/2010
02/01/2011
USD/CHF & EuroStoxx Correlation
02/01/2012
02/01/2013
02/01/2014
02/01/2015
02/01/2016
USD/EUR & EuroStoxx Correlation
Source: Bloomberg
Evaluating Multi-Asset Strategies 5
Different ways to evaluate multi-asset strategy outcomes There is no one correct way to evaluate the performance of a multi-asset portfolio as a standalone investment. Basically, an investor needs to look at the outcomes promised by the strategy and ask whether the strategy has achieved these outcomes and whether it is capable of continuing to do so. A range of measures is needed to answer these questions. The selection and emphasis of the techniques used will vary according to the nature of the strategy under evaluation and the investor’s intentions for that strategy in the portfolio. Here, we review methodologies that can help us evaluate multi-asset strategies beyond basic return and risk analysis. We use a case study approach, focusing on a multi-asset strategy that aims to provide downside protection, meaningful diversification to the broader portfolio and an absolute return (without a ‘long’ bias). Our multi-asset strategy strives to earn risk premia by investing in higher-risk asset classes at appropriate times over a medium-term investment outlook. To achieve this, it must hold long risk assets or market-based exposures. Therefore, we expect it to show some correlation with risk assets. Using a monthly time window, Exhibit 2 shows that, over the past three years, the correlation of the multi-asset strategy with US and global equities was higher than it had been during prior periods. How should we evaluate this change in correlation? As discussed earlier, treating this correlation information as proof of a growing connection with risk assets seems ill-advised. Indeed, a variety of techniques is needed to unravel what lies behind the rise in correlation and assess if the current level is aligned with the strategy goal of meaningful diversification.
Exhibit 2: Multi-asset strategy and equity correlations 12/12
12/15
MSCI World
0.26
0.57
S&P 500
0.22
0.59
Three years ending:
Source: Standard Life Investments, eVestment. Multi-asset strategy data derived from GARS US Composite portfolio.
To determine this, we can use either historical or predictive techniques. Historical ¬ Historical tail behavior ¬ Upside versus downside participation ¬ Attribution by asset class Predictive ¬ Risk modelling ¬ Modelling tail behavior Historical evaluation techniques focus on past events. Predictive techniques extrapolate from the past to suggest how the current portfolio might perform under different circumstances in the future. Predictive techniques can be applied to assess historic stress scenarios as well as those not previously encountered.
6 Evaluating Multi-Asset Strategies
Historical measure 1 - Tail behavior Examining tail behavior provides critical information about the strategy’s investment results during periods of market stress. In other words, it assesses performance during the largest drawdowns for risk assets that have occurred historically. In our example, we look to see if our strategy's behavior during market stresses is as tightly tied to the performance of risk assets as correlation statistics predict. We first define our range of difficult past market conditions, these being the five highest equity market drawdowns since July 2006. During these periods, drawdowns ranged from 9% to 37%, yet the strategy's participation in the market's decline never exceeded 25% of the drawdown. Moreover, this limited drawdown was maintained during the last three years, during which time the strategy's correlation with equities had increased. Therefore, a rise in correlation does not necessarily infer a reduction in the portfolio’s downside protection. Historical measure 2 - Upside versus downside participation Examining tail behavior gives an idea of how well a strategy might weather difficult markets. However, it does not demonstrate how the strategy will fare when markets are rising. Performance in both rising and falling markets is vital to a strategy's long-term returns. Thus, it is useful to break down returns in different market environments to observe the degree of market capture. We are particularly interested in asymmetric behavior: ideally, we want the strategy to rise when the market falls and to fall infrequently when the market rises. We compare 114 months of consecutive data (up to 31 December 2015) for our sample multi-asset strategy versus US equities (see Exhibit 3). Focusing on the upper left and lower right quadrants (shaded in pink), an assessment of asymmetrical behavior is possible. The dots falling in these quadrants represent months when equities posted a negative return while the strategy delivered a positive return, or vice versa. We find that the strategy delivered positive results in more than half the negative equity months (21 of 37). By contrast, the strategy was down in only 15% (11 of 77) of the positive equity months. Encouragingly, this indicates that our strategy has captured more of the upside of risk assets than downside.
Exhibit 3: Multi-asset strategy and S&P 500 monthly returns 8
- Equities / + Multi-asset strategy 0.23
+ Equities / + Multi-asset strategy 0.43
6 4 2 0 -2 -4 - Equities / - Multi-asset strategy 0.19 -8 -15 -10
-5
0
5
+ Equities / - Multi-asset strategy 0.10 10 15
Source: Standard Life Investments - multi-asset strategy represented by gross performance of converted $ performance of GARS £ SICAV portfolio from 12 June 2006 to 7 June 2011. GARS US$ SICAV gross performance thereafter. MSCI World from FactSet
Evaluating Multi-Asset Strategies 7
To examine this relationship more systematically, we charted the strategy's upside and downside capture ratios (see Exhibit 4). For this analysis, we used three-year rolling periods instead of the shorter periods in the tail-risk analysis. This allowed us to ascertain whether the strategy consistently delivered asymmetry in its returns – investors care about all time periods, not just spells of high downward volatility. As before, we are looking for the strategy to participate more in market upside than in downside.
Exhibit 4: Rolling three-year upside/downside capture 40.00 30.00 20.00 10.00 0.00 -10.00 -20.00 7/1/2009 Upside capture ratio
5/1/2010
3/1/2011
Downside capture ratio
1/1/2012
11/1/2012
9/1/2013
7/1/2014
5/1/2015
Source: Standard Life Investments - multi-asset strategy represented by gross converted $ performance of GARS £ SICAV portfolio from 12 June 2006 to 7 June 2011. GARS US$ SICAV gross performance thereafter. Bloomberg 31 March 2009 to 31 December 2015
Exhibit 4 shows the upside and downside capture ratios (calculated as: (strategy return/index return) x 100) for our multi-asset strategy versus the S&P 500 Index over rolling three-year periods. Clearly, upside capture (represented by the light blue bars) exceeded downside capture (the dark blue bars). Upside capture generally ranged from 25% to 35%. By contrast, downside capture typically ranged from -15% to 10% (a negative ratio for downside capture means that when the market is falling, the strategy is rising). These ratios highlight the strategy's asymmetry – it captured more of the upside than downside. Also, this demonstrates that correlation between the strategy and equities is materially different in up-markets versus down-markets. This is an important distinction that would be missed by a longterm view of correlation. Additionally, the chart demonstrates that there is greater variation in downside capture. This reflects periods when the strategy performed particularly well during falling markets. Using the same data, we highlight this in Exhibit 5. In each of the five months when the market fell between October 2009 and August 2010, the strategy delivered positive returns (see the first blue circle in Exhibit 5). This made a significant contribution to the negative downside capture value. Similarly, the strategy delivered positive returns in the three months when the market fell between January 2014 and September 2014 (see the second blue circle in Exhibit 5).
8 Evaluating Multi-Asset Strategies
Exhibit 5: Monthly returns in up-market versus down-market months 15 10 5 0 -5 -10
S&P 500
10/15
07/15
04/15
01/15
10/14
07/14
04/14
10/13
01/14
07/13
04/13
01/13
10/12
07/12
04/12
10/11
01/12
07/11
04/11
01/11
10/10
07/10
04/10
01/10
10/09
07/09
04/09
01/09
10/08
07/08
04/08
01/08
10/07
07/07
04/07
01/07
07/06
-20
10/06
-15
Multi-Asset Strategy
Red circles highlight periods where performance was largely negative, but our multi-asset strategy was positive. When such sustained periods drop out of three-year calculations downside capture ratios inevitably rise (unless replaced by a comparable sustained period). Source: Bloomberg, July 2006 to December 2015
Historical measure 3 – Attribution by asset class Now that we understand the portfolio’s performance characteristics, we can establish how much of its return comes from equities. We start by calculating the cumulative returns generated by each long equity position. Since its inception in July 2006 to December 2015, it turns out that only about 13% of the strategy's cumulative total return was derived from long equity exposures. Relative value equity positions accounted for about 7% of the total return over that period. Even taken together, these amounts represent just over 20% of the strategy’s total return since inception. And yet, importantly for our investigation of the change in correlation, over the three years to December 2015 the return contribution from long equity was around one-third of the total return*. Attribution analysis underscores the limitations of correlation in explaining the strategy’s returns. At the same time, it helps to shed light on the role played by equities in generating the portfolio's historical returns, something that other statistics may not do with the same degree of precision. Predictive measure 1 - Risk modelling To engage in risk modelling, we must understand the portfolio’s exposures. This historical data become the foundation of a risk-based view of the portfolio, providing insight as to how meaningfully it is exposed to different asset classes. Exhibit 6 shows the equity exposure of the sample multi-asset portfolio, typically ranging from 25% to 35%. This leaves room for other portfolio sources to generate returns, in accordance with the objective that no one risk factor dominates the strategy's return profile. (It is also important to note that the guidelines in the case of this particular strategy limit equity exposure to 40%.) In our example, we group equity and equity relative value strategies together. Their combined contribution to portfolio risk was roughly 36% of the total standalone group risk of the strategy, as at 31 December 2015. Certain equity relative value strategies have low or even negative correlation to the portfolio as a whole. Risk modelling has therefore revealed how the strategies work together in a blended, diversified portfolio.
*In fact, when we look at prevailing market behavior over the two periods (January 2013 to December 2015 and July 2006 to December 2015), it helps explain the increase in the proportion of equity returns generated by our multi-asset strategy in the past three years. It suggests that our multi-asset strategy was well-positioned to capture the higher returns available from equities, as they steadily regained favour from 2012/3.
Evaluating Multi-Asset Strategies 9
In addition, the composition of the portfolio will change over time and therefore short-term correlation is unlikely to persist. Any alteration of the manager's investment outlook will also result in a change of strategy positioning, which could materially alter the allocation of risk.
Exhibit 6: Sample portfolio asset class exposures 100% 90% 80% 70% 60% 50% 40% 30% 20%
Cash
Inflation
Security Selection
Volatility
Real Estate
Duration
FX
Q4 2015
Q3 2015
Q2 2015
Q1 2015
Q4 2014
Q3 2014
Q2 2014
Q4 2013
Credit
Q1 2014
Q3 2013
Q2 2013
Q1 2013
Q4 2012
Q3 2012
Q2 2012
Q4 2011
Q1 2012
Q3 2011
Q2 2011
Q1 2011
Q4 2010
Q3 2010
Q2 2010
Q1 2010
Q4 2009
Q3 2009
Q2 2009
Q1 2009
Q4 2008
Q3 2008
Q2 2008
Q1 2008
Q4 2007
Q3 2007
Q2 2007
Q1 2007
Q4 2006
0%
Q3 2006
10%
Equities
Source: Standard Life Investments GARS US Composite portfolio, 31 December 2015
To deepen our understanding of the portfolio's risk profile we use the APT risk model. It provides an estimate of portfolio and equity correlation, and the volatility of each. Using these two outputs, we can arrive at an implied equity beta for the portfolio, i.e. an approximation of its sensitivity to market movements, adjusted for its volatility. According to the model, as of end-2015, correlation between our sample multi-asset portfolio and global equities was 0.62 and its volatility was 3.9%. This implies a forward-looking beta of 0.2 (portfolio volatility is estimated as 33% of equity, giving an implied forward-looking beta of 0.62 x 0.33 = 0.2). Accounting for expected portfolio volatility, this methodology suggests a connection to equities substantially below historic levels of correlation. This type of analysis depends on the future being the same as the recent past. It also assumes the portfolio remains unaltered from the time of the snapshot. In reality, the dynamic nature and asymmetric behavior of risks within a strategy means that the interplay between them is subject to marked shifts in different regimes. And so, while these estimates provide useful information, other methods of analysis must be considered. Predictive measure 2 - Tail behavior modelling To overcome the shortcomings of the risk modelling analysis discussed above, we believe it is critical to examine the portfolio’s behavior under stress scenarios that by definition are likely to be different from what has happened ‘on average’ in the past. The aim is to test the portfolio in different risk and correlation regimes before such stresses occur and determine whether the strategy already has the necessary protective diversification. To do this, we conduct both historic and forwardlooking stress analysis.
10 Evaluating Multi-Asset Strategies
Tail behavior: historical scenarios We use historical analysis to assess how our multi-asset strategy might behave should various scenarios from recent years recur (see Exhibit 7). Historical tail behavior modelling is almost entirely objective. What happened to different assets during each stress period is a matter of record and, with the exception of new asset classes, not open to debate. Evaluating our strategy under these scenarios is therefore a demanding test – the portfolio is built around what we believe is likely to make money and diversify in tomorrow’s environment. If the portfolio also happens to work well in historic stresses, this is a strong endorsement of our objective to be diversified during extreme events. It tells us whether the portfolio’s behavior under extreme stresses is aligned with our expectations for such events. In fact, our test comparing our sample multi-asset strategy with global equities showed that beta in Exhibit 7: Example of historical tail-risk modelling extreme stresses would be low – a useful confirmation of the theoretical evaluation we carried out above (see Exhibit 7). Black Monday 1987-28 -26 -24 -22 -20 -18 -16 -14 -12 -10 -8 -6 -4 -2 0 2 4 6 8 10 12 14 16 18 Gulf War 1990 Rate Rise 1994 Mexican Crisis 1995 Asian Crisis 1997 Russian/LTCM Tech Wreck (April 07 - 14, 2000) Sept 11th Equity Sell-Off (August 23 - October 09, 2002) Equity Rally (October 10 - November 27, 2002) Gulf War 2 (March 01 - 23, 2003) Bond Rally (May 01 - June 13, 2003) Bond Sell-Off (June 14 - July 31, 2003) Emerging Market Sell-Off 2006 (May 01 - June 08, 2006) Subprime Debacle 2007 (July 15 - August 15, 2007) Bank Meltdown 2008 (September 12 - October 15, 2008) Euro Crisis (July 22 - August 23, 2011) QE jitters (May 22 - June 24, 2013)
% Move S&P 500 (USD) move over same period Multi-asset strategy represented by Standard Life Investments' US Composite Portfolio Source: Standard Life Investments, RiskMetrics as of 31 December 2015
Tail behavior: forward-looking scenarios While historic scenario testing is demanding and objective, there is a possibility that the stresses of the past do not fully represent possible future world shifts. While human nature inclines us to avoid thinking about crises or realizing that their probability can be relatively high, any statistical analysis of tail events demonstrates their relevance for all investors. We therefore need to go further and evaluate the portfolio under never-before-seen stresses. A simplistic approach is to add or subtract 100 basis points to bond yields and determine what return outcomes might be expected for the whole portfolio. However, while this may be adequate for single-asset portfolios, for a multi-asset portfolio it fails to allow for the interconnectedness of asset classes or changes to those connections during times of stress. One approach is to develop complex multi-regime and 'fat-tailed' distribution models. (Fat-tailed distributions occur when the distribution falls outside the normal bell-shaped curve. They arise when many events or values stray wide of the average, giving extreme high and low values. This makes the bell flatter and fat-tailed.) This too has drawbacks – the models are computationally intense and generally lack analytical solutions. To circumvent these problems and supplement our understanding, we developed a proprietary forward-looking scenario analysis methodology. This is an advanced approach that looks beyond the assumptions of traditional stress modelling. It combines the opinions and judgement of experts with quantitatively determined relationships between market risk factors, so creating richer, more coherent scenarios. In this way, we generate the expected impact on our portfolios of a ‘neverbefore-seen’ event in a rational manner that does not simply assume a period of history recurs.
Evaluating Multi-Asset Strategies 11
To model future risk events, we first consider possible extreme but plausible future stresses. These may be economic, geopolitical, environmental, societal or technological. We then refer to expert judgement to identify the key factors and how they might respond, focusing on markets with a direct causal link to the stress under consideration. Next, we combine the key factor market moves with market simulations in a manner that weights the simulations to capture the fat-tailed nature of the outcome. This creates a distribution for individual assets and portfolios that represents the range of potential outcomes under a particular stress, rather than simply a point estimate. Critically, the evaluation tells us how well the strategy weathered the projected stress scenario in comparison with the relevant asset classes.
There are several stress scenarios arising from global flashpoints that we are currently considering. These include: ¬ European (dis)integration ¬ Cold War II ¬ inflation shock ¬ China crisis ¬ crunch time in emerging markets ¬ the Bundesbank strikes back ¬ currency war ¬ turning of the credit cycle. Further reading on our forward-looking scenario approach can be found on our website.
The best evaluation measures will vary In our experience, investors use multi-asset strategies in different ways. For this reason, the emphasis on different evaluation measures will vary. To identify the most appropriate metric, we first ascertain the placement and role intended for the multi-asset strategy.* To illustrate, US investment consultant Callan determines the placement and role possibilities of multi-asset portfolios in the following way. Placement ¬ identify distinct ‘core’ allocation, this being the middle ground between ‘risky’ and ‘defensive’ allocations ¬ identify allocations within an existing grouping, including long-only, hedge fund, or opportunistic Roles ¬ to complement strategies with different expected outcomes ¬ to serve as an anchor to a group of focused strategies ¬ to strategically tilt the overall portfolio in a tactical manner in an asset allocation process that is not set up to be dynamic or responsive *For a discussion of multi-asset strategy roles, see “Bridging the Gap: Multi-Asset Class Strategies,” Callan Hedge Fund Monitor (June 2015).
12 Evaluating Multi-Asset Strategies
For instance, if a multi-asset strategy is identified as an alternative allocation designed to serve as an anchor for the wider portfolio, the evaluation should focus on how the strategy is set up to behave when other investments fall. In this case, the emphasis will be on tail behavior, to show whether or not the strategy is fulfilling the goal set for it. Below, we share a selection of what we believe are key evaluation measures for given placement and role combinations.
Placement
Role
Key measure
Equity
Complementary to long-only
Up and down participation
Alternative
Anchor/downside protection
Tail behavior
Standalone
Provides strategic tilts
Attribution
Core fixed income
Enhances return with modest increase in risk Attribution
Summary Institutional investors will benefit from a more nuanced analysis of multi-asset portfolios. In particular, correlation can be misleading when viewed in isolation. Thus, investors analyzing historical information and variations in correlation between risk assets and the multi-asset portfolio should not use this information to drive decision making. Rather, correlation should be complemented by other measures. For example, we can use tail behavior to understand performance during market stress. Similarly, analysis of market capture in both rising and falling markets will provide insight into long-term returns. Asset class attribution and market participation analysis will corroborate – or reject – our findings on correlation. Predictive measures, such as risk modelling and tail behavior modelling, will complement historical methods. Investors should also consider the placement and role of the strategy to determine which evaluation technique is most important.
Evaluating Multi-Asset Strategies 13
Important information This material is not intended as an offer to sell or a solicitation of an offer to buy any security, and it is not provided as sales or advertising communication and does not constitute investment advice. Products and services described herein are provided by Standard Life Investments, its subsidiaries, affiliates or related companies. An investment in any strategy is speculative and involves certain risks. Prospective investors should ensure that they: (1) understand the nature of the investment and the extent of their exposure to risk; (2) have sufficient knowledge, experience and access to professional advisors to make their own legal, tax, accounting, and financial evaluation of the merits and risks of participating in an investment in the strategy; and (3) consider the suitability of investing in light of their own circumstances and financial condition. Due to among other things, the volatile nature of the markets and the investment strategies discussed herein, they may only be suitable for certain investors. No investment strategy or risk management technique can guarantee return or eliminate risk in any market environment. Past performance is not a guide to the future. No assurance can be made that profits will be achieved or that substantial losses will not be incurred.
14 Evaluating Multi-Asset Strategies
To find out more, visit www.standardlifeinvestments.com where you will find contact details for your location.
Visit us online
www.standardlifeinvestments.com
Evaluating Multi-Asset Strategies 15
standardlifeinvestments.com Standard Life Investments Limited is registered in Scotland (SC123321) at 1 George Street, Edinburgh EH2 2LL. Standard Life Investments Limited is authorised and regulated in the UK by the Financial Conduct Authority. Standard Life Investments (Hong Kong) Limited is licensed with and regulated by the Securities and Futures Commission in Hong Kong and is a whollyowned subsidiary of Standard Life Investments Limited. Standard Life Investments Limited (ABN 36 142 665 227) is incorporated in Scotland (No. SC123321) and is exempt from the requirement to hold an Australian financial services licence under paragraph 911A(2)(l) of the Corporations Act 2001 (Cth) (the 'Act') in respect of the provision of financial services as defined in Schedule A of the relief instrument no.10/0264 dated 9 April 2010 issued to Standard Life Investments Limited by the Australian Securities and Investments Commission. These financial services are provided only to wholesale clients as defined in subsection 761G(7) of the Act. Standard Life Investments Limited is authorised and regulated in the United Kingdom by the Financial Conduct Authority under the laws of the United Kingdom, which differ from Australian laws. Standard Life Investments Limited, a company registered in Ireland (904256) 90 St Stephen’s Green Dublin 2 and is authorised and regulated in the UK by the Financial Conduct Authority. Standard Life Investments (USA) Limited is registered as an Exempt Market Dealer with the Ontario Securities Commission and as an Investment Adviser with the US Securities and Exchange Commission. Standard Life Investments (Corporate Funds) Limited is registered as an Investment Adviser with the US Securities and Exchange Commission. Calls may be monitored and/or recorded to protect both you and us and help with our training. www.standardlifeinvestments.com © 2016 Standard Life, images reproduced under licence. INVBGEN_16_1592_Investment_Insight_Evaluating_MA_portfolios_TCM
0516