Evaluating Multi-Query Sessions Evangelos Kanoulas∗ , Ben Carterette† , Paul D. Clough∗ , Mark Sanderson‡
[email protected],
[email protected],
[email protected],
[email protected] ∗
†
Information School, University of Sheffield, Sheffield, UK Department of Computer & Information Sciences, University of Delaware, Newark, DE, USA ‡ School of Computer Science & Information Technology, RMIT, Melbourne, Australia
ABSTRACT The standard system-based evaluation paradigm has focused on assessing the performance of retrieval systems in serving the best results for a single query. Real users, however, often begin an interaction with a search engine with a sufficiently under-specified query that they will need to reformulate before they find what they are looking for. In this work we consider the problem of evaluating retrieval systems over test collections of multi-query sessions. We propose two families of measures: a model-free family that makes no assumption about the user’s behavior over a session, and a model-based family with a simple model of user interactions over the session. In both cases we generalize traditional evaluation metrics such as average precision to multi-query session evaluation. We demonstrate the behavior of the proposed metrics by using the new TREC 2010 Session track collection and simulations over the TREC-9 Query track collection. Categories and Subject Descriptors: H.3.4 [Information Storage and Retrieval] Performance Evaluation General Terms: Experimentation, Measurement Keywords: information retrieval, test collections, evaluation, sessions
1.
INTRODUCTION
Evaluation measures play a critical role in the development of retrieval systems, both as measures in comparative evaluation experiments and as objective functions for optimizing system effectiveness. The standard evaluation paradigm has focused on assessing the performance of retrieval systems in serving the best results for a single query, for varying definitions of “best”: for ad hoc tasks, the most relevant results; for diversity tasks, the results that do the best job of covering a space of information needs; for knownitem tasks, the single document the user is looking for. There are many test collections for repeatable experiments on these
Permission to make digital or hard copies of all or part of this work for personal or classroom use is granted without fee provided that copies are not made or distributed for profit or commercial advantage and that copies bear this notice and the full citation on the first page. To copy otherwise, to republish, to post on servers or to redistribute to lists, requires prior specific permission and/or a fee. SIGIR’11, July 24–28, 2011, Beijing, China. Copyright 2011 ACM 978-1-4503-0757-4/11/07 ...$5.00.
tasks, and dozens of evaluation measures assessing different aspects of task effectiveness. Real users, however, often begin an interaction with a search engine with a query that they will need to reformulate one or more times before they find what they are looking for. Early studies on web search query logs showed that half of all Web users reformulated their initial query: 52% of the users in 1997 Excite data set, 45% of the users in the 2001 Excite dataset [15]. The standard evaluation paradigm of single-query test collections seems unable to assess the effectiveness of retrieval systems over sequences of query reformulations. Interactive evaluation has been employed as an alternative. In interactive evaluation the user is part of the evaluation cycle and freely interacts with the results of a retrieval system. Measures such as instance recall [11] and session discounted cumulative gain [6] have been proposed to capture the effectiveness of systems in these settings. Even though an interactive evaluation paradigm can better capture the actual user experience, it is both noisy due to the high degrees of freedom of user interactions and expensive due to its low reusability and need for many test subjects. Furthermore, conducting interactive comparative evaluation experiments is by no means an easy task. The TREC 2010 Session track [7] proposed an experiment for the evaluation of retrieval systems over multi-query sessions. We defined a session as a sequence of reformulations in the service of satisfying a general information need, and constructed a test collection of two query reformulations (an initial and a follow-up query) for each of 150 information needs. This collection makes compromises for simplicity and tractability, but it provides a starting point for investigation of questions about test collection-based session evaluation. In addition to a test collection, new evaluation measures are necessary as well. Traditional evaluation measures only capture per-query effectiveness; they are not necessarily appropriate for evaluating the effectiveness of a retrieval system over a multi-query session. While one could evaluate results for each query in the session in isolation, it may not be the case that the system is serving results for each query independently. Doing so would lose potentially valuable information about the ability of the system to provide results for the session as a unit, and thus reduce our ability to optimize system performance across sessions. Due to the lack of appropriate measures J¨ arvelin et al. [6] extended the normalized discounted cumulative gain (nDCG) measure to a measure that considers multi-query sessions. The measure—called normalized session discounted cumula-
tive gain (nsDCG)—discounts documents that appear lower in the ranked list for a given query as well as documents that appear after more query reformulations. In a sense the new model incorporates a cost for reformulating a query as well as scanning down a ranked list. The nsDCG measure is computed as follows: for each query in a series of reformulations, DCG is computed in isolation of all other queries in the series. Each DCG is then discounted by a function of the position q of the query in the series. The measure can evaluate the effectiveness of retrieval systems over multiple queries in an interactive retrieval scenario, in which a user moves down a ranked list of documents and at some rank reformulates the query. Since the reformulation points are known (from observing the users), DCG is computed at those points for each query and at the stopping point for the last reformulation. In a test collection of static sessions, however, reformulation points are unknown. Using nsDCG requires the selection of a fixed reformulation cut-off, which clearly does not reflect the fact that different retrieval results may trigger different user behavior. Further, the measure does not model early abandonment of a query session; our TREC session collection comes with a fixed number of reformulations, but a user may choose to abandon the session before reaching the last reformulation (either due to satisfaction or due to frustration). A multi-query session measure should be able to model such behavior. Yang and Lad [16] overcame the need to define a fixed reformulation point by defining a session measure as an expectation over a set of possible browsing paths. Based on this they proposed a measure of expected utility for a multiquery information distillation task. Given a series of m reformulations the proposed measure accounts for all possible browsing paths that end in the kth reformulation. Each path has a certain probability to be realized by a user. To define the probability of a user following a certain path Yang and Lad [16] follow the rank biased precision (RBP) framework [10], replacing RBP’s stopping condition with a reformulation condition. The utility of each path is a function of the relevance and novelty of the returned documents being considered. The system effectiveness is then defined as the expected utility calculated over the aforementioned probabilistic space of browsing paths. Though the expected utility solves the problem of variable reformulation points, it still does not allow early abandonment of the query session. In this work we consider the problem of evaluating retrieval systems over test collections of static multi-query sessions. We propose two families of measures: one that makes no assumptions about the user’s behavior over a session, and another with a simple model of user interactions over the session. In the latter case we provide a general framework to accommodate different models of user interactions in the course of a session, avoiding predefined reformulation cut-offs and allowing early abandonment. In both cases we generalize traditional evaluation measures such as average precision to multi-query session evaluation.
2.
MULTI-QUERY SESSION COLLECTION AND USER MODEL
We define a session test collection as one with a set of topics, each of which consist of a description of an information need and a static sequence of m title queries (an initial query
query q1,1 ranking 1 d1 N d2 N d3 N d4 N d5 N d6 N d7 N d8 N d9 N d10 N ... ...
query q1,2 ranking 2 d01 R d02 R d03 R d04 R d05 R d06 N d07 N d08 N d09 N d010 N ... ...
query q1,3 ranking 3 d001 R d002 R d003 R d004 R d005 R d006 R d007 R d008 R d009 R d0010 R ... ...
Table 1: Example rankings (document IDs and relevance judgments) for three queries q1,1 , q1,2 , q1,3 in a session for topic number 1. Here we assume all documents are unique.
and m − 1 reformulations), and judgments of the relevance of documents to the topics. For simplicity, we assume that all reformulations are directed towards a single information need, so there is a global set of relevant documents of size R.1 This definition is similar to those used by J¨ arvelin et al. [6] and Yang & Lad [16], and it is essentially the definition used for the TREC 2010 Session track in the case of specification and generalization reformulations [7]. Following Cooper in his proposal for the expected search length measure [5], we assume a user stepping down the ranked list of results until some decision point. To this we add an additional possible action: the decision point can be either a stopping point for the search, or a point at which the user reformulates their query. Thus, a user experiences results by either moving down a ranking (i.e. moving from rank k to rank k + 1 in ranking ~ri ) or to the top of the next ranking by reformulating ( i.e. moving from rank k in ranking ~ri to rank 1 in ranking ~ri+1 .). Consider the example in Table 1. A user with a certain information need formulates a query and submits it to a retrieval system. The retrieval system returns a ranked list of documents, ~r1 = (d1 , d2 , ..., d10 , ...). Suppose the user’s first decision point occurs at document d5 . After seeing that document, the user decides to reformulate the original query and resubmit it to the retrieval system. The retrieval system responds with a second ranked list of documents, ~r2 = (d01 , d01 , ..., d010 , ...). The user reads the documents once again from top to bottom and abandons the session. If we only consider the documents the user has examined over the session of reformulations then a final composite ranked list, ~ can be composed: cl ~ = (d1 , d2 , . . . , d5 , d01 , d02 , d03 , . . . ). cl, Given the relevance of the documents in the composite ~ any traditional evaluation measure can be ranked list cl, calculated in the usual manner. We may require assumptions about the relevance of duplicates, e.g. if d1 and d02 are the same relevant document, how they should count towards the evaluation measure; we will consider these in Section 5. 1 In practice users’ information needs may change during a search session and over time [1]; assuming it is fixed is a modeling assumption we make for tractability. Some of our measures require this assumption, but it can be relaxed for other measures.
2.1
Evaluation over paths
~ is the outcome of a series of decisions. The composite list cl We define a path ω through the results as a series of decisions to either move down a ranking, reformulate and start at the top of the next ranking, or abandon the search. We assume that at least one document—the first one—is viewed in each ranking. A path of length k is a path that results in k documents viewed. We denote the set of unique paths of length k as Ωk , and the set of all unique paths as Ω. A path can be represented as a series of actions, e.g. ω = {down, down, ..., reformulate, down, ..., abandon}; as a series ~ above; or as a series of document IDs viewed, e.g. ω = cl of ranks at which reformulations or abandonment occurred, e.g. ω = {5, ...}. The three are equivalent in the sense of providing complete information about the series of decisions; the last, being most compact, is the one we will use. Different paths result in different documents being seen, and in many cases different numbers of relevant documents. Precision after k documents viewed may result in very different values depending on the path chosen: a user that views 10 documents in ~r1 (the relevance of which is shown in Table 1), experiences 0 precision, while one that reformulates immediately after the first document in ~r1 and steps down ~r2 until rank 9 experiences precision of 5/10. In an interactive evaluation scenario where real users interact with the ranked list of documents returned by a retrieval system, the point at which a user decides either to reformulate their previous query or to abandon the search can be explicitly recorded by observation, or implicitly inferred by looking at (for instance) the last clicked document. In batch laboratory experiments with static sessions, however, the reformulation and stopping points are undefined—there is no user from which to record them. This presents a challenge for defining evaluation measures. In this work we propose evaluating static sessions by summarizing evaluation results over all paths through the results. We will consider two directions: one a “model-free” approach inspired by interpolated precision and recall, the other a model-based approach that explicitly defines probabilities for certain actions, then averages over paths. In both approaches we would like to make as few assumptions as possible about the reasons a user reformulates.
2.2
Counting paths
The number of possible paths grows fairly fast. Consider a path of length k ending in reformulation number j. For example, the paths of length 4 ending at reformulation 2 are {d1 , d2 , d3 , d01 }, {d1 , d2 , d01 , d02 }, and {d1 , d01 , d02 , d03 }. For any given k and j, we can count the number of possible paths as follows: imagine a ranking as a list of k documents, then place j − 1 reformulation points between any two documents in that list. ` ´The number of different places we can insert them is k−1 , and this is therefore the number of paths of j−1 length k that end at reformulation j. The total number of paths of length k is: ! m X k−1 |Ωk | = j−1 j=1 This is the definition of elements in the Bernoulli triangle. Its rate of growth is unknown, but it is O(k2 ) for m = 2 and approaches 2k−1 as m increases number of P to k. The total n paths of any length is |Ω| = n |Ω | = O(2 ). k k=1
k k k k k
=1 =2 =3 =4 =5 ···
j=1 {0} {0} {0} {0} {0}
j=2 – {1} {1, 2} {1, 2, 3} {1, 2, 3, 4}
j=3 – – {2} {2, 3, 3} {2, 3, 3, 4, 4, 4}
···
Table 2: Relevant document counts for different paths of length k ending at ranking j from the example in Table 1.
On the other hand, if we only consider paths that end at reformulation j but continue down ranked list ~rj indefinitely, the number is more manageable. We can enumerate these by simply iterating over stopping points k1 = 1...|~r1 |, and for each of those over stopping points k2 = 1...|~r2 |, and so on. Within the (j − 1)st loop, ω = {k1 , ..., kk−1 } is the path to that point. This takes |~r1 | × |~r2 | × · · · × |~rm−1 | = O(nm ) time, which, while not exactly fast, is at least manageable.
3.
MODEL-FREE SESSION EVALUATION
Our first goal is to develop a method for evaluating the effectiveness of a system over a set of reformulations making no assumptions about when or why users reformulate. The approach is inspired by interpolated precision: there is no formal user model behind interpolated precision, but it reduces the full evaluation data (precision at every rank) to a manageable set while still providing useful intuition about system performance, particularly when plotted against recall values. Likewise, there is no formal user model behind these measures, but they give some intuition while greatly reducing the amount of evaluation data, which as we saw above grows exponentially. Consider all paths of length k that end at reformulation j. On each of those paths the user will see a certain number of relevant documents. Let us define a set of relevant counts rR@j, k as the set of counts of relevant documents seen on all such paths.2 In the example in Table 1, there is only one possible way for a user to see 4 documents without reformulating, and none of those documents are relevant; therefore rR@1, 4 = {0}. There are three ways for a user to see 4 documents over two queries: {d1 , d2 , d3 , d01 }; {d1 , d2 , d01 , d02 }; {d1 , d01 , d02 , d03 }. These paths have 1, 2, and 3 relevant documents respectively. Therefore rR@2, 4 = {1, 2, 3}. All sets rR for j =` 1..3´ and k = 1..5 are shown in Table 2; the size of a set is k−1 as described above. j−1 We can then define session versions of precision and recall by dividing the relevant counts rR@j, k by k (for precision) or R (for recall). We will call these rPC@j, k and rRC@j, k. This gives the session generalization to precision and recall: precision and recall for each possible path through the results. In traditional systems-based evaluation there is only one possible path of length k, and precision/recall for that path is identical to precision/recall at rank k. Precision is sometimes interpolated to a particular recall point r by finding the first rank at which recall r is achieved, then taking the maximum of all precisions at that rank or deeper. Let us consider an analogous process for sessions by defining precision at a particular recall point in a particular 2
We use boldface to denote sets and italics to denote scalars.
precision
reformulation order ~r1 , ~r2 , ~r3 ~r1 , ~r3 , ~r2 ~r2 , ~r1 , ~r3 ~r2 , ~r3 , ~r1 ~r3 , ~r1 , ~r2 ~r3 , ~r2 , ~r1
sAP 0.261 0.335 0.344 0.519 0.502 0.602
Table 3: Session average precisions for different permutations of the three ranked lists in Table 1. A system is rewarded for finding more relevant documents in earlier queries. orm ref tio
ula
the precision-recall surface. An expression for sAP is:
ll
n
a rec
sAP =
Figure 1: Reformulation precision-recall surface for the example in Table 1.
0.0
0.2
0.4
0.6 recall
0.8
1.0
1.0 0.8 0.6
precision
0.0
0.2
0.4
0.8 0.6
precision
0.0
0.2
0.4
0.8 0.6 0.4 0.0
0.2
precision
ranking 3
1.0
ranking 2
1.0
ranking 1
0.0
0.2
0.4
0.6 recall
0.8
1.0
0.0
0.2
0.4
0.6
0.8
1.0
recall
Figure 2: Reformulation precision-recall crosssections of Figure 1 for the example in Table 1. Note that these are not precision-recall curves for the three rankings independently.
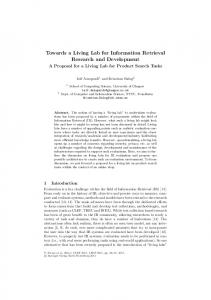
reformulation. At recall 1/R in ~r2 , there is a set of possible precision values {1/2, 1/3, 1/4, ...}, each of which is achieved by a user looking at k = 1, 2, 3, ... documents in ranking 1, then reformulating and looking at the first document in ranking 2. At recall 2/R in ~r2 , the set is {2/3, 2/4, 2/5, ...}. Now we will define sP C@r, j as the maximum value of the set of possible precisions at the first rank in ~rj at which recall r is achieved. This reduces the amount of data to m·R precision values (with m being the number of queries in the static session) that reflect the best possible effectiveness a user could experience. Note that this is not interpolation in the traditional sense. sP C@1/R, 2 may still be less than sP C@2/R, 2, which is not possible in the usual definition. Once we have computed sP C@r, j for each r and j, we can plot a “precision-recall surface” over reformulations. Figure 1 shows the surface for the example in Table 1 with R = 20 under the assumption that all relevant documents in ranking 3 are unique (meaning there are five additional relevant documents that were not retrieved). We can see that precision increases with both recall and reformulation number, suggesting that the system is doing a better job with the later queries. (It may be easier to read cross-sections of the surface. They are shown in Figure 2.) Finally, just as average precision is computed as the area under the precision-recall curve, we can define a model-free “session average precision” (sAP ) as the the volume under
R 1 X sP C@r/R, j mR r=1
where sP C@r, j is the max of the set of all possible precisions at the first point in ~rj at which recall r is achieved. Computing sP C@r, j can be done with the O(nm ) approach described in Section 2.2:3 within the jth loop, calculate precision and recall r over the documents on the path to that point; if precision is greater than the current known maximum for sP C@r, j, update sP C@r, j to that precision. In this example the volume under the surface is 0.261. To test whether sAP follows our intuition that it should be greater when more relevant documents are found for earlier queries, we calculate it for each permutation of the three rankings in our example. The results are shown in Table 3.
4.
MODEL-BASED SESSION EVALUATION
In the previous section we extended three traditional evaluation measures to the case of multi-query session collections in a model-free fashion. The session-based system measures capture the optimal contribution of a system to answer an information need over an entire session. In this section we look at the problem from a user perspective. Note that our definition of sP C in the previous section takes the maximum value of a set. We could instead take the expected value; this has the advantage of using all of the data as well as not assuming that a user will have the optimal experience with the system. However, taking such an expectation requires a probability distribution over paths; formulating such a distribution requires a user model4 . To simplify the space of all possible browsing paths we follow the user model described in Section 2: a user steps down a ranked list of documents until some decision point. It is important that any realization of the distribution over possible paths allows for paths that end before the last reformulation in the static collection. Then, if Ω is the set of all possible browsing paths that follow the simple user model described earlier, P (ω) the probability of a certain path ω ∈ Ω, and Mω a measure over the path ω, then we define a session based measure as the expectation X esM = P (ω)Mω ω∈Ω 3 There is also an O(nm) dynamic programming approach, but we have not included it in this paper for reasons of space. 4 A uniform distribution would not work, since most of the paths are very long and therefore have approximately zero precision.
4.1
Probability of browsing paths
As noted in Section 2, we can express a path ω as a set of reformulation points.Let us therefore formulate P (ω = {k1 , k2 , ..., ki }) as a joint probability distribution of a user abandoning the session at reformulation i, while reformu− → lating at positions ref = {k1 , k2 , ..., ki−1 }. Note that we do not include ki , the abandonment cut-off at ranking i, in the probability. For the sake of generalizing traditional measures, we will assume that once the user arrives at the ith reformulation, they continue down that ranking as far as necessary to compute the measure. We express the probability of a path ω as, − → − → P (ω) = P (ri , ref) = P (ri ) · P (ref|ri ) Here we introduce a simplifying assumption: the reformulation position is independent across the ranked lists 1..ri . − → Then P (ref|ri ) can be expressed as, − → P (ref|ri ) = P (k1 |ri )P (k2 |ri ) · · · P (ki−1 |ri ) In general, we could make each reformulation point dependent on the reformulation number and possibly even on the relevance of documents in the ranking; in this work we have elected to keep them independent for simplicity. For the realization of the probability distribution over different browsing paths we follow Moffat and Zobel [10] in their definition of ranked biased precision and use two geometric distributions. The first gives the probability that the ith reformulation is the last; it has an adjustable parameter preform representing the probability that the user reformulates again from their current query. They will only arrive at reformulation i if they reformulate i − 1 times, so:
very low probability and thus they will not contribute in any significant way in the calculation of a measure.
4.2
Expectations over paths
Given a measure Mω to be computed over the documents viewed on a particular path ω along with the probability distribution over all paths ω ∈ Ω, we can define a session measure as the expectation of Mω over the probabilistic space of paths. X esM = EΩ [M ] = P (ω)Mω ω∈Ω
Let us consider a path-averaging generalization to precision at cut-off k. First define P C@k(ω) as the precision of the first k documents experienced on path ω. Then: X esP C@k = P (ω)P C@k(ω) ω∈Ω
=
pk−1 down (1
P (k) =
− pdown )
The probability of a path is then
where ki , the abandonment cut-off at ranking i, is equal to k − (k1 + k2 + · · · + ki−1 ). Plugging that into the expression for E[P C@k] completes the formula. Similarly, the expectations of recall after k documents can be computed as esRC@k =
i−1 Y 1 X RC@k(ω)P 0 (ri ) P (kj ) R ω∈Ω j=1
where k1 X
1 RC@k(ω) = R
rel1j + · · · +
j=1
Our definition of P (ri ) may give non-zero probability to a path that is not valid for a particular collection of static sessions, e.g. one that ends at some point past the last (mth) reformulation in the collection. To address this, we will truncate the distribution P (ri ) and renormalize it to ensure that the probabilities to stop at different reformulations sum to 1. To do this we simply renormalize the probabilities from 1 to m by P r{r ≤ ri } = 1 − pm reform . That is, P 0 (ri ) =
pi−1 reform (1 − preform ) 1 − pm reform
We could similarly truncate and renormalize P (kj ). However, paths that extend beyond the last retrieved document for a reformulation (typically ranks beyond 1000) will have
! relij
and ki is defined as above. A path-averaging generalization to average precision is: esAP =
X
AP (ω)P 0 (ri )
i−1 Y
P (kj )
j=1
ω∈Ω
j=1
P (kj )
ki X j=1
j=1
i−1
i−1 Y
P (kj )
j=1
P C@k(ω) is the total proportion of relevant documents at ranks 1..k1 in ~r1 , 1..k2 in ~r2 , and so on. ! ki k2 k1 X X 1 X relij rel2j + · · · + rel1j + P C@k(ω) = k j=1 j=1 j=1
Y kj −1 − → P (ri , ref) = pi−1 pdown (1 − pdown ) reform (1 − preform )
= P (ri )
i−1 Y
P C@k(ω)P 0 (ri )
ω∈Ω
P (ri ) = pi−1 reform (1 − preform ) Similarly, the second distribution gives the probability that the kth rank is a stopping or reformulation point with adjustable parameter pdown . A user will arrive at rank k only after deciding to progress down k − 1 times, so:
X
where AP (ω) is the average precision of the concatenated list of documents on path ω. We can continue to define any measure this way. We will conclude with a path-averaging generalization to nDCG: esnDCG@k =
X
nDCG@k(ω)P 0 (ri )
i−1 Y
P (kj )
j=1
ω∈Ω
where nDCG@k(ω) is the nDCG@k of the concatenated list. All of the above formulations involve summing over paths ω. In general, summing a function f (ω) over all paths can be expressed in a brute-force way as: X ω∈Ω
f (ω) =
|r1 | |r2 | X X k1 =1 k2 =1
|ri−1 |
···
X
f ({k1 , k2 , ..., ki−1 })
ki−1 =1
Note that computing it involves on the order of |r1 | × |r2 | × · · · × |rm−1 | = O(nm ) steps.
4.3
Monte Carlo estimation m
A running time of O(n ) is manageable, but it is not fast, especially as m grows. Since our model for these measures is fully probabilistic, a faster alternative approach to estimating them uses simulation. A Monte Carlo simulation method allows the estimation of a measure via repeated random sampling. Running a Monte Carlo experiment requires defining a domain of possible inputs, generating inputs randomly from the domain using specific probability distributions, performing a deterministic computation using the inputs, and finally aggregating the results of the individual computations into the final result. In the case of the user-model based measures proposed above, the input space is the ranking ri at which the user abandons the query and the reformulation cut-offs at all previous queries {k1 , ..., ki−1 }. Each of the above path-averaging measures can be thought as the expected outcome of the following random experiment: 1. Sample the last reformulation ri from P 0 (rj ). 2. Sample (k1 , k2 , ..., ki−1 ) i.i.d. from P (kj ) to form a path ω. 3. Create a ranked list of documents by concatenating ranks 1...k1 from r1 , 1...k2 from r2 , ..., 1...ki−1 from ri−1 , and 1...n from ri . These are the documents seen along path ω. 4. Output measure M over that ranked list. This random experiment defines one round of the Monte Carlo experiment. Executing the first two steps requires sampling from a geometric distribution. This can be easily performed assuming access to an algorithm that generates pseudo-random numbers uniformly distributed in the interval (0, 1). Regarding the distribution of the last reformulation, since it is renormalized, we can first partition the interval (0, 1) to ((0..P 0 (r1 )), (P 0 (r1 )..P 0 (r1 ) + P 0 (r2 )), · · · , (1 − P 0 (rm )..1)). We then use the random number generator to obtain a number in (0, 1), and output j if this number is in the j-th partition. In the case of the cut-off distribution the same process can be followed. As mentioned earlier we did not renormalize this distribution and thus the last partition does not end in 1, however renormalization can be easily performed in the case of Monte Carlo by simply rejecting any sample larger than the upper bound of the last partition. Repeating the process above B times and averaging the results gives an estimate of the expectation of measure M . For most purposes B = 1000 (which will usually be much less than nm ) should be sufficient; we explore the errors in estimates due to B in Section 6.
5.
DUPLICATE DOCUMENTS
Our measures to this point make a strong assumption: that retrieval systems return unique documents for each query reformulation. Under this assumption, the concate~ which corresponds to a nated ranked list of documents cl certain browsing path ω resembles a typical ranked list of document in the standard evaluation paradigm. We certainly do not expect this assumption to hold in real systems; it is likely that documents retrieved for a second query will overlap with those retrieved for the first. When relaxing this
assumption,we need to consider how these duplicate documents should be treated from the perspective of the evaluation measure. The first question raised is whether documents repeated in ranked lists for subsequent reformulations have any value for a user. J¨ arvelin et al. [6] noticed that in an empirical interactive search study conducted by Price et al. [12] searchers overlooked documents in early queries but recognized them in later reformulations. Due to this, the proposed sDCG measure does not give any special treatment to duplicate relevant documents; it considers them relevant regardless of the number of times they have been seen before. But measures with a recall component (such as average precision or recall at k) cannot count duplicates in a sound way. Since there are multiple possible paths through the results, and these paths could have duplicate relevant documents, it is possible that more than R relevant documents could be observed along any given path. The computed measure may exceed the desired maximum value of 1. We can instead consider duplicate documents nonrelevant in all cases. This has certain implications as well. For one, penalizing a retrieval system for returning duplicate documents may lead to systems that are less transparent to their users. Imagine a user that reformulates a query and expects to see previously observed relevant documents at higher ranks than before. If they are not there, the user may question whether the system can ever be useful to them. Furthermore, by definition the expected measures reward a retrieval system that respond in an optimal way to a population of users. These different users may very well follow different browsing paths. In an actual retrieval setup, a system can infer whether a document has been observed by a user (e.g. by observing the users’ clicks). In the case of a batch experiment, however, a certain document may be a duplicate for one user but not for another, depending on the browsing path each one of them has followed. This information is hidden in the parameters of the particular evaluation measure (which simulates the population of users). Taking these parameters into account a system could respond optimally by removing the expected duplicate documents. However, the need of such an inference process and a ranking function that accounts for the average browsing path is just an artifact of the batch nature of experiments. A retrieval system running in the real world will not need to employ such an algorithm. Yang and Lad [16] take an approach in between the two extremes. Although they did not explicitly consider the problem of exact duplicates, the proposed measure is a measure of information novelty over multi-query sessions and thus it takes the typical approach other novelty measures take [4] by defining information nuggets and discounting documents5 that contain the same relevant information nugget. In this work we consider an alternative treatment of duplicates inspired by Sakai’s compressed ranked lists [14] and Yilmaz & Aslam’s inducedAP [17]. When considering a path ω out of the population of all paths, we construct the con~ that corresponds to this path. We then catenated list cl walk down the concatenated list and simply remove duplicate documents, effectively pushing subsequent documents 5 The measure by Yang and Lad [16] was proposed for the task of information distillation and thus it operates over passages instead of documents; the same approach however could be used for the case of documents.
one rank up. This way, we neither penalize systems for repeating information possibly useful to the user, nor do we push unnecessary complexity to the retrieval system side. Further, the measures still reward the retrieval of new relevant documents. Note here that such an approach assumes that a system ranks documents independent of each other in a ranked list (probabilistic ranking principle [13]). If this is not true, i.e. if ranking a document depends on previously ranked documents and the retrieval system is agnostic to our removal policy then this may also lead to unsound evaluation.
6.
EXPERIMENTS
In this section we demonstrate the behavior of the proposed measures. There is currently no “gold standard” for session evaluation measures; our goal in this section is to evaluate whether our measures provide information about system effectiveness over a session and whether they capture different attributes of performance in a similar way to traditional precision, recall, and average precision. We will compare our measures to the session nDCG measure proposed by J¨ arvelin et al., though we consider none of these, nor any other measure, to be the one true session measure. We use two collections towards these goals: (a) the TREC 2010 Session track collection [7], and (b) the TREC-8 (1999) Query track collection [2]. Though the latter is not a collection of multi-query sessions, we will find it useful to explore properties of our measures. Both of these collections are described in more detail below. The instantiation of session nDCG@k we use is calculated as follows: we start by concatenating the top k results from each ranked list of results in the session. For each rank i in the concatenated list, we compute the discounted gain as DG@i =
2rel(i)−1 logb (i + (b − 1))
where b is a log base typically chosen to be 2. These are the summands of DCG as implemented by Burges et al. [3] and used by many others. We then apply an additional discount to documents retrieved for later reformulations. For rank i between 1 and k, there is no discount. For rank i between k + 1 and 2k, the discount is 1/ logbq (2 + (bq − 1)), where bq is the log base. In general, if the document at rank i came from the jth reformulation, then sDG@i =
1 DG@i logbq (j + (bq − 1))
Session DCG is then the sum over sDG@i sDCG@k =
mk X i=1
2rel(i)−1 logbq (j + (bq − 1)) logb (i + (b − 1))
with j = b(i − 1)/kc, and m the length of the session. We use bq = 4. This implementation resolves a problem present in the original definition by J¨ arvelin et al. [6] by which documents in top positions of an earlier ranked list are penalized more than documents in later ranked lists. As with the standard definition of DCG, we can also compute an “ideal” score based on an optimal ranking of documents in decreasing order of relevance to the query and then normalize sDCG by that ideal score to obtain nsDCG@k. nsDCG@k essentially assumes a specific browsing path: ranks 1 through k in each subsequent ranked list, thereby
giving a path of length mk. Therefore, we set the cut-offs of our expected session measures to mk (with the exception of AP). For the computation of the expected session measures the parameter pdown is set to 0.8 following the recommendation by Zhang et al. [18]; in expectation, users stop at rank 5. The parameter preform is set arbitrarily to 0.5. With m = 2 reformulations, the probability of a user stopping at the first reformulation is then 67% and moving to the next reformulation 33%, which is not far off the percentage of users reformulating their initial queries in the Excite logs [15].
6.1
Session track collection
The Session track collection consists of a set of 150 twoquery sessions (initial query followed by one reformulation). Out of the 150 sessions, 136 were judged. The judged 136 topics include 47 for which the reformulation involves greater specification of the information need, 42 for which the reformulation involves more generalization, and 47 for which the information need “drifts” slightly. In the case of specification and generalization, both the initial query and its reformulation represent the same information need, while in the case of drifting the two queries in the session represent two different (but related) information needs. Given that some of the proposed session measures make the assumption of a single information need per session—these are the recall-based measures such as AP and recall at cutoff k—we drop the 47 drifting sessions from our experiments. Each participating group submitted runs consisting of three ranked lists of documents: RL1 ranked results for the initial query; RL2 ranked results for the query reformulation independently of the initial query; RL3 ranked results for the query reformulation when the initial query was taken into consideration. Thus, each submission consists of two pairs of runs over the two-query session: RL1→RL2, and RL1→RL3. The document corpus was the ClueWeb09 collection. Judging was based on a shallow depth-10 pool from all submitted ranked lists. Kanoulas et al. detail the collection further [7]. Figure 3 shows example precision-recall surfaces for two submissions, CengageS10R3 [9] and RMITBase [8]. In both cases there is a moderate improvement in performance from the first query to the second. The decrease in precision is rapid in both, but slightly less so in RMITBase. As a result, though CengageS10R3 starts out with higher precisions at lower recalls, the model-free mean sAP s are close: 0.240 and 0.225 respectively. In general, these surfaces, like traditional precision-recall curves, provide a good sense of relative effectiveness differences between systems and where in the ranking they occur. We use the submitted RL1 and RL2 runs (27 submissions in total) to compare the proposed model-based measures with normalized session DCG. nsDCG is computed at cutoff 10. We compute all measures in Section 2 with cut-off 2 · 10 = 20 (to ensure the same number of documents are used). Scatter plots of nsDCG@10 versus expected session nDCG@20 (esnDCG), PC@20 (esPC), RC@20 (esRC), and AP (esAP) are shown in Figure 4. Each point in the plot corresponds to a participant’s RL1→RL2 submission; measures are averaged over 89 topics. The strongest correlation
1.0
1.0
0.8
0.8
0.6
0.6 precision
precision
0.4
0.4
2.0
2.0
1.8
1.8 reform ulation
0.2
reform ulation
0.2
1.6 0.0
1.6 0.0
1.4 0.0 0.2
0.0 0.2
1.2
0.4
reca ll
1.4
reca ll
0.8 1.0
1.2
0.4
0.6 1.0
0.6 0.8 1.0
1.0
Figure 3: Precision-recall surfaces for CengageS10R3 and RMITBase.
0.25
nsDCG vs. esPC
0.10
0.15
esPC
0.15
0.15
0.20
0.10
0.15
0.20
nsDCG
nsDCG
nsDCG vs. esRC
nsDCG vs. esAP
esAP
0.04
0.04
0.06
Kendall''s tau : 0.5247
0.06
0.08
Kendall''s tau : 0.6987
0.08
0.10
0.10
esRC
Kendall''s tau : 0.7334
0.20
Kendall''s tau : 0.7972
0.10
esNDCG
0.20
nsDCG vs. esNDCG
0.10
0.15
0.20
nsDCG
0.10
0.15
0.20
nsDCG
Figure 4: Scatter plots of the mean performance of systems in the Session track for the session RL1→RL2. The x-axis is sNDCG@10; the y-axis is expected session nDCG@20 (esnDCG), PC20 (esPC), RC@20 (esRC), and AP (esAP) for the four plots from left to right and top to bottom. is between esnDCG and snDCG (as expected). Interestingly, esAP strongly disagrees with snDCG; this demonstrates that esAP measures different aspects of system effectiveness over sessions than snDCG. Table 4 shows τ correlations between all the expected measures as well as the model-free sAP; overall the correlations are within the range expected for
these measures with a relatively small number of input systems. They are high relative to random orderings, but low enough that it is clear that all the measures are capturing different aspects of effectiveness. esAP and sAP do not correlate very well, but recall that sAP is based on maximums while esAP is based on averages.
esPC esRC esAP esnDCG
Kendall’s tau correlation esRC esAP esnDCG sAP 0.88 0.79 0.93 0.78 0.80 0.84 0.87 0.72 0.78 0.74
Table 4: Kendall’s tau correlation across the four expected session measures and sAP.
6.2
“good”–“good” “good”–“bad” “bad”–“good” “bad”–“bad”
Average mean session measures esMPC@20 esMRC@20 esMAP 0.378 0.036 0.122 0.363 0.034 0.112 0.271 0.023 0.083 0.254 0.022 0.073
Table 5: esPC@20, esRC@20, and esAP, each averaged over nine Query track systems simulating four session retrieval systems.
Query track collection
The Query track [2] was an effort to understand the systemquery-topic interaction often observed in IR experiments, where certain systems perform well for certain queries but under-perform for others. A set of 50 topics (topics 51-100 from the TREC-1 collection) was provided to participants; they responded with a set of queries for each topic. The constructed queries were in one of the following forms, (a) very short: 2-4 words based on the topic and few relevance judgments; (b) sentences: 1-2 sentences using the topic and few relevant documents; (c) sentences+feedback: 1-2 sentences using only the relevant documents; and (d) weighted terms. Overall 23 query sets were produced, each consisting of 50 queries corresponding to the 50 topics of TREC-1. Participants ran their retrieval systems over each of the query sets and submitted results for each system for each query set. We use subsets of the 23 query sets and the submitted runs to simulate query sessions. The goal of our first experiment is to empirically verify that the proposed measures reward early retrieval of relevant documents in the session. In this experiment we simulate four sets of session retrieval algorithms over 50 two-query sessions. The first simulated algorithm (“good”–“good”) performs well on both the initial query and its reformulation in a hypothetical query session; the second (“good”–“bad”) performs well on the initial query but not on its reformulation, the third (“bad”–“good”) does not perform well on the initial query but does on its reformulation, and the last (“bad”–“bad”) does not perform well on either queries. To simulate these algorithms, we note that the systems participating in the Query track performed particularly well on short queries (with an average MAP of 0.227), while they did not perform well on the sentence-feedback queries (average MAP of 0.146) [2]. Taking this into consideration we simulate the best algorithm using runs over two short formulations of the same query. In particular, the nine runs over the query set named INQ1a with simulated reformulation results from the nine runs over query set INQ1b (with average MAP equal to 0.110 and 0.127 respectively, as computed by trec_eval) simulated a set of systems performing well both over the initial query of a hypothetical session and its reformulation. We simulate the worst system by runs over two sentence-feedback formulations. In particular the runs over query set INQ3a with reformulations being the runs over query set INQ3b (with average MAP 0.078 and 0.072 respectively) simulated a set of systems that performed well neither over the initial nor over the reformulated query. The other two combinations—INQ1a to INQ3b and INQ3a to INQ1b—simulated medium performance systems.6 What we expect to observe in this simulation is that ses6 The query sets INQ1a, INQ1b, INQ3a, INQ3b were manually constructed by students at UMass Amherst [2].
sion measures reward the “good”–“good” simulated systems the most, followed by the “good”–“bad”, the “bad”–“good” and finally the “bad”–“bad” systems. Table 5 shows the average mean session scores produced by three of the expected session measures over the four simulated sets of retrieval algorithms. The results verify the behavior of the proposed measures. This is the exact same behavior we observed for the sAP measure in Table 3. We conclude by testing the accuracy of the Monte Carlo method in computing the expected session measures. We simulated a two-query session by randomly selecting two sets of query formulations and their corresponding runs and forming a session from those. We run our O(nm ) exact algorithm along with the Monte Carlo method. For the latter we use B = 10, B = 100 and B = 1000 trials. The results are illustrated in the left-hand plot in Figure 5, showing the high accuracy of the Monte Carlo simulation even with as few as 10 repetitions. Obviously, the accuracy of the method depends on the length of the session together with the set parameters pdown and preform . We did not test for different parameters, however we did repeat the same process over 3query sessions. The results are illustrated at the right-hand side plot in Figure 5. There is somewhat more variance but even with B = 10 the results are very accurate.
7.
CONCLUSIONS
In this work we considered the problem of evaluating retrieval systems over static query sessions. In our effort to make as few assumptions about user behavior over a session as possible, we proposed two families of measures: a model-free family inspired by interpolated precision, and a model-based family with a simple model of user interaction described by paths through ranked results. With a novel session test collection and a session collection simulated from existing data, we showed that the measure behaviors correspond to our intuitions about their traditional counterparts as well as our intuitions about systems that are able to find more relevant documents for queries earlier in the session. The measures capture different aspects of system performance, and also capture different aspects than what is captured by the primary alternative, snDCG. They are surely other ways to generalize traditional evaluation measures and paradigms to session evaluation than those we have presented. Our goal with this work is to define measures as intuitively as possible while keeping models of user behavior simple. In the future we will want to consider explicit models of when and why users reformulate: is it based on the relevance of the documents they see? Does it depend on how many times they have already reformulated? Are they willing to go deeper down the ranking for a later reformulation than an earlier one?
0.25
0.30
0.35
0.40
0.45
0.50
expected session AP (esAP) -- exact method
++ o x x+ o xo xo + + o x o + x +o x o + + ++ xx xo xo xo o x+ + o xo o x+ o+ x+ +o x + x+ + xo xo + o + xo x xo++ o x+ o + x
0.40
0.45
+ B=10 -- tau=0.896 x B=100 -- tau=0.947 o B=1000 -- tau=0.97
0.35 0.30
0.50 0.45 0.40 0.35 + x o
expected session AP (esAP) -- Monte Carlo
3-query sessions
+ o x x+ o + + o x + x o + x o + B=10 -- tau=0.957 o x+ x+ + o x+ o + o x+ x B=100 -- tau=0.981 + + o x+ o x+ x+ o + o B=1000 -- tau=0.983 + ++ o x +o xxo x+ o x+ xo o + + o x o + x +x + xo x+ o o xo xx+ + o + x++ o x x+ o x+ o + x+ x+ o x+ o o
0.30 0.25
expected session AP (esAP) -- Monte Carlo
2-query sessions
x o +
o + x
+ xo xx+ x o + + x+ oo x ++ xo o o x + +o x + xx o x + o o x + + o x +
0.35
0.40
0.45
expected session AP (esAP) -- exact method
Figure 5: Exact method versus Monte Carlo in the computation of expected session AP (esAP) for B = 10, B = 100 and B = 1000, for 2 and 3 query sessions. There are many cases we have not explicitly considered. “Drifting” information needs, which were part of the TREC 2010 Session track, may require special treatment for evaluation since the set of relevant documents can change as the need drifts. Furthermore, there are many examples of sessions in which a query and its results serve to guide the user in selecting future queries rather than immediately provide relevant documents; while we can apply our measures to these types of sessions, they are clearly not designed to measure a system’s effectiveness at completing them. Deeper understanding of session measures and their relationship to the user experience will come from future work on session test collections, application to “real” sessions in query log data, and extensive experimentation and analysis. We plan to continue all these lines of research in the future.
8.
ACKNOWLEDGMENTS
We gratefully acknowledge the support provided by the European Commission grant FP7-PEOPLE-2009-IIF-254562 and FP7/2007-2013-270082 and by the University of Delaware Research Foundation (UDRF).
9.
REFERENCES
[1] M. J. Bates. The design of browsing and berrypicking techniques for the online search interface. Online review, 13(5):407–431, 1989. [2] C. Buckley and J. A. Walz. The trec-8 query track. In The Eighth Text REtrieval Conference Proceedings (TREC 1999), 1999. [3] C. J. C. Burges, R. Ragno, and Q. V. Le. Learning to rank with nonsmooth cost functions. In B. Sch¨ olkopf, J. C. Platt, T. Hoffman, B. Sch¨ olkopf, J. C. Platt, and T. Hoffman, editors, NIPS, pages 193–200. MIT Press, 2006. [4] C. L. Clarke, M. Kolla, G. V. Cormack, O. Vechtomova, A. Ashkan, S. B¨ uttcher, and I. MacKinnon. Novelty and diversity in information retrieval evaluation. In SIGIR ’08: Proceedings of the 31st annual international ACM SIGIR conference on Research and development in information retrieval, pages 659–666, New York, NY, USA, 2008. ACM. [5] W. S. Cooper. Expected search length: a single measure of retrieval effectiveness based on the weak ordering action of retrieval systems. American Documentation, 19:30–41, 1968.
[6] K. J¨ arvelin, S. L. Price, L. M. L. Delcambre, and M. L. Nielsen. Discounted cumulated gain based evaluation of multiple-query ir sessions. In ECIR, pages 4–15, 2008. [7] E. Kanoulas, B. Carterette, P. Clough, and M. Sanderson. Session track overview. In The Nineteenth Text REtrieval Conference Notebook Proceedings (TREC 2010), December 2010. [8] S. Kharazmi, F. Scholer, and M. Wu. RMIT University at TREC 2010: Session track. In Proceedings of TREC, 2010. [9] B. King and I. Provalov. Cengage learning at the TREC 2010 Session track. In Proceedings of TREC, 2010. [10] A. Moffat and J. Zobel. Rank-biased precision for measurement of retrieval effectiveness. ACM Trans. Inf. Syst., 27(1):1–27, 2008. [11] P. Over. Trec-7 interactive track report. In The Seventh Text REtrieval Conference Proceedings (TREC 1998), pages 33–39, 1998. [12] S. Price, M. L. Nielsen, L. M. L. Delcambre, and P. Vedsted. Semantic components enhance retrieval of domain-specific documents. In M. J. Silva, A. H. F. Laender, R. A. Baeza-Yates, D. L. McGuinness, B. Olstad, Ø. H. Olsen, and A. O. Falc˜ ao, editors, CIKM, pages 429–438. ACM, 2007. [13] S. E. Robertson. The probability ranking principle in IR. Journal of Documentation, 33(4):294–304, 1977. [14] T. Sakai. Alternatives to bpref. In SIGIR ’07: Proceedings of the 30th annual international ACM SIGIR conference on Research and development in information retrieval, pages 71–78, New York, NY, USA, 2007. ACM. [15] D. Wolfram, A. Spink, B. J. Jansen, and T. Saracevic. Vox populi: The public searching of the web. JASIST, 52(12):1073–1074, 2001. [16] Y. Yang and A. Lad. Modeling expected utility of multi-session information distillation. In L. Azzopardi, G. Kazai, S. E. Robertson, S. M. R¨ uger, M. Shokouhi, D. Song, and E. Yilmaz, editors, ICTIR, pages 164–175, 2009. [17] E. Yilmaz and J. A. Aslam. Estimating average precision with incomplete and imperfect judgments. In P. S. Yu, V. Tsotras, E. Fox, and B. Liu, editors, Proceedings of the Fifteenth ACM International Conference on Information and Knowledge Management, pages 102–111. ACM Press, November 2006. [18] Y. Zhang, L. A. Park, and A. Moffat. Click-based evidence for decaying weight distributions in search effectiveness metrics. Inf. Retr., 13:46–69, February 2010.