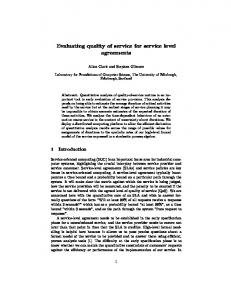
EVALUATING ORIENTATION LEVEL OF SERVICE AT PASSENGER TERMINALS AT MAJOR BRAZILIAN AIRPORTS Giovanna Miceli Ronzani1 Prof. Dr. Anderson Ribeiro Correia Aeronautical Institute of Technology (ITA)
Abstract This paper presents an analysis on the orientation and legibility of internal spaces of some Brazilian airports. The main issue states the fact that most of the users have experienced embarrassing situations whenever moving around an airport and even localizing their destinations in a passenger terminal (TPS). Considering the frequent time restriction, it is noticed that the lack of orientation, and therefore the difficulty of finding their way through, may lead passengers to insecure uncomfortable stressful sensations. The identification of variables that may infer orientation is expected to provide architects and engineers with principles, which should consciously guide them in the sense of the required parameters to design. Therefore, it allows better TPS efficiency in terms of orientation, offering passengers the means of finding their ways as well as identifying their destinations quicker. Moreover, users would be able to read and perceive the space, resulting in a better level of satisfaction for them. Keywords: wayfinding, orientation, level of service, passenger terminals, airports.
1
Authors Contact: 1 Giovanna Miceli Ronzani (
[email protected]) 2 Prof. Dr. Anderson Ribeiro Correia (
[email protected]) ITA/ CTA Praça Marechal Eduardo Gomes 50, Sala: 2137 - Vila das Acácias, Cep: 12.228-900 - São José dos Campos - SP - Brasil.
20 1.
JOURNAL OF THE BRAZILIAN AIR TRANSPORTATION RESEARCH SOCIETY • VOLUME 3 • ISSUE 2 • 2007
INTRODUCTION
2.
LITERATURE REVIEW
One important aspect of a trip nowadays
The design of a terminal should have, among
concerns the ability of the users to find their
other requirements, a setting that encourages
way through large transport terminals, be they
good direction, enabling users to make
air, road, or rail terminals. Minimizing
decisions quickly to achieve their goals.
disorientation and confusion is a difficult task
Wayfinding must be developed in passenger
for the terminal designer because there are
terminal because many passengers have a
often no instruments to help (Braaskma and
restricted time in the terminal, as Dada and
Cook, 1980). In large public spaces that are
Wirasinghe (1999) suggest. In addition, the
outside the range of human’s environmental
airport
perception, the need for projects that aid in
consideration
finding ways has increased significantly
situations, such as fire (Raubal and Egenhofer,
(Dogu and Erkip, 2000).
1998).
The magazine Passenger Terminal World, in
It is essential for a designer to be aware that
different issues, published relevant reports
ease in wayfinding must be a significant
about the importance of orientation for
consideration in the design (Lam et al, 2003).
passengers at airports. The 2001 issue
According to Hart (1985), orientation can be
suggests that the architectural TPS design
defined as a perception of position relative to
should be planned so that passengers can,
the adjacent activity whilst users move
intuitively, know which direction to take to
around, with direction and orientation being
find their destination (Bodouva and Bodouva,
interactive and inseparable aspects that must
2001). The June (2005) issue indicates the
be jointly considered when planning the
layout of the building to facilitate the
movement of people in a building.
operation of the terminal, so that passengers
Weisman (1981) states that one potential
can move quickly and efficiently (Daniels,
factor influencing orientation could be an
2005). As reports an evidence of a traveler, in
individual’s degree of familiarity with a given
the September (2006) issue, when a passenger
environment. Braaskma and Cook (1980)
arrives at an airport, there is a combination of
mention that orientation can be affected by:
anxiety and disorientation, particularly in
lighting, color, density of traffic, and so on.
cases of non-familiarity with the airport
Dada (1997) investigates the effect of
(Osborn, 2006).
variables such as decision points, numbers of
configuration
has
orientation
to in
take
into
emergency
EVALUATING ORIENTATION LEVEL OF SERVICE AT PASSENGER TERMINALS AT MAJOR BRAZILIAN AIRPORTS
21
signs, and change of level. For Schindler and
A total of 83 passengers were interviewed.
Werner (2004) the performance to find a way
The key elements in the survey were the score
and the ability to guide people depend on the
and explanation given by passengers for
geometric relationships of a building.
orientation in that airport, from 1 (terrible) to
3.
5 (excellent). Figure 1 shows that certain
PRELIMINARY ANALYSIS
An initial study was carried out at the São
factors can justifiably be said to interfere in
Paulo/Guarulhos International Airport (SP) to
the orientation of a terminal, depending on the
investigate
towards
passengers’ perception. Significantly, the lack
orientation. The survey was carried out in
of signing was cited 47 times, being identified
August
by over half those interviewed (approximately
passengers’
2006,
using
attitudes
questionnaires
in
domestic and international departure lounges.
56%). Average Score
Notes
5,00
5 4
3,29
3,28
3,17
3,04
2,83
06 times
24 times
06 times
47 times
1
17 times
2
22 times
3
0 Excellent
Complex Building
Lack of Signing
Low Visibility
Too many DP
Level of Change
Justification
Figure 1. Relation between explanations and scores.
The pilot survey allowed a wide-ranging
4.
investigation of passenger attitudes as regards
To
to orientation in an airport. It was noted that
orientation
passengers who already know the terminal,
following steps will be followed: (1) airport
tend to give a better score for orientation. The
selection, (2) selection of analysis activities,
possibility of continuing the research in form
(3) definition of variables, (4) data collection
of interview was aborted, since it is a doubtful
from
approach to identify criteria that really affect
processing.
guidance, and because there is a strong interference of each passenger’s individual characteristics.
METHOD
investigate at
the
factors
passenger
architectural
plans,
influencing
terminals,
and
(5)
the
data
JOURNAL OF THE BRAZILIAN AIR TRANSPORTATION RESEARCH SOCIETY • VOLUME 3 • ISSUE 2 • 2007
22 4.1
movement and that the codes to designate the
Airport selection
Studies will be carried out in ten Brazilian airports, as in Table 1. Note that the airports
airports are as standard ICAO (International Civil Aviation Organization).
of analysis are in descending order of Table 1. Accumulated Operating Traffic (January to December, 2005). Code ICAO - Locale SBSP – São Paulo/ Congonhas International Airport SBGR – São Paulo/ Guarulhos International Airport SBBR – Brasília International Airport SBGL – Rio de Janeiro/ Galeão International Airport SBSV – Salvador International Airport SBRF – Recife International Airport SBCT – Curitiba International Airport SBRJ – Rio de Janeiro/ Santos- Dumont Airport SBFZ – Fortaleza International Airport SBFL – Florianópolis International Airport SBMO – Maceió International Airport
Domestic 17.147.628 7.257.196 9.391.797 6.254.196 4.292.989 3.422.657 3.337.401 3.562.297 2.524.606 1.443.912 740.610
Passengers (unit) * International Total 0 17.147.628 8.577.601 15.834.797 34.772 9.426.569 2.402.943 8.657.139 261.583 4.554.572 181.995 3.604.652 55.678 3.393.079 0 3.562.297 249.634 2.774.240 104.921 1.548.833 24.972 765.582
(*)Passengers – departure and arrival (plus connection, not military) – Source: INFRAERO (2006).
4.2 Analysis Activities Martel and Seneviratne (1991) say that
flow of primary activities through which orientation in the selected airports will be
whatever the configuration of the terminal,
identified. As for Correia (2000), connecting
passengers complete a sequence of primary
passengers for this survey are those reporting
activities in the airport. Figure 2 shows the
at check- in, after the aircraft arrival.
DEPARTURE
Node 1: Access to Terminal (Access and Parking)
Node 2: Check in (Service desks)
Node 3: Departure (Departure Lounges)
CONNECTION
Node 1: Arrival (Baggage claim exit)
Node 2: Check in (Service desks)
Node 3: Departure (Departure Lounges)
Figure 1. Study activities. (Source: The author)
4.3
Selection of analysis activities
The variables selected to conduct the survey
visibility, (9) visibility index and (10) level of service of orientation.
at airports are: (1) change of level, (2)
4.3.1 Change of Level (MN) The existence of different levels can separate,
distance, (3) decision points, (4) type of
for example, the operational activities or
configuration, (5) visual connection, (6) inter-
environments
connection density and the number of links,
(Ashford and Wright, 1992) and has the
(7)
advantage of a better use of the airport site;
dimension,
(8)
elements
reducing
of
arrival
and
departure
however, there may be higher costs for the
EVALUATING ORIENTATION LEVEL OF SERVICE AT PASSENGER TERMINALS AT MAJOR BRAZILIAN AIRPORTS
23
operator besides causing major difficulties for
indicating a higher number of changes of
orientation. As shown in Figure 3, according
level (MN) when a terminal presents a
to the collected data, there is a trend
complex configuration (ICD).
ICD
Parking lot
2,70 2,60
Approach route
2,50
Nation. Connection.
2,40
Intern. Connection
2,30
Linear (Approach route)
2,20
Linear (Parking lot)
2,10
Linear (Nation. Connection.)
2,00 0
1
2
3
Linear (Intern. Connection)
CL
Figure 3. Relationship: number of changes of level (CL) and the complexity of the lay out (ICD).
4.3.2 Distance (Dist) The variable Dist was obtained through the airport project, and this is the most likely route traveled by the user at each of the forms of arrival at the airport. The measurement unit was the meter. 4.3.3 Decision Points (PD) The variable decision points are related to places where passengers have to decide which way to take. It considers the total number of points in the full way traveled by the user. A brief observation made indicates that, for all
the airports of analysis, the number of decision points for a passenger who accesses the terminal through the parking area is always greater than the number of decision points for a passenger who accesses it through the route of arrival, as shown in Figure 4. In most configurations, the parking area is farther away from the main access routes than the passenger discharge area usually planned in front of the passenger buildings (de Neufville and Odoni, 2003).
24
JOURNAL OF THE BRAZILIAN AIR TRANSPORTATION RESEARCH SOCIETY • VOLUME 3 • ISSUE 2 • 2007
Decision points
.
18
Parking lot
16
Approach route
14
National Connection
12
Intern. Connection
10 8 6 4 2
Airports
0 SBGL SBGR SBBR SBSV SBRF SBSP SBCT SBFZ SBMO SBRJ
SBFL
* SBSP e SBRJ: have not international traffic
Figure 4. Relationship: Airports and number of decision points – considering form of access to airport. (Source: The author)
4.3.4 Type of Configuration (Config) According to Hart (1985), there are basically four configurations of passenger buildings. In the "Pier" configurations, the aircraft are stationed in line on both sides of a corridor connection
and,
in
the
"Satellite"
configurations the aircraft are stationed around a structure connected to the terminal, through a corridor (Hart, 1985). A “Linear” building is a long, relatively thin structure with one side devoted to aircraft and the other
are the broad category of rubber-tired vehicles that move passengers between passenger buildings and aircraft (de Neufville and Odoni, 2003). As shown in Table 2, for this work, the variable "type of configuration" will be treated as binary and airports of studies are separated into: (1) linear airports, the value of which is represented by one and (2) non-linear airports, the value of which is represented by zero.
facing roads, parking lots and “Transporters” Table 1. Value of binary variables for each airport (Source: The author). Locale SBSP – São Paulo/ Congonhas International Airport SBGR – São Paulo/ Guarulhos International Airport SBBR – Brasília International Airport SBGL – Rio de Janeiro/ Galeão International Airport SBSV – Salvador International Airport SBRF – Recife International Airport SBCT – Curitiba International Airport SBRJ – Rio de Janeiro/ Santos-Dumont Airport SBFZ – Fortaleza International Airport SBFL – Florianópolis International Airport SBMO – Maceió International Airport
Configuration Linear Pier Satellite Linear Pier Linear Linear Linear Linear Linear Linear
Categories Linear Non- linear Non- linear Linear Non- linear Linear Linear Linear Linear Linear Linear
Binary 1 0 0 1 0 1 1 1 1 1 1
EVALUATING ORIENTATION LEVEL OF SERVICE AT PASSENGER TERMINALS AT MAJOR BRAZILIAN AIRPORTS
4.3.5 Visual Connection (CV) The visual connection is a variable obtained
j seen from i
START
NO
25
cvi j = 0
by a matrix where its elements cij (with i = 1, YES
2, 3, ..., nej = 1, 2, 3, ..., m) are binary
cvi j = 1
variables (zero or one) and indicate whether there is direct visual connection between two
i n e jm
sequential central activities. Figure 5 presents
= 1
a flowchart showing how to complete matrix
YES
(Table 3).
NO
∑∑ c ij = CV
Figure 5. Flowchart for CV matrix (Dada, 1997 - adjusted). Table 3. Visual Connection Matrix (Dada, 1997 - adjusted). Decision Point j1 j2 j3 … jm
i1 1 cv21 cv31 … cvm1
i2 cv12 1 cv32 … cvm2
i3 cv13 cv23 1 … cvm3
… … … … 1 …
in cvln cv2n cv3n … 1
∑ ∑columncvij
∑columncvij
4.3.6 Inter-Connection Density (ICD) and Number of Links (Nlinks) O'Neill (1991 apud Dada 1997) shows an
∑line cvij
=
∑∑linecv ij
= CV
ICD =
Total number of links Total number of decision points
(1)
objective measure called inter-connection
4.3.7 Dimension (Dim) The variable Dim refers to the total size
density (ICD) to measure the complexity of
(square meters) of the passenger terminal and
the layout. ICD is the average number of links
has been incorporated since, among other
or corridors per choice point (decision point).
types of interference, the larger the size, the
Note that the links refer to the number of
more complex the building layout (ICD), as
possible ways that the user has at each
shown in Figure 6.
decision points.
JOURNAL OF THE BRAZILIAN AIR TRANSPORTATION RESEARCH SOCIETY • VOLUME 3 • ISSUE 2 • 2007
Dimension
26
180.000
Parking lot
160.000
Approach route
140.000
National Conn.
120.000
Internat. Conn..
100.000
Linear (Approach route)
80.000
Linear (Parking lot)
60.000 40.000
Linear (National Conn.)
20.000
Linear (Internat. Conn..)
0 1,50
1,70
1,90
2,10
2,30
2,50
2,70
2,90
3,10
ICD
ICD
Figure 6. Relation between dimension (Dim) and Inter-connection Density (ICD). (Source: The author).
4.3.8 Elements Reducing Visibility (kij) As stated by Dada (1997), the kij represents the visual access when the physical variables between positions i and j are considered and it is a factor that can help or hinder arriving at destinations in an environment. When kij has a value of 1, there is a direct visual connection between the two activities centers i and j. When the value of kij approaches 0 (zero), there is no direct visual connection and most
IV =
Ls
(3)
N ( N - 1)
in which: Ls = number lights of sight and N = number of nodes. Tosic and Babic (1984) classify the activities as essential and secondary. The determination of the importance of secondary activities and the visibility index was given by: ∑c w ij ij j IV = ( rij ≠0) ∑r w ij j ij
(4)
wayfinders will find it difficult to get to their
in which: cij = An indicator of visibility
destination. The effect of the loss of visual
relevant and equal to 1 if, and only if, there is
access is expected when related to the change
a visual connection between i and j. The wj =
of level (MN) and the decision points (DP), as
weight of the destination activity and rij is a
the following equation shows:
binary variable that represents the relevance
k ij = e
4.3.9
-( 0.01PD +0.1MN )
(2)
Visibility Index (IV)
of the connection. Dada and Wirasinghe (1999) showed that two variables contribute to delays in wayfinding,
To quantitatively measure orientation inside a building, Braaskma and Cook (1980) used the visibility index (IV):
namely the number of decision points and the number of level changes. The visibility index was modified, incorporating a variable (Kij):
EVALUATING ORIENTATION LEVEL OF SERVICE AT PASSENGER TERMINALS AT MAJOR BRAZILIAN AIRPORTS
IV =
(5)
∑r K w ij ij ij ij
27
implies that all of them have equal weight of importance.
∑r w ij ij j
connection between two activities) or 0 (if
4.3.10 Level of Service (NS) of the Orientation The level of service of an airport can be
not).
measured based on different criteria. Many
Correia (2005) states that the impact of a
organizations and airlines have their level of
deficient orientation system usually takes the
service measurement standards, especially in
form of additional distance to be covered,
terms of quality of service and level of
especially for users unfamiliar with the
comfort. Table 4 shows that, for this survey,
environment. This author suggested the
the level of service will be assessed as to the
creation of the following orientation index
direction and is directly coupled to the values
(OI):
of the visibility index.
in which: Kij = 1 (if there is a direct visual
OI =
Table 4. Visibility Index and Level of Service of
(6)
Real route distance Minimum route distance
Orientation - (Dada, 1997).
For this work, the visibility index used is the model presented by Braaskma and Cook
Level of Service (NS) A
(1980) and adapted by Dada (1997): (7)
Ls IV = 2 N
in which: Ls = number of lines of vision and
B C D E
N = number of central activities or nodes. The use in the present work of the proposals
4.4
Representation Well above average Above average Average Bellow average Well bellow average
Visibility Index (IV) NSA > 0.58 0.46 ≤ NSB ≤ 0.58 0.34 ≤ NSC < 0.46 0.22 ≤ NSD < 0.34 NSE < 0.22
Data collection
index
Data was collected from architectural plans
previously illustrated were discarded, since
and site visits at each airport. The next tables
they incorporate the variable in model w
present data for each airport and the study
which is related to the weight of the
variables in relation to the forms of access to
destination activity. As this work includes
the airport. Note that airports are presented in
only the primary activities of the airport, this
the tables in decreasing order of size (m2).
for
the
visibility
measurement
28
JOURNAL OF THE BRAZILIAN AIR TRANSPORTATION RESEARCH SOCIETY • VOLUME 3 • ISSUE 2 • 2007
Table 5. Data: Samples and Variables - Access: Parking lot Airport SBGL SBGR SBBR SBSV SBRF SBSP SBCT SBFZ SBMO SBRJ SBFL
Dim 280.681 179.790 90.100 69.750 52.000 51.535 45.000 38.500 22.000 19.000 8.703
MN 2 2 2 1 1 3 2 2 1 2 0
Dist 425 550 480 480 445 720 300 335 250 500 290
PD 10 10 12 11 10 17 9 9 8 11 7
Config 1 0 0 0 1 1 1 1 1 1 1
CV 26 28 33 29 28 54 27 23 20 35 17
NLinks 24 26 27 25 22 45 20 19 17 24 13
ICD 2.40 2.60 2.25 2.27 2.20 2.65 2.22 2.11 2.13 2.18 1.86
Kij 0.74 0.74 0.73 0.81 0.82 0.63 0.83 0.75 0.84 0.73 0.93
IV 0.26 0.28 0.23 0.24 0.28 0.19 0.33 0.28 0.31 0.29 0.35
NS D D D D D E D D D D C
Table 6. Data: Samples and Variables – Access: Approach route (Passenger discharge). Airport SBGL SBGR SBBR SBSV SBRF SBSP SBCT SBFZ SBMO SBRJ SBFL
Dim 280.681 179.790 90.100 69.750 52.000 51.535 45.000 38.500 22.000 19.000 8.703
MN 1 1 1 0 0 2 0 1 1 2 0
Dist 385 380 430 375 335 660 250 390 270 480 245
PD 7 6 8 6 6 9 5 8 6 8 5
Config 1 0 0 0 1 1 1 1 1 1 1
CV 19 16 20 12 15 19 13 20 14 24 13
NLinks 17 14 19 14 13 27 11 18 13 18 11
ICD 2.43 2.33 2.38 2.33 2.17 3.00 2.20 2.25 2.17 2.25 2.20
Kij 0.84 0.85 0.84 0.94 0.94 0.83 0.95 0.84 0.85 0.76 0.95
IV 0.39 0.44 0.31 0.33 0.42 0.23 0.52 0.31 0.39 0.38 0.52
NS C C D D C D B D C C B
IV 0.20 0.24 0.23 0.24 0.23 0.15 0.26 0.23 0.28 0.23 0.35
NS E D D D D E D D D D C
Table 7. Data: Samples and Variables – Access: National Connection Airport SBGL SBGR SBBR SBSV SBRF SBSP SBCT SBFZ SBMO SBRJ SBFL
Dim 280.681 179.790 90.100 69.750 52.000 51.535 45.000 38.500 22.000 19.000 8.703
MN 3 3 3 2 2 3 2 2 2 3 0
Dist 690 740 720 715 590 920 320 445 300 700 350
PD 13 10 13 11 11 17 10 12 10 13 7
Config 1 0 0 0 1 1 1 1 1 1 1
CV 33 24 39 29 28 44 26 33 28 39 17
NLinks 33 27 30 27 26 46 23 25 21 28 16
ICD 2.54 2.70 2.31 2.45 2.36 2.71 2.30 2.08 2.10 2.15 2.29
Kij 0.65 0.67 0.65 0.73 0.73 0.63 0.74 0.73 0.74 0.65 0.93
EVALUATING ORIENTATION LEVEL OF SERVICE AT PASSENGER TERMINALS AT MAJOR BRAZILIAN AIRPORTS
29
Table 8. Data: Samples and Variables – Access: International Connection Airport Dim MN Dist PD Config CV NLinks ICD Kij IV 280.681 3 740 15 1 39 37 2.47 0.64 0.17 SBGL 179.790 3 770 11 0 29 29 2.64 0.66 0.24 SBGR 90.100 3 750 14 0 44 31 2.21 0.64 0.22 SBBR 69.750 2 770 13 0 35 29 2.23 0.72 0.21 SBSV 52.000 2 630 12 1 30 28 2.33 0.73 0.21 SBRF SBSP* 45.000 2 340 11 1 31 25 2.27 0.73 0.26 SBCT 38.500 2 510 13 1 39 27 2.08 0.72 0.23 SBFZ 22.000 2 360 12 1 34 28 2.33 0.73 0.24 SBMO SBRJ* 8.703 0 390 9 1 28 20 2.22 0.91 0.35 SBFL * SBSP (Congonhas/ SP) and SBRJ (Santos Dumont/ RJ): have not international traffic.
4.5
Statistical
Method:
Multivariate
NS E D D E E D D D C
transformation of variables observed into new variables to which they are correlated and
Statistical Analysis Once the data were collected, the multivariate statistical analysis method was applied. The method was chosen because it orders and
organized in decreasing order of importance (Moita Neto and Moita, 1998). 5.
IMPLEMENTATION AND ANALYSIS
OF RESULTS
groups the parameters of investigation and also the dependences among them (Coelho, 2004). This method was split into several
5.1
Analysis - Access to Terminal:
Parking and Curbside
techniques, two of which are applied in this
The cluster analysis was applied for each of
research:
the possible forms of arrival at the airports, to
(1) Cluster Analysis: the cluster analysis
generate a cluster diagram to identify those
splits sample elements into groups so that the
airports with similarities, according to the
elements belonging to one cluster are similar
variables chosen. Figure 7 shows the analysis
to
variables
of the similarity between airports, when
measured, and the elements in different
access to the airport is by vehicle in the
clusters are heterogeneous (Mingoti, 2005)
parking lot and approach route.
each
other
regarding
the
and; (2) The Principal Components Analysis: method was used when it was essential to analyze more than two variables (Collins, 1980), where what was required was the
30
JOURNAL OF THE BRAZILIAN AIR TRANSPORTATION RESEARCH SOCIETY • VOLUME 3 • ISSUE 2 • 2007
Dendrogram: Parking lot
Dendrogram: Approach route
Figure 7. Dendrogram. (Form of arrival: Parking lot and Approach route).
With access through the parking lot of the
approach route and boarding gate, the greater
airports, SBCT and SBMO have been taken
distance, the greater number of decision
together since the kind of linear configuration
points and high complexity of the lay out. The
and similarity in the number of decision
airports with more similar characteristics are
points (DP) was shown. The clustering of the
SBCT and SBFL (some similar variables:
SBBR and SBSV occurred because, in spite
distances,
of the difference between the size of the
configuration, visual connection, number of
terminal, both have the configuration "non-
links and visibility index). To verify the
linear"; passengers walk the same distance
analysis conducted by the cluster technique,
between the parking lot to the boarding gate
the data collected was applied to the principal
and the level of service concept for their
components method of analysis, as described
guidance was classified as "D" (below
in Figure 8.
average). With access through the approach route, airport SBSP remains isolated from other groups. This shows the way, between the
decision
points,
type
of
31
Principal Comp.: Parking lot
Principal Comp.: Approach route
EVALUATING ORIENTATION LEVEL OF SERVICE AT PASSENGER TERMINALS AT MAJOR BRAZILIAN AIRPORTS
Figure 8. Chart Principal Components, (Form of arrival: Parking lot and Approach route).
As in the dendrogram of Figure 7, SBSP airport is isolated from the others; SBFL airport is also isolated from the groups because it is a small airport. To complete the entire way between the essential activities, level changing is not necessary, in addition to other characteristics, different from other airports (fewer decision points, lower rate of layout complexity and high visibility).
5.2
Analysis – Form of Access: National
Connection and International Connection On arrival at the airport through connection, it is observed in Figure 9 that SBFL airport is isolated. It is a terminal of smaller size, the distance between activities is also smaller and change of level is unnecessary.
32
JOURNAL OF THE BRAZILIAN AIR TRANSPORTATION RESEARCH SOCIETY • VOLUME 3 • ISSUE 2 • 2007
Dendrogram: International Connection
Dendrogram: National Connection
Figure 9. Dendrogram. (Form of arrival: National Connection and International Connection).
Concerning the arrival at the terminal through
numbers of change of level, decision points,
the international connection, there is a cluster:
and number of links.
SBSV and SBRF airports. In spite of having
The chart “Principal Components”, on arrival
different architectural configurations, they
at
have similar variables such as change of level,
connection, is shown in Figure 10, confirming
decision points, number of links, visibility
that the SBFL airport is distant from the
index, and both airports were ranked at level
others. The SBSP airport is the closest to the
of service "E" for guidance. The SBGL,
SBGL airport, since they have similarities,
SBGR and SBBR airports are the three major
even with distant variables such as distance
airports in Brazil and all have the largest
and layout complexity.
the
terminal
through
the
national
33
Principal Comp.: International Connection
Principal Comp.: National Connection
EVALUATING ORIENTATION LEVEL OF SERVICE AT PASSENGER TERMINALS AT MAJOR BRAZILIAN AIRPORTS
Figure 10. Chart Principal Components. (Form of arrival: National and International Connection).
For international connection, the airport of
the terminal, should be done by the airport
Guarulhos (SBGR) has a more complex
administrators, especially those that have been
layout configuration (ICD) and also greater
classified as low orientation. Other possible
distance regarding the pathway from the
procedures would be to locate properly
aircraft to the new boarding gate. The Galeão
terminal maps, and even explore architectural
airport /RJ (SBGL) has the largest dimension
solutions or different lighting on the way to
of all the airports under analysis and presents
indicate the way forward to the passenger.
the highest number of decision points and
When designing the architecture of an
links and with the lowest visibility index. The
airport, the professional in charge must be
airport in Brasília (SBBR), despite presenting
aware of the zoning of activities within the
more visual connection between the activities,
terminal, balancing the interests of directors,
also presents a large number of decision
airlines and mainly the passengers. When
points.
designing a TPS, at the activities planning and
6.
FINAL CONSIDERATIONS
zoning stage, it is important for the layout of
It is well known that corrective actions after
the building to provide evidence of a
the construction phase, when the building is
sequential footway that the passenger should
already habitable, involve complex solutions
follow. For this reason, it is important to note
and significant costs. However, corrective
that the variables mentioned in this work are
actions like as signaling the decision points of
significant in designing a logical layout of
JOURNAL OF THE BRAZILIAN AIR TRANSPORTATION RESEARCH SOCIETY • VOLUME 3 • ISSUE 2 • 2007
34
activities over an airport, to facilitate the process of finding ways. It is essential that the activities are arranged so as to minimize the distance traveled, number of decision points, changes of level and to broaden the visibility for the sectors. The lack of complexity of layout, with a low number of links at the decision point, makes it easier for the user to choose the correct way. Also, the existence of visual connection favors an increase in the visibility index and, therefore, improves the level of service concerning the guidance offered to the passenger. Integrated access, logical sequence and functionality between primary activities make it easy to find the way, reduce the time to search for activities and, consequently, provide comfort and safety to the passenger. ACKNOWLEDGEMENTS
The authors thank the support granted by the Coordination for the Improvement of Higher Education Personnel (CAPES), the State of São Paulo Research Foundation (FAPESP) and the Brazilian Airport Infrastructure Company (Infraero). REFERENCES ASHFORD, N. and WRIGHT, P.H. Airport Engineering, John Wiley & Sons, 3rd Edition (1992). BODOUVA, C. and BODOUVA, W.N. Customer Satisfaction by Design. Passenger Terminal World – Annual Technology Showcase, pp, 71-73 (2001). BRAAKSMA, J.P. and COOK, W.J. Human Orientation in Transportation Terminals. ASCE Journal of Transportation Engineering, pp 189-203 (1980). COELHO, C.J. Seminário de Análise Multivariada. NPC – Núcleo de Pesquisa em Computação. Universidade Católica de Goiás (2004). Disponível em: < http:// agata,ucg,br/ formulários/NPI/pdf/capítulo1.pdf>
COLLINS, C.C.A.J. Introduction to Multivariate Analysis. Cambridge: University Press (1980). CORREIA, A.R. Evaluation of Level of Service at Airport Passenger Terminals: Individual Components and Overall Perspectives. Doctoral Thesis, University of Calgary (2005). CORREIA, A.R. Uma Avaliação Quantitativa de Configurações de Terminais de Passageiros. Tese de Mestrado, Instituto Tecnológico de Aeronáutica, São José dos Campos (2000). DADA, E. S. and WIRASINGHE, S.C. Development of a New Orientation Index for Airport Terminals. Transportation Research Record 1662, TRB, National Research Council, Washington D.C., pp41-47 (1999). DADA, E.S. Quantitative Measure of Orientation in Airport Terminals. Doctoral Thesis, Department of Civil Engineering, University of Calgary (1997). DANIELS, D. From here to there. Passenger Terminal World, pp 73-75, June (2005). DE NEUFVILLE, R. and ODONI, A. Airport Systems: Planning, Design and Management. New York: McGraw Hill (2003). DOGU, U. and ERKIP, F. Spatial Factors Affecting Wayfinding and Orientation. Environment and Behavior. Vol. 32, No 6, pp 731-755 (2000). HART, W. The Airport Passenger Terminal. New York: John Wiley & Sons, 1st Edition (1985). INFRAERO. Movimentos nos Aeroportos. Disponível em: www.infraero.gov.br. (Acesso em 2006). LAM, W.H.K.; TAM, M.; WONG, S.C. and WIRASINGHE, S.C. Wayfinding in the Passenger Terminal of Hong Kong International Airport. Journal of Air Transport Management, pp 73-81 (2003). MARTEL, N. and SEVERINATNE, P.N. Variables influencing performance of Air Terminal Buildings. Transportation Planning and Technology, Vol. 16, pp 3-28 (1991). MINGOTI, S.A. Análise de dados através de métodos de estatística multivariada: uma abordagem aplicada. Editora UFMG (2005). MOITA NETO, J.M. e MOITA, G.C. Uma Introdução à Análise Exploratória de Dados Multivariados. Química Nova, Vol. 21, No. 4 (1998). O’NEILL, M.J. Evaluation of a Conceptual Model of Architectural Legibility. Environment and Behavior, Vol. 23, pp 259-284 (1991). OSBORN, D. Where to go? Way to go. Passenger Terminal World, pp 80, September (2006). RAUBAL, M. and EGENHOFER, M.J. Comparing the Complexity of Wayfinding Tasks in Built Environments. Environment and Planning B, Vol. 25, No. 6, pp 895-913 (1998). SCHINDLER, L.E. and WERNER, S. The Role of Spatial Reference Frames in Architecture. Environment and Behavior, Vol. 36, No. 4, pp 461-482 (2004). TOSIC, V. and BABIC, O. Quantitative Evaluation of Passenger Terminal Orientation. Journal of Advanced Transportation, Vol. 18, pp 279-295 (1984). WEISMAN, J. Evaluating architectural legibility. Environment and Behavior, Vol. 13, pp 189-204 (1981).