by applying RTJPerf to measure the performance of the RTSJ .... Section 3.3.1 present the results of this test for several Java implementations. 2.2.2 Threads.
Evaluating Real-Time Java Features and Performance for Real-time Embedded Systems Angelo Corsaro, Douglas C. Schmidt Electrical and Computer Engineering Department University of California, Irvine, CA 92697 corsaro, schmidt @ece.uci.edu �
�
Abstract
cally operated with limited memory and used processors with limited capacity, the trend is toward increasing memory and Over 90 percent of all microprocessors are now used for computational power. Moreover, increasingly complex applireal-time and embedded applications, and the behavior of cation software is being developed to control and utilize these many of these applications is constrained by the physical processors. world. Higher-level programming languages and middleware Designing real-time embedded systems that implement their are needed to robustly and productively design, implement, required capabilities, are dependable and predictable, and are compose, integrate, validate, and enforce real-time constraints parsimonious in their use of limited computing resources is along with conventional functional requirements and reusable hard; building them on time and within budget is even harder. components. Moreover, due to global competition for marketshare and enThis paper provides two contributions to the study of pro- gineering talent, companies are now also faced with the probgramming languages and middleware for real-time and em- lem of developing and delivering new products in short time bedded applications. First, we present the empirical results frames. It is therefore essential that the production of real-time from applying the RTJPerf benchmarking suite to evaluate the embedded systems can take advantage of languages, tools, and efficiency and predictability of several implementations of the methods that enable higher software productivity. Real-time Specification for Java (RTSJ). Second, we describe Many real-time embedded systems are still developed in C, the techniques used to develop jRate, which is an open-source and increasingly also in C++. While writing in C/C++ is more ahead-of-time-compiled implementation of RTSJ we are de- productive than assembly code, they are not the most proveloping. Our results indicate that RTSJ implementations are ductive or error-free programming languages. A key source maturing to the point where they can be applied to a variety of of errors in C/C++ is associated with their memory managereal-time embedded applications. ment mechanisms, which require programmers to allocated and deallocate memory manually. Moreover, C++ is a feature rich, complex language that has a steep learning curve, 1 Introduction which makes it hard to find and retain experienced real-time embedded developers trained in this language. Over 90 percent of all microprocessors are now used for emReal-time embedded software should ultimately be synthebedded systems, in which computer processors control physi- sized from high-level specifications expressed with domaincal, chemical, or biological processes or devices in real-time. specific modeling tools [1]. Until those tools mature, however, Examples of such systems include telecommunication net- a considerable amount of real-time embedded software still works (e.g., wireless phone services), tele-medicine (e.g., re- needs to be programmed by software developers. Ideally, these mote surgery), manufacturing process automation (e.g., hot developers should use a programming language that shields rolling mills), and defense applications (e.g., avionics mission them from many accidental complexities, such as type errors, computing systems). Many of these real-time embedded sys- memory management, and steep learning curves. The Java [2] tems use several, hundreds, or even thousands of processors programming language has become an attractive choice for the that interoperate via networks and interconnects. following reasons: Creating high quality software for real-time embedded sysIt has a large and rapidly growing programmer base and tems is a hard problem. Although these systems have historiis taught in many universities. �
�
This work was supported in part by Siemens MED, SAIC, and ATD. �
1
It is simpler than C++, yet programmers experienced in
C++ can learn it easily.
pros and cons of the RTSJ programming model. Several imIt has a virtual machine architecture—the Java Virtual plementations of RTSJ are now available, however, including Machine (JVM)—that allows Java applications to run on the RTSJ Reference Implementation (RI) from TimeSys [4]. In this paper, therefore, we empirically analyze most of the any platform that supports a JVM. RTSJ features and compare the performance of the RTSJ RI It has a powerful, portable standard library that can re- with other popular and emerging real-time Java implementaduce programming time and costs. tions. The remainder of the paper is organized as follows: SecIt offloads many tedious and error-prone programming details, particularly memory management, from develop- tion 2 describes RTJPerf, which is an open-source benchmarking suite we developed to evaluate the performance of ers into the language runtime system. RTSJ implementations; Section 3 presents the results obtained It has desirable language features, such as strong typing, by applying RTJPerf to measure the performance of the RTSJ dynamic class loading, and reflection/introspection. RI and compare/contrast these results with the performance of It defines portable support for concurrency and synchro- JDK 1.4.0 and jRate (which is an ahead-of-time compiled imnization. plementation of RTSJ we are developing); Section 4 compares Its bytecode representation is more compact than native our work with related research; and Section 5 summarizes the code, which can reduce memory usage for embedded sys- results we obtained and outlines how they can be used to improve the support of next-generation implementations of RTSJ tems. for real-time embedded software. Conventional Java implementations are unsuitable for developing real-time embedded systems, however, due to the following problems: 2 Overview of RTJPerf �
�
�
�
�
�
The scheduling of Java threads is purposely underspecified to make it easy to develop JVMs for new platforms. This section presents an overview of the RTJPerf benchThe Java Garbage Collector (GC) has higher execution marking suite. In addition to describing what RTSJ features RTJPerf measures, we summarize the key RTSJ features eligibility that any other Java thread, which means that a thread could experience unbounded preemption latency themselves. �
�
while waiting for the GC to run.
2.1
Java provides coarse-grained control over memory allocation and access, i.e., it allows applications to allocate objects on the heap, but provides no control over the type of memory in which objects are allocated. �
Two quality dimensions should be considered when assessing the effectiveness of the RTSJ as a technology for developing real-time embedded systems:
Due to its interpreted origins, the performance of JVMs historically lagged that of equivalent C/C++ programs by an order of magnitude or more. �
Quality of the RTSJ API, i.e., how consistent, intuitive, and easy is it to write RTSJ programs. If significant accidental complexity is introduced by the RTSJ, it may provide little benefit compared to using C/C++. This quality dimension is clearly independent from any particular RTSJ implementation. �
To address these problems, the Real-time Java Experts Group has defined the Real-Time Specification for Java (RTSJ) [3], which provides the following capabilities: New memory management models that can be used in lieu of garbage collection. �
�
Access to raw physical memory. �
A higher resolution time granularity suitable for real-time systems. �
�
Assessing Real-Time (RT)–JVM Effectiveness
Stronger guarantees on thread semantics when compared to regular Java, i.e., the most eligible runnable thread is always run.
Quality of the RTSJ implementations, i.e., how well do RTSJ implementations perform on critical real-time embedded system metrics, such as event dispatch latency, context switch latency, and memory allocator performance. If the overhead incurred by RTSJ implementations are beyond a certain threshold, it may not matter how easy or intuitive it is to program real-time embedded software since it will not be usable in practice.
Until recently, there was no implementation of the RTSJ, This paper focuses on the latter quality dimension and systemwhich hampered the adoption of Java in real-time embedded atically measures various performance criteria that are critisystems. It also hampered systematic empirical analysis of the cal to real-time embedded applications. To codify these mea2
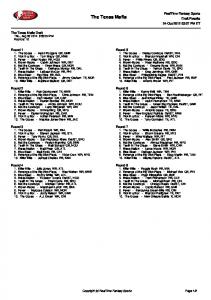
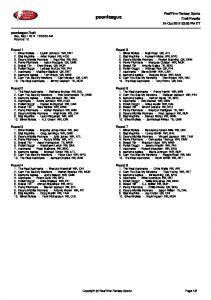
to allocate the ��� � bytes to hold the class instance must be bounded by a polynomial function � ��������� for some constant ����� .2 RTJPerf provides the following test that measures key per2.2 Capabilities of the RTJPerf Benchmarks formance properties of RTSJ memory area implementations. RTJPerf provide benchmarks for most of the RTSJ features Allocation Time Test. To minimize memory leaks, latency, that are critical to real-time embedded systems. Below, we de- and non-determinism, the use of dynamic memory allocation scribe these benchmark tests and reference where we present is forbidden or strongly discouraged in many real-time emthe results of the tests in subsequent sections of this paper. bedded systems. The scoped memory specified by the RTSJ is designed to provide a relatively fast and safe way to allo2.2.1 Memory cate memory that has much of the flexibility of dynamic memory allocation, but much of the efficiency of stack allocation. The RTSJ extends the Java memory model by providing memThe measure of the allocation time and its dependency on the ory areas other than the heap. These memory areas are charsize of the allocated memory is a good measure of the time acterized by the lifetime the objects created in the given memefficiency of the various types of scoped memory implementaory area and/or by their allocation time. Scoped memory artions. eas provide guarantees on allocation time. Each real-time To measure the allocation time and its dependency on the thread is associated with a scope stack that defines its allocasize of the memory allocation request, RTJPerf provides a tion context and the history of the memory areas it has entest that allocates fixed-sized objects repeatedly from a scoped tered. Figure 1 shows how the scope stack for the thread �� �� memory region whose type is specified by a command-line arand evolves while the thread moves from one memory gument. To control the size of the object allocated, the test area to another. As shown in Figure 2, the RTSJ specification allocates an array of bytes. By running this test with different allocation sizes, it is possible to determine the allocation time T1 MA associated with each type of scoped memory. Section 3.3.1 present the results of this test for several Java implementations. surements, we use an open-source1 benchmarking suite called RTJPerf that we are developing.
1
MA1
T1 MA2
MA2
MA1
MA5
T2
MA6
2.2.2 Threads MA6
MA4
MA3
MA7
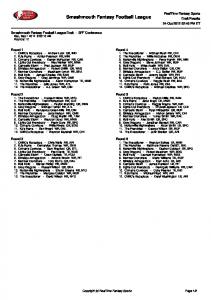
The RTSJ extends the Java threading model with two new types of real-time threads: RealtimeThread and NoHeapRealtimeThread. The relation of these new classes with respect to the regular Java thread class is depicted in Figure 3.
T2 MA7
T1
MA6 MA3 MA2 MA1
«Interface»
Figure 1: Thread Scope Stack in the RTSJ Memory Model.
Thread
provides scoped memories with linear and variable allocation times (LTMemory, LTPhysicalMemory and VTMemory, VTPhysicalMemory, respectively). For linear allocation
Schedulable
RealtimeThread
MemoryArea
NoHeapRealtimeThread
Figure 3: RTSJ Real-time Thread class hierarchy. ImmortalMemory
VTMemory
ScopedMemory
LTMemory
ImmortalPhysicalMemory
LTPhysicalMemory
HeapMemory
Since the NoHeapRealtimeThread can have execution eligibility higher than the garbage collector3 , it cannot allocate nor reference any heap objects. The scheduler controls the
VTPhysicalMemory
Figure 2: Hierarchy of Classes in the RTSJ Memory Model.
2 This bound does not include the time taken by an object’s constructor or a class’s static initializers. 3 The RTSJ v1.0 specification states that the NoHeapRealtimeThread have always execution eligibility higher than the GC, but this has been changed in the v1.01
time scoped memory, the RTSJ requires that the time needed 1 RTJPerf
is freely available at http://tao.doc.wustl.edu/rtj.
3
execution eligibility4 of the instances of this class by using the SchedulingParameters associated with it. RTJPerf provides the following benchmarks that measure important performance parameters associated with threading for real-time embedded systems.
execution period to the next. These test results are reported in Section 3.3.2. Thread Creation Latency Test. The time required to create and start a thread is a metric important to some real-time embedded applications. particularly useful for dynamic realtime embedded systems, such as some telecom call processing applications, that cannot spawn all their threads statically in advance. To assess whether a real-time embedded application can afford to spawn threads dynamically, it is important to know how much time it takes. RTJPerf therefore provides two tests that measure this performance metric. The difference between the tests is that in one case the instances of realtime threads are created and started from a regular Java thread, whereas in the other case the instances are created and started from another real-time thread. The results of this test are reported in Section 3.3.2.
Context Switch Test. High levels of thread context switching overhead can significantly degrade application responsiveness and determinism. Minimizing this overhead is therefore an important goal of any runtime environment for realtime embedded systems. To measure context switching overhead, RTJPerf provides two tests that contains two real-time threads—configurable to be either either RealtimeThread or NoHeapRealtimeThread—which cause a context switch in one of the following ways:
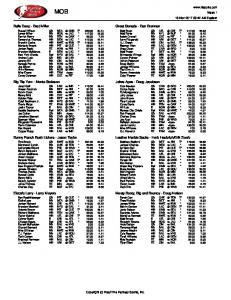
1. Yielding—In this case, there are two real-time threads characterized by the same execution eligibility that yield to each other. Since there are just two real-time threads, whenever one thread yields, the other thread will have the 2.2.3 Asynchrony highest execution eligibility, so it will be chosen to run. 2. Synchronizing—In this case, there are two real-time The RTSJ defines mechanisms to bind the execution of pro� �� � and has higher execution gram logic to the occurrence of internal and/or external threads— �� ��—where � eligibility than . , enters a monitor and then events. In particular, the RTSJ provides a way to associate an � waits on a condition� � that is set by just before it is AsyncEventHandler to some application-specific or exabout to try to enter . After the condition � is notified, ternal events. As shown in Figure 4, there are two types of � � exits the monitor, which allows to enter . The � � «Interface» test measures the time from when exits to when Schedulable enters. This time minus the time needed to enter/leave the monitor represents the context switch time. The results for these tests are presented in Section 3.3.2. Event
0..n
AsyncEventHandler Periodic Thread Test. Real-time embedded systems often AsyncEvent Handler have activities, such as data sampling and control law evalRealtimeThread uation, that must be performed periodically. The RTSJ provides programmatic support for these activities via the ability BoundAsyncEventHandler to schedule the execution of real-time threads periodically. To program this RTSJ feature, an application specifies the proper release parameters and uses the waitForNextPeriod() method to schedule thread execution at the beginning of the Figure 4: RTSJ Asynchronous Event Class Hierarchy. next period (the period of the thread is specified at thread creation time via PeriodicParameters). The accuracy with which successive periodic computation are executed is impor- asynchronous event handlers defined in RTSJ: tant since excessive jitter is detrimental to most real-time sysThe AsyncEventHandler class, which does not tems. have a thread permanently bound to it, nor is it guarRTJPerf provides a test that measures the precision at anteed that there will be a separate thread for each which the periodic execution of real-time thread logic is manAsyncEventHandler. The RTSJ simply requires that aged. This test measures the actual time that elapses from one after an event is fired the execution of all its associated AsyncEventHandlers will be dispatched. 4 �
Execution eligibility is defined as the position of a schedulable entity in a total ordering established by a scheduler over the available entities [5]. The total order depends on the scheduling policy. The only scheduler required by the RTSJ is a priority scheduler, which uses the PriorityParameters to determine the execution eligibility of a Schedulable entity, such as threads or event handlers.
�
4
The BoundAsyncEventHandler class, which has a real-time thread associated with it permanently. An BoundAsyncEventHandler’s real-time thread is used throughout its lifetime to handle event firings.
AsyncEvent
Event handlers can also be specified to be no-heap, which means that the thread used to handle the event must be a NoHeapRealtimeThread. Since event handling mechanisms are commonly used to develop real-time embedded systems [6], a robust and scalable implementation is essential. RTJPerf provide the following tests that measure the performance and scalability of RTSJ event dispatching mechanisms:
Timer
PeriodicTimer
OneShotTimer
Figure 5: RTSJ Timer Class Hierarchy.
Asynchronous Event Handler Dispatch Delay Test. Several performance parameters are associated with asynchronous event handlers. One of the most important is the dispatch latency, which is the time from when an event is fired to when its handler is invoked. Events are often associated with alarms or other critical actions that must be handled within a short time and with high predictability. This RTJPerf test measures the dispatch latency for the different types of asynchronous event handlers prescribed by the RTSJ. The results of this test are reported in Section 3.3.3.
One Shot Timer Test. Different RTSJ timer implementations can trade off complexity and accuracy. RTJPerf therefore provides a test that fires a timer after a given time has elapsed and measures the actual time elapsed. By running this test for different value of , it is possible to determine the resolution at which timers can be used predictably.
Periodic Timer Test. Since periodic timers are often used for audio/video (A/V) playback, it is essential that little jitter Asynchronous Event Handler Priority Inversion Test. If is introduced by the RTSJ timer mechanism since humans are the right data structure is not used to maintain the list sensitive to jitter in A/V streams and tend to be annoyed by it. of event handlers associated with an event, an unbounded A quality RTSJ implementation should therefore provide prepriority inversion can occur during the dispatching of the cise, low-jitter periodic timers. RTJPerf provides a test that event. This test therefore measures the degree of priorand measures the actual elapsed fires a timer with a period ity inversion that occurs when multiple handlers with differtime. By running this test for different values of , it is posent SchedulingParameters are registered for the same sible to determine the resolution at which timers can be used handlers with an event in order event. This test registers predictably. Performances results for these tests are reported of increasing importance. The time between the firing and the in Section 3.3.4 handling of the event is then measured for the highest priority event handler. By comparing the results for this test with the result of the 2.3 Timing Measurements in RTJPerf test described above, we can determine the degree of priority inversion present in the underlying RTSJ event dispatching An issue that arises when conducting benchmarks is which implementation. Section 3.3.3, provides an analysis of the im- timing mechanism to use. To ensure fair measurements— plementation of the current RI and presents an implementation irrespective of the time measurement mechanism provided by an RTSJ implementation—we implement our own native that overcomes some shortcomings of the RI. timers in RTJPerf. In particular, on all Pentium based systems, we use the read-time stamp counter RDTSC 5 instruc2.2.4 Timers tion [7] to obtain timing resolutions that are a function of the Real-time embedded systems often use timers to perform cer- CPU clock period and thus independent of system load. tain actions at a given time in the future, as well as at periodic This technique can also be used in multiprocessor systems future intervals. For example, timers can be used to sample if the OS initializes the RDTSC of different processors to the data, play music, transmit video frames, etc. As shown in Fig- same value. The Linux SMP kernel performs this operation at ure 5, the RTSJ provides two types of timers: boot time, so the initial value of the RDTSC is the same for all the processors. Once the counters are initialized to the same OneShotTimer, which generates an event at the expivalue, they stay in sync since their count increases at the same ration of its associated time interval and pace. PeriodicTimer, which generates events periodically. RTJPerf timer’s implementation relies on the Java Native Interface (JNI) to invoke the platform-dependent mechanism OneShotTimers and PeriodicTimers events are hanthat implements high resolution time. Although different Java dled by AsyncEventHandlers. Since real-time embedded �
�
systems often require predictable and precise timers, RTJPerf provides the following tests that measure the precision of the timers supported by an RTSJ implementation:
5 The RDTSC is a 64 bit counter that can be read with the single x86 assembly instruction RDTSC .
5
RI only when running under TimeSys Linux/RT [8], i.e., the commercial version. Figure 7 shows the structure of the resulting platform. As the figure shows, this is the classical Java approach in which bytecode is interpreted by a JVM that was written for the given host system. The TimeSys RI was designed as a proof of
platforms have different JNI performance, carefully implementing the JNI method can ensure sufficient accuracy of time measurements. The technique we use is shown in Figure 6, where two time measurements written in Java are performed at � � � and , i.e., the RTJPerf timer is started at and stopped � at . The actual time measurement will happen respectively T2
T1
RT−Java Application
D2
D1
RT−JVM
Time
Tb
Ta
Host (x86, PPC, ARMS)
Figure 6: Time Measurement in RTSJ.
���
������ �
�� �
�� ��� �
� �
� �
Figure 7: The Real-time JVM Architecture.
at , and , where and represent the overhead of invoking the native implementation and executing the native call. If the high resolution time im� � ��� � plementation is done in such a way that , and the time taken to return the time measurement to� the Java code is � �� � negligible, we can then assume that . Moreover, we can assume that the timing measurement are largely independent of the underlying JNI implementation.
concept for the RTSJ, rather than as a production JVM. The production-quality TimeSys jTime that will be released later this year should therefore have much better performance.
UCI jRate. jRate is an open-source RTSJ-based extension of the GNU Java Compiler (GCJ) runtime systems that we are developing at the University of California, Irvine (UCI). By relying on GCJ, jRate provides an ahead-of-time compiled platform for the development of RTSJ-compliant applications. 3 Performance Results The research goal of jRate is to explore the use of AspectThis section first describes our real-time Java testbed and Oriented Programming (AOP) [10] techniques to produce a outlines the various Java implementations used for the tests. high-performance, scalable, and predictable RTSJ implemenWe then present and analyze the results obtained running the tation. AOP enables developers to select only the RTSJ aspects they use, thereby reducing the jRate runtime memory RTJPerf test cases discussed in Section 2.2 in our testbed. footprint. The jRate model shown in Figure 8 is different than the 3.1 Overview of the Hardware and Software JVM model depicted in Figure 7 since there is no JVM interTestbed preting Java bytecode. Instead, the Java application is aheadof-time compiled into native code. The Java and RTSJ serThe test results reported in this section were obtained on an vices, such as garbage collection, real-time threads, schedulIntel Pentium III 733 MHz with 256 MB RAM, running Linux ing etc., are accessible via the GCJ and jRate runtime systems, 6 RedHat 7.2 with the TimeSys Linux/RT 3.0 GPL kernel [8]. respectively. One downside of ahead-of-time compiled RTSJ The Java platforms used to test the RTSJ features described in Section 2 are described below: TimeSys RTSJ RI. TimeSys has developed the official RT−Java jRate Application RTSJ Reference Implementation (RI) [4], which is a fully compliant implementation of Java [2, 9] that implements all GCJ Runtime the mandatory features in the RTSJ. The RI is based on a Java 2 Micro Edition (J2ME) JVM and supports an interpreted execution mode i.e., there is no just-in-time (JIT) compilation. Host (x86, PPC, ARMS) Run-time performance was intentionally not optimized since the main goal of the RI was predictable real-time behavior and RTSJ-compliance. The RI runs on all Linux platforms, but Figure 8: The jRate Architecture. the priority inversion control mechanisms are available to the implementations like jRate, however, is that they can hinder 6 This OS is the freely available version of TimeSys Linux/RT and is availportability since applications must be recompiled each time able under the GNU Public License (GPL). they are ported to a new architecture. 6
3.3.1 Memory Benchmark Results
The C Virtual Machine (CVM). CVM [11] is a J2ME platform targeted for embedded and consumer electronic devices. CVM has relatively small footprint and is designed to be portable, RTOS-aware, deterministic, and space-efficient. It has a precise—as opposed to conservative—generational garbage collector.
Below, we present and analyze the results of the allocation time test that was described in Section 2.2.1. Allocation Time Test. This test measures the allocation time for different types of scoped memory. The results we obtained are presented and analyzed below.
JDK 1.4 JVM. Where appropriate, we compare the performance of the real-time Java implementations against the JVM shipped with the Sun’s JDK 1.4, which is the latest version of Java that provides many performance improvements over previous JDK versions. Although JDK 1.4 was clearly not designed for real-time embedded systems, it provides a baseline to measure the real-time Java implementation improvements in predictability and efficiency.
Test Settings. To measure the average allocation time incurred by the RI implementation of LTMemory and VTMemory, we ran the RTJPerf allocation time test for allocation sizes ranging from 32 to 16,384 bytes. Each test samples 1,000 values of the allocation time for the given allocation size. This test also measured the average allocation time of jRate’s CTMemory implementation. Figure 9 shows how jRate’s CTMemory implementation relates to the memory areas defined by the RTSJ, which are depicted in Figure 2. This
3.2 Compiler and Runtime Options MemoryArea
The following options were used when compiling and running the tests for different real-time Java platforms: CVM and JDK 1.4. The Java code for the tests was compiled with jikes [12] using the -O option. These JVM were always run using the -Xverify:none option.
ScopedMemory
TimeSys RTSJ RI. The settings used were the same as the one for CVM and JDK 1.4, additionally the environment variable that controls the size of the immortal memory was set as IMMORTAL SIZE=6000000.
CTMemory
Figure 9: CTMemory class hierarchy.
test only examines jRate and the RI since the other Java platforms do not support scoped memories. We felt that comparing platforms with scoped memory against platform that lack them would be unfair since the latter would perform so poorly Test Results. The data obtained by running the allocation time tests were processed to obtain an average, dispersion, and 3.3 RTJPerf Benchmarking Results worst-case measure of the allocation time. We compute both This section presents the results obtained when running the the average and dispersion indices since they indicate the foltests discussed in Section 2.2 in the testbed described above. lowing information: We analyze the results and explain why the various Java imHow predictable the behavior of an implementation is plementations performed differently.7 How much variation in allocation time can occur and Average and worst-case behavior, along with dispersion inHow the worst-case behavior compares to the averagedices, are provided for all the real-time Java features we meacase and to the case that provides a 99% upper bound.8 sured. The standard deviation indicates the dispersion of the values of features we measured. For certain tests, we provide Figure 10 shows the resulting average allocation time for the sample traces that are representative of all the measured data. different test runs and Figure 11 shows the standard deviaThe measurements performed in the tests reported in this sec- tion of the allocation time measured in the various test settion are based on steady state observations, where the system tings. Figure 12 shows the performance ratio between jRate’s is run to a point at which the transitory behavior effects of cold CTMemory, and the RI LTMemory. This ratio indicates starts are negligible before executing the tests. how many times smaller the CTMemory average allocation time is compared to the average allocation time for the RI 7 Explaining certain behaviors requires inspection of the source code of a LTMemory. 8 UCI jRate. The Java code for the test was compiled with GCJ with the -O flag and statically linked with the GCJ and jRate runtime libraries. The immortal memory size was set to the same value as the RI.
�
�
�
particular JVM feature, which is not always feasible for Java implementations that are not open-source.
By “99% upper bound” we mean that value that represents an upper bound for the measured values in the 99th percentile of the cases.
7
100 80
jRate CTMemory RI LTMemory RI VTMemory
RI LTMemory AAT / jRate CTMemory AAT 80
60
Average Allocation Time Ratio
Average Allocation Time (micro-seconds)
70
95.4
90
50
40
30
70 60 51.5 50 40 30.0
30
20
18.4
20 10
12.5 10
32
1K
2K
4K
8K
16K
0
7.1
7.3
7.4
8.1
32
64
128
256
9.5
512
1K
2K
4K
8K
16K
Chunk Size (Bytes)
Chunk Size (Bytes)
Figure 10: Average Allocation Time.
Figure 12: Speedup of the CTMemory Average Allocation Time Over the LTMemory Average Allocation Time.
8
Allocation Time Standard Deviation (micro-seconds)
4
CTMemory is
2 1 0.5 0.2 0.1 jRate CTMemory RI LTMemory RI VTMemory
0.06 0.03 0.02 32
64
128
256
512
1K
2K
4K
8K
95 times faster RI’s LTMemory.
Dispersion Measures—The standard deviation of the different allocation time cases is shown in Figure 11. This deviation increases with the chunk size allocated for both LTMemory and VTMemory until it reaches 4 Kbytes, where it suddenly drops and then it starts growing again. On Linux, a virtual memory page is exactly 4 Kbytes, but when an array of 4 Kbytes is allocated the actual memory is slightly larger to store freelist management information. In contrast, the CTMemory implementation has the smallest variance and the flattest trend. �
16K
Chunk Size (Bytes)
1
1
0.8
0.8
0.6
0.6
Allocation Time Cumulative Relative Frequency
Figure 11: Allocation Time Standard Deviation. Results Analysis. We now analyze the results of the tests that measured the average- and worst-case allocation times, along with the dispersion for the different test settings: �
Average Measures—As shown in Figure 10, both 32 Bytes 32 Bytes 1 KBytes 64 Bytes 0.4 0.4 LTMemory and VTMemory provide linear time alloca8 KBytes 128 Bytes 256 Bytes tion with respect to the allocated memory size. Match512 Bytes 1 KBytes ing results were found for the other measured statistical 2 KBytes 0.2 0.2 4 KBytes parameter, based on this, we infer that the RI implemen8 KBytes tation of LTMemory and VTMemory are similar, so we 16 KBytes mostly focus on the LTMemory since our results also ap0 0 0.8 1 1.2 16 64 ply to VTMemory. jRate has an average allocation time jRate CTMemory - Alloc. Time (usec) RI LTMemory - Alloc. Time (usec) that is independent of the allocated chunk, which helps Figure 13: Allocation Time Cumulative Relative Frequency analyze the timing of real-time Java code, even without Distribution. knowing the amount of memory that will be needed. Figure 12 shows that for small memory chunks the jRate memory allocator is nearly ten times faster than RI’s The plots in Figure 13 show the cumulative relative freLTMemory. For the biggest chunk we tested, jRate’s quency distribution of the allocation time for some of 8
1.25 128
1.15
Allocation Time (micro-seconds)
Allocation Time (micro-seconds)
1.2
1.1 1.05 Average Allocation Time Max Allocation Time Min Allocation Time 99% Allocation Time
1 0.95
RI LTMemory Avg. Alloc. Time RI LTMemory Max Alloc. Time RI LTMemory Min Alloc. Time RI LTMemory 99% Allocation Time
64
32
16
0.9 8
0.85 0.8 32
64
128
256
512
1K
2K
4K
8K
16K
32
Chunk Size (Bytes)
64
128
256
512
1K
2K
4K
8K
16K
Chunk Size (Bytes)
Figure 14: CTMemory Worst, Best, Average and 99% Allocation Time.
Figure 15: LTMemory Worst, Best, Average and 99% Allocation Time.
Yield Context Switch Test. This test measures the time incurred for a thread context switch. The results we obtained are presented and analyzed below. Test Settings. For each Java platform in our test suite, we collected 1,000 samples of the the context switch time, which we forced by explicitly yielding the CPU. Real-time threads were used for the RI and jRate, whereas regular threads were used for JDK 1.4 and CVM. To avoid GC overhead on platforms that do not support memory areas, we ensured the heap was large enough so that the GC would never be invoked. With Worst-case Measures—Figure 14 and Figure 15 show Sun’s JDK 1.4 JVM, either the option -verbose:gc, or the the bounds on the allocation time for jRate’s CTMemory option -Xloggc: can be used to detect if the and the RI LTMemory. Each of these graphs depicts the garbage collector is run. We used this option to set the value worst, best, and average allocation times, along with the of the heap size to prevent the GC execution during the test. 99% upper bound of the allocation time. Figure 14 ilTest Results. Table 1 reports the average and standard delustrates how the worst-case execution time for jRate’s viation for the measured context switch in the various java CTMemoryis at most 1.4 times larger than its average platforms. execution time.
the different cases discussed above. These graphs illustrate how the allocation time is distributed for different types of memory and different allocation sizes. For any given point on the � axis, the value on the � axis indicates of allocation time for which ������� ��the
� relative ���� frequency � � . This graph, along with Figure 11 that shows the standard deviation, provides insights on how the measured allocation time is dispersed and distributed. �
Average Std. Dev. Max 99% Figure 15 shows how the maximum, average, and the CVM 2.905 � s 0.021 � s 3.181 � s 2.973 � s 99% case, for the RI LTMemory, converge as the size JDK 1.4 3.743 � s 12.633 � s 402.02 � s 3.403 � s jRate 1.301 � s 0.011 � s 1.338 � s 1.325 � s of the allocated chunk increases. The minimum ratio beRI 2.897 � s 0.019 � s 3.064 � s 2.974 � s tween the worst-case allocation time and the average-case C++ 1.30 � s 0.02 � s N/A N/A is 1.6 for a chunk size of 16K. Figure 14, Figure 15 and Figure 13 also characterize the distribution of the allo- Table 1: Yield Context Switch Average, Standard Deviation, cation time. Figure 13 shows how for some allocation Max and 99% Bound. sizes, the allocation time for the RI LTMemory is cenResults Analysis. Below, we analyze the results of the tered around two points. tests that measure the average context switch time, its dispersion, and its worst-case behavior for the different test settings:
3.3.2 Thread Benchmark Results �
Below, we present and analyze the results from the yield and synchronized context switch test, periodic thread test, and thread creation latency test, which were described in Section 2.2.2. 9
Average Measures—Table 1 shows how the RI and CVM perform fairly well in this test, i.e., their context switch time is only 2 � s larger than jRate’s. The main reason for jRate’s better performance stems from its use
Average Std. Dev. Max 99% of ahead-of-time compilation. The last row of Table 1 CVM 1.385 � s 0.017 � s 1.637 � s 1.468 � s reports the results of a C++-based context switch test deJDK 1.4 1.024 � s 0.208 � s 5.352 � s 1.218 � s jRate 0.284 � s 0.005 � s 0.353 � s 0.290 � s scribed in [13]. The table shows how the context switch RI 1.864 � s 0.022 � s 2.062 � s 1.932 � s time measured for the RI and jRate is similar to that for C++ programs on TimeSys Linux/RT. The context Table 3: Monitor Enter time Average, Standard Deviation, switching time for the RI is less than three times larger Max and 99% Bound. than that found for C++, whereas the times for jRate are Average Std. Dev. Max 99% roughly the same as those for C++. CVM 1.294 � s 0.019 � s 1.435 � s 1.352 � s
�
�
�
�
Dispersion Measures—The third column of Table 1 rejRate 0.254 � s 0.006 � s 0.329 � s 0.263 � s RI 1.723 � s 0.386 � s 13.881 � s 1.748 � s ports the standard deviation for the context switch time. Both jRate, the RI, and CVM exhibit tight dispersion Table 4: Monitor Exit time Average, Standard Deviation, Max indexes, indicating that context switch overhead is preand 99% Bound. dictable for these implementations. In general, the context switch time for jRate, the RI and CVM is as preResults Analysis. Below we analyze the results of the test dictable as C++ on our Linux testbed platform. Conthat measure the synchronized context switch time: versely, JDK 1.4 exhibits less predictability, i.e., due to the fact that it is not designed to have real-time behavior. Average Measures—Table 2 illustrates that although jRate has the best aggregate context switch, the RI actuWorst-case Measures—The fourth and fifth column of ally has the best maximum net context switch, with jRate Table 1, represent respectively the maximum and the 99% close behind. Moreover, the RI context switch time is bound for the context switch time. jRate, the RI, and close to the C++ context switch time. CVM have 99% bound and worst-case context switch that JDK 1.4
�
1.632 s
16.858 s
377.22 s
0.972 s
�
�
is close to their average values. The JDK 1.4 worst-case context switch time is very high, though its 99% bound is fairly good, i.e., JDK 1.4 has fairly good context switch time most of the time, but not all the time. Synchronized Context Switch Test. This test measures the context switch time incurred when a higher priority thread � enters a monitor owned by a lower priority thread . The results we obtained are presented and analyzed below. Test Settings. The settings used for this test are the same as the previous one. Test Results. Table 2 shows the aggregate context switch time9 average and standard deviation for the different Java implementations we tested. CVM JDK 1.4 jRate RI C++
�
Average 12.945 s 25.998 s 7.231 s 10.379 s 7.478 s
�
�
�
�
�
Std. Dev. 3.834 s 19.556 s 0.029 s 0.017 s 0.012 s
�
�
�
�
Max 19.278 400.140 7.683 10.537 N/A
�
�
� �
s s s s
�
� �
Table 2: Aggregate Synchronized Context Switch Switch Average, Standard Deviation, Max and 99% Bound. Table 3 and Table 4 report the average, standard deviation, maximum and 99% bound of the time taken to respectively enter and exit a monitor. Table 5 depicts the extrapolated average and worst case of the net context switch, which is obtained by subtracting the minimum monitor enter and exit times from the9 Aggregate aggregatecontext synchronized context switch time. switch time is defined as the time taken to perform the context switch from �� to �� , plus the time taken for the monitor, plus the time taken by � to enter the monitor.
��
to exit the
Worst-case Measures—Both jRate and the RI have maximum and 99% bound values that are close to the average. CVM exhibits good worst-case behavior as well, though not as good as the real-time Java implementations. In contrast, JDK 1.4 has an upper bound for the synchronized context switch test that is far off its average value.
Periodic Thread Test. This test measures the accuracy with which the waitForNextPeriod() method in the RealtimeThread class schedules the thread’s execution periodically. The results we obtained are presented and analyzed below. Test Settings. This test runs a RealtimeThread that does nothing but reschedule its execution for the next period. The actual time between each activation was measured and
�
99% 16.545 s 31.669 s 7.297 s 10.404 s N/A
�
Dispersion Measures—The third column of Table 2 depicts the standard deviation for the aggregate and net context switch. All the real-time Java platforms have low dispersion, which indicates a predictable context switch time. CVM also behaves quite well, while the JDK 1.4 dispersion is substantially higher than the real-time Java dispersions. �
CVM JDK 1.4 jRate RI C++
�
Average 10.266 s 23.342 s 6.693 s 6.792 s 6.917 s
�
�
�
�
Max 16.654 398.60 s 7.151 s 7.137 s N/A
�
�
�
Table 5: Net Synchronized Context Switch Average and Maximum. 10
500 of these measurements were made. We just ran this test on the RI since only it supports this feature. Although jRate is based on the RTSJ it does not yet support periodic threads. Test Results. Table 6 shows average and dispersion values that we measured for this test.
99% bound on the period experienced by the real-time thread. The worst-case behavior is bad, however, only in the case of T=5 ms and T=10 ms. In other cases, the worst-case behavior is close to the average-case behavior and provides a predictable and regular period. Thread Creation Latency Test. This test measures the time Avg. Std. Dev. Max 99% needed to create a thread, which consists of the time to create T=1 ms 0.933 ms 0.147 ms 0.959 ms 0.959 ms T=5 ms 3.949 ms 7.890 ms 19.756 ms 19.739 ms the thread instance itself and the time to start it. As described T=10 ms 9.955 ms 9.527 ms 19.480 ms 19.478 ms in Section 2.2.2, this test exists into two variants. We refer T=30 ms 29.955 ms 0.004 ms 29.963 ms 29.960 ms T=50 ms 49.955 ms 0.004 ms 49.960 ms 49.959 ms to the test that creates and starts a real-time thread from anT=100 ms 99.955 ms 0.004 ms 99.965 ms 99.960 ms other real-time thread as the RT test, as opposed to the test T=300 ms 299.95 ms 0.004 ms 299.96 ms 299.96 ms that creates a real-time thread (or regular for platform that lack T=500 ms 499.96 ms 0.004 ms 499.96 ms 499.96 ms real-time threads) from a regular Java thread. The results we Table 6: Periodic Thread Period Average, Standard Deviation, obtained are presented and analyzed below. Max and 99% Bound. Test Settings. For each java platform in our test suite, we collected 400 samples of the thread creation time and thread Results Analysis. Below we analyze the results of the test start time. Real-time threads were used for the RI and jRate, that measure accuracy with which periodic thread’s logic are whereas regular threads were used for JDK 1.4 and CVM. To activated: avoid garbage collection overhead we ensured the heap was Average Measures—Table 6 shows that for periods � large enough so that the garbage collector would not be in10 ms, the average actual period is close to the nominal voked since we are interested in measuring the time taken to period, which is represented by the values in the first col- create and start a thread, while limiting the effects of other umn. For periods 10 ms, however, the actual value delays. is not always close to the desired or nominal value. To Test Results. Table 7 and Table 8 report the average, understand the reason for this behavior, we inspected the standard deviation, maximum and 99% bound for the thread RI implementation of periodic threads, (i.e., at the im- creation time and thread start time respectively. Figure 16 plementation of waitForNextPeriod()) and found presents the aggregate average, max and 99% bound of the that a JNI method call is used to wait for the next period. thread creation and startup time. Without the source for the RI’s JVM, it is hard to tell Average Std. Dev. Max 99% exactly how the native method is implemented. Our analCVM 70.222 � s 4.233 � s 100.680 � s 92.463 � s JDK 1.4 175.250 � s 92.631 � s 921.970 � s 303.930 � s ysis indicates, however, that the behavior observed for jRate 146.780 � s 8.237 � s 194.410 � s 180.540 � s periods � 10 ms does not result from the use of the jRate RT 18.808 � s 6.958 � s 55.270 � s 42.136 � s RI 234.750 � s 16.977 � s 509.880 � s 276.540 � s nanosleep() system call. This observation is based RI RT 412.380 � s 89.851 � s 582.240 � s 571.710 � s on the output of ptrace (described in Section 3.3.4), which indicated that the RI timer implementation uses Table 7: Thread Creation Time Statistical Indexes. nanosleep(). Similar traces obtained for the tests reported in Tables 13 and 14 indicated that for time � 10 Average Std. Dev. Max 99% CVM 460.670 � s 12.678 � s 528.320 � s 496.669 � s ms the timer results are not consistent with the periodic JDK 1.4 390.450 � s 54.232 � s 771.940 � s 520.720 � s thread results. Based on these results, we conclude that jRate 70.308 � s 6.019 � s 97.906 � s 90.389 � s the implementation of periodic threads uses a different jRate RT 66.012 � s 5.755 � s 99.075 � s 92.627 � s RI 587.240 � s 38.866 � s 694.030 � s 668.450 � s mechanism than nanosleep(). �
RI RT
Dispersion Measures—The third column of Table 6 � shows that for a period � 30 ms, the actual period with which the thread logic is activated is close to the nominal value and is quite predictable, i.e., it has low jitter. In contrast, for periods of 5 and 10 ms the mean is close to the nominal value and the measured values are highly dispersed. Based on the results shown � in Table 6, the RI behaves unpredictably for periods to 10 ms. �
�
Worst-case Measures—The forth and fifth columns of Table 6 show the maximum period experienced and the
�
601.940 s
�
13.770 s
�
647.570 s
�
640.810 s
Table 8: Thread Startup Time Statistical Indexes. Results Analysis. Below, we analyze the results of the tests that measure the average-case, the dispersion, and the worst-case for thread creation time and thread start time. Average Measures—The first column of Table 7 and Table 8 show that jRate has the best average thread creation time and thread start time, and both value are obtained in the RT test case, where a real-time thread creates and starts other real-time threads. Conversely, for the �
11
1800
1694
1600
65
Max Thread Creation Time Max Thread Startup Time 99% Thread Creation Time 99% Thread Startup Time
1204
1200
60
1230 1213
Dispatch Delay (micro-seconds)
1400
Time (micro-seconds)
70
Average Thread Creation Time Average Thread Startup Time
1014
1000
945 825
822
800
600
629 589 531
566
55
jRate BoundAsyncEventHandler jRate AsyncEventHandler RI BoundAsyncEventHandler
50
45
40
400
292 271 217
200
35
154 135 85
30
0
CMV
JDK 1.4
jRate
jRate RT
RI
0
500
1000
RI RT Event Count
Figure 16: Aggregate Thread Creation/Startup.
Figure 17: Dispatch Latency Trend for Successive Event Firing.
other case, i.e., where a non-RT thread creates a real-time thread, CVM provides the best average creation time. The RI has the largest values in both cases, and the JDK 1.4 values are usually close to the RI and to CVM. The RI’s creation time grows linearly in the RT test, which is unusual and may reveal a problem in the RI management of real-time thread resources. Both the JDK 1.4 and the RI exhibit similar average performance, though the RI is fully interpreted whereas the JDK 1.4 is JIT-compiled. CVM has the second best average values. The difference in the thread creation time and thread start time experienced on the various Java platforms may stem from different implementations dividing the amount of work that is performed differently between the two components.
show how jRate, CVM, and the RI have worst case behavior that are much closer to the average and the 99% bound than JDK 1.4.
3.3.3 Asynchrony Benchmark Results Below we present and analyze the results of the asynchronous event handler dispatch delay and asynchronous event handler priority inversion tests, which were described in Section 2.2.3. Asynchronous Event Handler Dispatch Delay Test. This test measures the dispatch latency of the two types of asynchronous event handlers defined in the RTSJ. The results we obtained are presented and analyzed below.
Dispersion Measures—The third column of Table 7 and Table 8 present the standard deviation for thread creation time and thread start time, respectively. CVM has the smallest dispersal of values for the thread creation time, whereas jRate has the smallest dispersal of values for the thread startup time. The RI has always smaller standard deviation than the JDK 1.4.
�
�
Test Settings. To measure the dispatch latency provided by different types of asynchronous event handlers defined by the RTSJ, we ran the test described in Section 2.2.3 with a fire count of 2,000 for both RI and jRate. To ensure that each event firing causes a complete execution cycle, we ran the test in “lockstep mode,” where one thread fires an event and only after the thread that handles the event is done is the event fired The standard deviation associated with the thread cre- again. To avoid the interference of the GC while performing ation time is influenced by the predictability of the the test, the real-time thread that fires and handles the event time the memory allocator takes to provide the memory uses scoped memory as its current memory area. needed to create the thread object. In contrast, the stanTest Results. Figure 17 shows the trend of the dispatch dard deviation of the thread start time depends largely on the OS, whereas the rest of thread start time depends on latency for successive event firings.10 The data obtained by the details of the thread startup method implementation. running the dispatch delay tests were processed to obtain average worst-case and dispersion measure of the dispatch latency. Worst-case Measures—The forth and fifth column of Table 9 and Table 10 shows the results found for jRate and the Table 7 and Table 8 present the maximum and the 99% RI respectively. 10 Since The RI’s AsyncEventHandler trend is completely off the scale, bound for the thread creation time, and the thread startup time, respectively. These tables and Figure 16 clearly it is omitted in this figure and depicted separately in Figure 18. 12
4000
Avg. Std. Dev. Max 99%
RI AsyncEventHandler
Dispatch Delay (micro-seconds)
3500
� � �
�
BoundAsycnEventHandler 56.100 s 0.848 s 70.462 s 56.692 s
�
�
�
3000
Table 10: RI Event Handler’s Dispatch Latency Average, Standard Dev., Max and 99% bound for the Different Settings
2500
2000
tation, which uses an executor [14] thread from a pool of threads to perform the event firing, rather than having a thread permanently bound to the handler.
1500
1000
500
�
0
500
1000
1500
2000
Event Count
Figure 18: AsyncEventHandler Dispatch Latency Trend. Avg. Std. Dev. Max 99%
�
AsycnEventHandler 36.574 s 0.113 s 39.400 s 36.945 s
�
�
�
�
BoundAsycnEventHandler 34.004 s 0.148 s 35.555 s 34.472 s
�
� �
Table 9: jRate Event Handler’s Dispatch Latency Average, Standard Dev., Max and 99% bound for the Different Settings Results Analysis. Below we analyze the results of the tests that measure the average-case and worst-case dispatch latency, as well as its dispersion, for the different test settings:
Dispersion Measures—The results in Table 10, Table 9, Figure 17, and Figure 19 illustrate how jRate’s BoundAsyncEventHandler dispatch latency incurs the least jitter. The dispatch latency value dispersion for the RTSJ RI BoundAsyncEventHandler is also quite good, though its jitter is higher than jRate’s AsyncEventHandler and BoundAsyncEventHandler. The higher jitter in RI may stem from the fact that the RI stores the event handlers in a java.util.Vector. This data structure achieves thread-safety by synchronizing all method that get(), add(), or remove() elements from it, which acquires and releases a lock associated with the vector for each method. 1 jRate BoundAsyncEventHandler jRate AsyncEventHandler RI BoundAsyncEventHandler
0.9
Average Measures—Table 10 illustrates the large average dispatch latency incurred by the RTSJ RI AsyncEventHandler. The results in Figure 18 show how the actual dispatch latency increases as the event count increases. By tracing the memory used when running the test using heap memory, we found that not only did memory usage increased steadily, but even invoking the GC explicitly did not free any memory. These results reveal a problem with how the RI manages the resources associated to threads. The RI’s AsyncEventHandler creates a new thread to handle a new event, and the problem appears to be a memory leak in the underlying RI memory manager associated with threads, rather than a limitation with the model used to handle the events. In contrast, the RI’s BoundAsyncEventHandler performs quite well, i.e., its average dispatch latency is slightly less than twice as large as the average dispatch latency for jRate. Figure 17 and Table 9 show that the average dispatch latency of jRate’s AsyncEventHandler is the same order of magnitude as its BoundAsyncEventHandler. The difference between the two average dispatch latency stems from jRate’s AsyncEventHandler implemen13
Dispatch Delay Cumulative Relative Frequency
�
�
AsycnEventHandler 2373.0 s 909.92 s 3950.8 s 3892.5 s
0.8 0.7 0.6 0.5 0.4 0.3 0.2 0.1 0 30
35
40
45
50
55
60
65
70
Dispatch Delay (micro-seconds)
Figure 19: Cumulative Dispatch Latency Distribution. To avoid this locking overhead, jRate uses a data structure that associates the event handler list with a given event and allows the contents of the data structure to be read without acquiring/releasing a lock. Only modifications to the data structure must be serialized. As a result, jRate’s AsyncEventHandler dispatch latency is relatively predictable, even though the handler has no thread bound to it permanently. The jRate thread pool implementation uses LIFO queues for its executor, i.e.,
the last executor that has completed executing is the first one reused. This technique is often applied in thread pool implementations to leverage cache affinity benefits [15].
0 LP 10 LP 50 LP 100 LP 500 LP 1000 LP
Avg. 33.375 33.154 33.205 33.264 33.632 33.739
�s �s �s �s
�
Std. Dev. 0.124 s 0.134 s 0.161 s 0.147 s 0.180 s 0.199 s
�
�
�
Max 34.877 34.903 36.063 35.959 37.149 37.565
�s �s �s �s
99% 34.116 33.797 33.825 33.851 34.283 34.458
�s �s �s �s
�s � �s �s Worst-case Measures—Table 9 illustrates how s s � � � �s the jRate’s BoundAsyncEventHandler and AsyncEventHandler have worst-case execu- Table 11: jRate’s Average, Standard Deviation, Maximum tion time that is close to its average-case. The and 99% bound of the Dispatch Delay. worst-case dispatch delay provided by the RI’s Avg. Std. Dev. Max 99% BoundAsyncEventHandler is not as good as 0 LP 56.106 � s 0.887 � s 70.462 � s 56.706 � s 10 LP 112.33 � s 1.346 � s 133.90 � s 122.18 � s the one provided by jRate, due to differences in how 50 LP 332.41 � s 2.396 � s 353.17 � s 344.86 � s their event dispatching mechanisms are implemented. 100 LP 609.92 � s 3.410 � s 631.51 � s 624.96 � s The 99% bound differs only on the first decimal digit for 500 LP 2826.4 � s 12.005 � s 2884.0 � s 2862.1 � s 1000 LP 5587.0 � s 23.768 � s 5672.7 � s 5650.3 � s both jRate and the RI (clearly we do not consider the RI’s AsyncEventHandler since no bound can be put Table 12: RI’s Average, Standard Deviation, Maximum and on its behavior). 99% bound of the Dispatch Delay. Asynchronous Event Handler Priority Inversion Test. This test measures how the dispatch latency of an asynAverage Measures—Figure 20 and Tables 11 and 12 chronous event handler is influenced by the presence of illustrate that the average dispatch latency experienced others event handlers, characterized by a lower execution eligiby is essentially constant for jRate, regardless of the bility than . In the ideal case, ’s dispatch latency should be number of low-priority handlers. It grows rapidly, howindependent of , and any delay introduced by the presence ever, as the number of low-priority handlers increase for of other handlers represents some degree of priority inversion. the RI. The RI’s event dispatching priority inversion is The results we obtained are presented and analyzed below. problematic for real-time systems and stems from the fact that its queue of handlers is implemented with a java.util.Vector, which is not ordered by the exTest Settings. This test uses the same settings as the ecution eligibility. In contrast, the priority queues in asynchronous event handler dispatch delay test. Only jRate’s event dispatching are ordered by the execution the BoundAsyncEventHandler performance is meaeligibility of the handlers. sured, however, because the RI’s AsyncEventHandlers are essentially unusable since their dispatch latency grows Execution eligibility is the ordering mechanism used linearly with the number of event handled (see Figthroughout jRate. For example, it is used to achieve total ure 18), which masks any priority inversions. Moreover, ordering of schedulable entities whose QoS are expressed jRate’s AsyncEventHandler performance is similar to its in different ways. This approach is an application of the BoundAsyncEventHandler performance, so the results formalisms presented in [5]. obtained from testing one applies to the other. The current test Dispersion Measures—Figure 21 and Tables 11 and 12 uses the following two types of asynchronous event handlers: illustrate how ’s dispatch latency dispersion grows as The first is identical to the one used in the previous test, the number of low-priority handlers increases in the RI. i.e., it gets a time stamp after the handler is called and The dispatch latency incurred by in the RI therefore measures the dispatch latency. This logic is associated not only grows with the number of low-priority hanwith . dlers, but its variability increases i.e., its predictability decreases. In contrast, jRate’s standard deviation inThe second does nothing and is used for the lower priority creases very little as the low-priority handlers increase. handlers. As mentioned in the discussion of the average measureTest Results. Table 11 and Table 12 report how the avments above, the difference in performance stems from erage, standard deviation, maximum and 99% bound of the the proper choice of priority queue. dispatch delay changes for as the number of low-priority Worst-Case Measures—Tables 11 and 12 illustrate how handlers increase. Figure 20 and Figure 21 provide a graphithe worst-case dispatch delay is largely independent of cal representation for the average and dispersion measures. the number of low-priority handlers for jRate. In contrast, worst-case dispatch delay for the RI increases as the Results Analysis. Below, we analyze the results of the number of low-priority handlers grows. The 99% bound tests that measure average-case and worst-case dispatch lais close to the average for jRate and relatively close for tency, as well as its dispersion, for jRate and the RI. �
�
�
�
�
�
14
this test on the RI since only it supports this feature. Although jRate is based on the RTSJ it does not yet support timers. Test Results. Table 13 shows the average and standard deviation for the actual timeout interval produced by the OneShotTimer.
5587 jRate RI
Average Dispatch Lantency (micro-seconds)
3125
2826
609.9
625 332.4
T=5 ms T=10 ms T=30 ms T=50 ms T=100 ms T=300 ms T=500 ms
112.3
125 56.11 33.4
33.2
33.2
33.3
33.6
10 LPH
50 LPH
100 LPH
500 LPH
33.7
25
0 LPH
Figure 20:
Dispatch Latency Standard Deviation (micro-seconds)
3.41 2.4 1.35 0.888
0.2 0.124
0.134
0.161
0.147
0.18
0.199
500 LPH
1000 LPH
By inspecting the implementation of the RI timer, we found that the time interval after which the timer is fired is generated by having a thread associated with the timer that waits on a dummy Java object for the specified amount of time. The resolution of timer is therefore essentially the same as the one provided by the Object.wait(long msec, int nsec) method in the RI implementation. By using ptrace we traced the system call made by the RI when the Object.wait(long msec, int nsec) method in invoked. We found that nanosleep() is used to implement this method. The result shown on Table 13 are also consistent with the resolution provided by nanosleep() on the tested platform.
0.04 0 LPH
Figure 21:
10 LPH
50 LPH
100 LPH
99% 19.830 ms 19.830 ms 39.828 ms 59.829 ms 109.83 ms 309.92 ms 509.92 ms
Average Measures—The second column of Table 13 reports the average value of the time interval after which the OneShotTimer generates an event, while the first column represents the desired time interval. As shown in Section 3.3.2’s analysis of the periodic thread test results, the average firing interval performs poorly for time intervals 10 ms. Conversely, for time interval � 10 ms, the results in Table 13 show a strange, yet consistent behavior, where the average time interval generated by the timer is exactly equal to the desired one plus 9.82 ms. �
12
5
1
Max 19.903 ms 19.901 ms 39.930 ms 59.925 ms 109.94 ms 309.93 ms 509.92 ms
Results Analysis. Below we analyze the results of the test that measures the accuracy with which OneShotTimer fire their events with respect to the requested interval:
23.8 jRate RI
Std. Dev. 0.07 ms 0.007 ms 0.013 ms 0.02 ms 0.07 ms 0.067 ms 0.036 ms
Table 13: Aperiodic Timer Results.
1000 LPH
’s Average Dispatch Latency.
25
Avg. 19.818 ms 19.820 ms 39.819 ms 59.814 ms 109.81 ms 309.81 ms 509.81 ms
Dispatch Latency’s Standard Deviation.
the RI.
3.3.4 Timer Benchmark Results Below, we present and analyze the results from the one shot and periodic timer tests, which were described in Section 2.2.4. One Shot Timer Test. This test measures how precisely a OneShotTimer can fire events, relative to the time interval for which it was programmed. Test Settings. The test ran a OneShotTimer that generated an event for time intervals ranging from 5 ms to 500 ms. The event was handled by a BoundAsyncEventHandler that was registered as the timer timeout handler. For each timeout interval we collected 500 samples. The time interval was specified by using RelativeTime. We also tried using AbsoluteTime, but it behaved so similarly that we only present the RelativeTime results for brevity. We just ran 15
�
Dispersion Measures—The third column of Table 13 shows the standard deviation of the measured time intervals generated by the firing of the timer. The standard deviation is small, which indicates that the generated interval is quite predictable. These results are inconsistent with the periodic thread results (see Table 6 in Section 3.3.2), where the standard deviation was quite large � for periods 10 ms. This difference in the dispersion � of the value for periods 10 ms is ascribable to the different mechanism by periodic threads and timers.
Worst-case Measures—The forth and fifth columns of Table 14 show the maximum period experienced and the 99% bound on the period experienced by the real-time thread. Both of these values are close to the average behavior, which demonstrates good worst-case behavior. �
viation is small, which indicates the generated intervals are highly predictable. This result is also inconsistent with the periodic thread behavior shown in see Table 6 in Section 3.3.2, where the standard deviation � was large when the period was 10 ms. Moreover, for most of the cases reported in Table 6, the standard deviation is slightly smaller than the corresponding OneShotTimer case shown in Table 13. This small difference can be ascribed to the fact that one shot timers must be restarted each time they fire.
Periodic Timer Test. This test measures how precisely a PeriodicTimer can fire events, relative to the period for which it was programmed. Test Settings. The settings used for this test were the same as for the previous test. Test Results. Table 14 shows the average-case, worstcast, and the standard deviation for the actual period produced by the PeriodicTimer. T=5 ms T=10 ms T=30 ms T=50 ms T=100 ms T=300 ms T=500 ms
Avg. 19.953 ms 19.955 ms 39.954 ms 59.955 ms 109.95 ms 309.95 ms 509.95 ms
Std. Dev. 0.004 ms 0.010 ms 0.01 ms 0.010 ms 0.015 ms 0.024 ms 0.028 ms
Max 19.968 ms 20.083 ms 40.068 ms 60.069 ms 110.08 ms 310.06 ms 510.06 ms
99% 19.961 ms 19.962 ms 39.965 ms 59.963 ms 109.97 ms 310.06 ms 510.06 ms
Worst-case Measures—The forth and fifth columns of Table 14 show the maximum period experienced and the 99% bound on the period experienced by the real-time thread. Both of these values are close to the average behavior, which demonstrates good worst-case behavior. �
4
Table 14: Periodic Timer Results. Results Analysis. Below we analyze the results of the test that measures the accuracy with which a PeriodicTimer fires events with respect to the requested period:
Related Work
Although the RTSJ was adopted fairly recently [3], there are already a number of research projects related to our work on jRate and RTJPerf. The following projects are particularly interesting: The FLEX [16] provides a Java compiler written in Java, along with an advanced code analysis framework. FLEX generates native code for StrongARM or MIPS processors, and can also generate C code. It uses advanced analysis techniques to automatically detect the portions of a Java application that can take advantage of certain realtime Java features, such as memory areas or real-time threads.
�
Average Measures—The second column of Table 14 reports the average value of the period at which the PeriodicTimer generate events, while the first column represents the desired period. For time intervals 10 ms, the average firing interval is much worse than the desired one, which is consistent with the periodic thread test results in Section 3.3.2. In contrast, for time intervals � 10 ms, the results in Table 13 show a strange, yet consistent behavior, where the average time interval generated by the timer is exactly equal to the desired one plus 9.6 ms. This behavior is consistent with the OneShotTimer results.
�
The OVM [17] project is developing an open-source JVM framework for research on the RTSJ and programming languages. The OVM virtual machine is written entirely in Java and its architecture emphasizes customizability and pluggable components. Its implementation strives to maintain a balance between performance and flexibility, allowing users to customize the implementation of operations such as message dispatch, synchronization, field access, and speed. OVM allows dynamic updates of the implementation of instructions on a running VM. �
�
The implementation of periodic timers is the same as the one shot timers, so that same observation made earlier for one shot timers applies to periodic timers. The difference that we have found with respect to the periodic thread behavior relies on the different implementation. In fact, the waitForNextPeriod() implementation relies on a native method call to wait a period. Without access to the RI JVM source code, however, we cannot exactly say how it is implemented and why there is such a difference in the behavior of the two. Dispersion Measures—The third column of Table 14 shows the standard deviation of the measured time intervals generated by firing the timer. The standard de-
Work on real-time storage allocation and collection [18] is being conducted at Washington University, St. Louis. The main goal of this effort is to develop new algorithms and architectures for memory allocation and garbage collection that provide worst-case execution bounds suitable for real-time embedded systems. �
�
16
The Real-Time Java for Embedded Systems (RTJES) program [19] is working to mature and demonstrate realtime Java technology. A key objective of the RTJES pro-
We also plan to run the RTJPerf benchmarks on the commercial TimeSys Linux/RT. This version provides many features that are lacking in the GPL version of the TimeSys Linux/RT, such as higher resolution timer, support for priority inversion control via priority inheritance and priority ceiling protocols, and resource reservation.
gram is to assess important real-time capabilities of realtime Java technology via a comprehensive benchmarking effort. This effort is examining the applicability of real-time Java within the context of real-time embedded system requirements derived from Boeing’s Bold Stroke avionics mission computing architecture [20]. �
RTJPerf test’s are based on synthetic workload, which is a time-honored way of isolating key factors that affect performance. One area of future work is therefore to add tests based on representative operational real-time embedded applications. Our first target platform is Boeing Bold Stroke [20], which is a framework for avionics mission computing applications. We are collaborating with researchers from Boeing and the AFRL Real-Time Java for Embedded Systems (RTJES) program [19] to define a comprehensive benchmarking suite for RTSJ-based realtime Java platforms. �
There are several ways in which we plan to leverage our work on jRate and the work being done in the FLEX, OVM, and real-time allocator projects outlined above. For instance, the jRate RTSJ library implementation could become the library used by the OVM. This is possible because jRate has been designed to port easily from one Java platform to another. jRate could be used as the RTSJ library on which FLEX relies. Likewise, the work on real-time allocators and garbage collectors could be to implement jRate’s scoped memory with different characteristics than its current CTMemory design.
RTJPerf currently focuses on measuring time efficiency. Clearly, however, measuring memory efficiency and predictability under heavy workloads and contention is also This paper presented an empirical evaluation of the perforcritical for real-time embedded systems. We are workmance of RTSJ features that are crucial to the development of ing with the Boeing Bold Stroke researchers and the RTreal-time embedded applications. RTJPerf is one of the first JES team at AFRL to provide a comprehensive series of open-source benchmarking suites designed to evaluate RTSJbenchmarks test that quantify many QoS properties of compliant Java implementations empirically. We believe it is RTSJ-compliant implementations. important to have an open benchmarking suite to measure the Although jRate implements many core RTSJ features, the quality of service of RTSJ implementations. RTJPerf not only following omissions will be addressed in our future work: helps guide application developers to select RTSJ features that Add support for the remaining RTSJ features, such as are suited to their requirements, but also helps developers of timers, POSIX signal handling, periodic and no-heap RTSJ implementations evaluate and improve the performance real-time threads, and physical memory access. Some of their products. feature that we don’t plan to implement in the first reThis paper applies RTJPerf to measure the performance of lease of jRate is the memory reference checking, and the RTSJ RI, jRate, CVM, and JDK 1.4. Although much work the Asynchronous transfer control. Since jRate will be remains to ensure predictable and efficient performance under the primary Real-Time Java platform used by ZEN [21], heavy workloads and high contention, our test results indicate jRate’s implementation is being driven by the features that real-time Java is maturing to the point where it can be that are most important for real-time ORBs. applied to certain types of real-time applications. In particuProvide a user-level scheduling framework that leverages lar, the performance and predictability of jRate is approachthe simple priority-based scheduling provided by the uning C++ for some tests. The TimeSys RTSJ RI also performed derlying real-time operating systems to provide advanced relatively well in many aspects, though it has several problems scheduling services. with AsyncEventHandler dispatching delays and priority inversion. While CVM is not an RTSJ-compliant implementaCompletely partition the Java and C++ parts of jRate into tion, it performed well for many tests. sets of aspects that can be woven together at compile-time Our future work on RTJPerf is outlined below: to configure custom real-time Java implementations that are tailored for specific application needs. Since the TimeSys RI does not provide a Just In Time �
5 Concluding Remarks
�
�
�
�
(JIT) compiler, its not surprising that its overall performance is lower than the ahead-of-time compiled jRate approach. We look forward to measuring the performance of the TimeSys jTime product that will be released later this year, which should have much better performance. 17
�
Provide a meta-object protocol as one of the aspects to support both computational and structural reflection. Reflection is useful for real-time applications that must manage resources dynamically. Moreover, it enables developers to customize the behavior of jRate’s implementation at run-time.
By using AOP tools, such as AspectJ [22] and AspectC++ [23], we are decomposing jRate’s into a series of aspects that can be configured by developers. The first public version of jRate will be released by the end of June, 2002. Information on its current status and availability can be found at http://tao.doc.wustl.edu/ ˜corsaro/jRate. Since jRate is an open-source project, we encourage researchers and developers to provide us feedback and help improve its quality and capabilities. jRate will use the same open-source model we use for ACE [24] and TAO [25], which has proved to be successful to produce highquality open-source middleware.
Acknowledgments We would like to thank Ron Cytron, Peter Dibble, David Holmes, Doug Lea, Doug Locke, Carlos O’Ryan, John Regehr, and Gautam Thaker for their constructive suggestions that helped to improve earlier drafts of this paper.
References [1] J. Sztipanovits and G. Karsai, “Model-Integrated Computing,” IEEE Computer, vol. 30, pp. 110–112, April 1997. [2] K. Arnold, J. Gosling, and D. Holmes, The Java Programming Language. Boston: Addison-Wesley, 2000. [3] Bollella, Gosling, Brosgol, Dibble, Furr, Hardin, and Turnbull, The Real-Time Specification for Java. Addison-Wesley, 2000. [4] TimeSys, “Real-Time Specification for Java Reference Implementation.” www.timesys.com/rtj, 2001. [5] A. Corsaro, D. C. Schmidt, R. K. Cytron, and C. Gill, “Formalizing Meta-Programming Techniques to Reconcile Heterogeneous Scheduling Disciplines in Open Distributed Real-Time Systems,” in Proceedings of the 3rd International Symposium on Distributed Objects and Applications., (Rome, Italy), pp. 289–299, OMG, September 2001. [6] T. H. Harrison, D. L. Levine, and D. C. Schmidt, “The Design and Performance of a Real-time CORBA Event Service,” in Proceedings of OOPSLA ’97, (Atlanta, GA), pp. 184–199, ACM, October 1997. [7] I. Coorporation, “Using the RDTSC Instruction for Performance Monitoring,” tech. rep., Intel Coorporation, 1997. [8] TimeSys, “TimeSys Linux/RT 3.0.” www.timesys.com, 2001. [9] J. Gosling, B. Joy, and G. Steele, The Java Programming Language Specification. Reading, Massachusetts: Addison-Wesley, 1996. [10] G. Kiczales, J. Lamping, A. Mendhekar, C. Maeda, C. V. Lopes, J.-M. Loingtier, and J. Irwin, “Aspect-Oriented Programming,” in Proceedings of the 11th European Conference on Object-Oriented Programming, June 1997. [11] Sun, “The C Virtual Machine (CVM).” http://java.sun.com/products/cdc/cvm/, 2001.
[12] IBM, “Jikes 1.14.” http://www.research.ibm.com/jikes/, 2001. [13] D. C. Schmidt, M. Deshpande, and C. O’Ryan, “Operating System Performance in � Support of Real-time Middleware,” in Proceedings of the �� Workshop on Object-oriented Real-time Dependable Systems, (San Diego, CA), IEEE, Jan. 2002. [14] D. Lea, Concurrent Java: Design Principles and Patterns, Second Edition. Reading, Massachusetts: Addison-Wesley, 1999. [15] J. D. Salehi, J. F. Kurose, and D. Towsley, “The Effectiveness of Affinity-Based Scheduling in Multiprocessor Networking,” in IEEE INFOCOM, (San Francisco, USA), IEEE Computer Society Press, Mar. 1996. [16] M.Rinard et.al., “FLEX Compiler Infrastructure.” http: //www.flex-compiler.lcs.mit.edu/Harpoon/, 2002. [17] OVM/Consortium, “OVM An Open RTSJ Compliant JVM.” http://www.ovmj.org/, 2002. [18] S. M. Donahue, M. P. Hampton, M. Deters, J. M. Nye, R. K. Cytron, and K. M. Kavi, “Storage allocation for real-time, embedded systems,” in Embedded Software: Proceedings of the First International Workshop (T. A. Henzinger and C. M. Kirsch, eds.), pp. 131–147, Springer Verlag, 2001. [19] Jason Lawson, “Real-Time Java for Embedded Systems (RTJES).” http://www.opengroup.org/rtforum/ jan2002/slides/java/lawson.pdf, 2001. [20] D. C. Sharp, “Reducing Avionics Software Cost Through Component Based Product Line Development,” in Proceedings of the 10th Annual Software Technology Conference, Apr. 1998. [21] R. Klefstad, D. C. Schmidt, and C. O’Ryan, “The Design of a Real-time CORBA ORB using Real-time Java,” in Proceedings of the International Symposium on Object-Oriented Real-time Distributed Computing, IEEE, Apr. 2002. [22] The AspectJ Organization, “Aspect-Oriented Programming for Java.” www.aspectj.org, 2001. [23] The AspectC++ Organization, “Aspect-Oriented Programming for C++.” www.aspectc.org, 2001. [24] D. C. Schmidt, “The ADAPTIVE Communication Environment (ACE).” www.cs.wustl.edu/ � schmidt/ACE.html, 1997. [25] Center for Distributed Object Computing, “The ACE ORB (TAO).” www.cs.wustl.edu/ � schmidt/TAO.html, Washington University.
18