Accepted for the 14th EG-ICE workshop in Maribor, Slovenia (2007)
EVALUATING RELIABILITY OF MULTIPLE-MODEL SYSTEM IDENTIFICATION Suraj Ravindran1, Prakash Kripakaran2 and Ian F.C. Smith3
ABSTRACT This paper builds upon previous work by providing a statistical basis for multiplemodel system identification. Multiple model system identification is useful because many models representing different sets of modeling assumptions may fit the measurements. The presence of errors in modeling and measurement increases the number of possible models. Modeling error depends on inaccuracies in (i) the numerical model, (ii) parameter values (constants) and (iii) boundary conditions. Onsite measurement errors are dependent on the sensor type and installation conditions. Understanding errors is essential for generating the set of candidate models that predict measurement data. Previous work assumed an upper bound for absolute values of composite errors. In this paper, both modeling and measurement errors are characterized as random variables that follow probability distributions. Given error distributions, a new method to evaluate the reliability of identification is proposed. The new method defines thresholds at each measurement location. The threshold value pairs at measurement locations are dependent on the required reliability, characteristics of sensors used and modeling errors. A model is classified as a candidate model if the difference between prediction and measurement at each location is between the designated threshold values. A timber beam simulation is used as example to illustrate the new methodology. Generation of candidate models using the new objective function is demonstrated. Results show that the proposed methodology allows engineers to statistically evaluate the performance of system identification.
Keywords: System identification, multiple models, error characterization, reliability, measurements, model prediction
1
Grad. Res. Assist., IMAC, Struct. Eng. Inst., Station 18, Ecole Polytechnique Fédérale de Lausanne (EPFL), CH-1015 Lausanne, Switzerland,
[email protected]
2
Post Doc. Res., IMAC, Struct. Eng. Inst., Station 18, Ecole Polytechnique Fédérale de Lausanne (EPFL), CH-1015 Lausanne, Switzerland,
[email protected]
3
Prof., IMAC, Struct. Eng. Inst., Station 18, Ecole Polytechnique Fédérale de Lausanne (EPFL), CH-1015 Lausanne, Switzerland,
[email protected]
1
Accepted for the 14th EG-ICE workshop in Maribor, Slovenia (2007)
1
INTRODUCTION
System identification involves determining the state of a system and values of system parameters through comparisons of predictions with observed responses (Ljung, 1999). When applied to structural engineering, this is equivalent to finding the parameter values for models that may represent the behavior of a given structure. Conventional system identification strategies, such as model updating, use optimization methods with measured data to calibrate a mathematical model of a structure that is often based on the model used for design. Model updating in structural engineering may be performed using vibration measurements or using static responses. Friswell and Mottershead (1995) provide a survey of model updating procedures using vibration measurements. Recent papers published in this area include Jaishi and Ren (2005), Xia and Brownjohn (2004), Brownjohn et al (2003) and Koh et al (2003). Compared with the amount of research in dynamic systems, only a few workers have focused on static systems. Research into model updating using static measurements include work by Sanayei et al (2005), Banan et al. (2004a, 2004b) and Sanayei et al. (1999). Although conservative design models result in safe and serviceable structures, they are usually not appropriate for interpreting measurements from structures in service (Smith et al., 2006). Moreover, since system identification is an intrinsically abductive task, there may be many models that fit observed measurements (RobertNicoud et al., 2005a, 2005c). A multiple model approach to system identification in which each model represents different sets of assumptions is capable of incorporating large numbers of modeling possibilities. Errors play a major role in the system identification process. Errors from different sources may compensate each other such that predictions of bad models match measurements (Robert-Nicoud et al., 2005a; Mahadevan and Rebba, 2006). Modeling and measurement errors have been investigated in previous research. Banan et al. (1994b) stated that the selection of an appropriate model is difficult; it is problemdependent, and usually requires the intuition and judgment of an expert in modeling. For example, mathematical models may not be able to exactly capture variations in cross-sectional properties, existing deformations, residual stresses, stress concentrations and variations in connection stiffness. Sanayei et al. (1997) and Arya and Sanayei (1999) emphasized that errors in parameter estimates may arise from many sources, the most significant of which are measurement errors and modeling errors. Measurement errors can result from equipment as well as on-site installation faults (Sanayei et al., 1997). A statistical evaluation of the performance of a system identification methodology must account for modeling and measurement errors. Raphael and Smith (1998) introduced the strategy of generation and iterative filtering of candidate multiple models. Robert-Nicoud et al. (2005a) adopted this strategy and proposed a multiple-model identification methodology based on compositional modeling and stochastic global search. Stochastic search was used to generate a set of candidate models. The objective function for the search was defined to be the rootmean-square of the difference between measured values and model predictions 2
Accepted for the 14th EG-ICE workshop in Maribor, Slovenia (2007)
(RMSE). When the RMSE value was less than a certain threshold value, the model was classified as a candidate model. The threshold was evaluated by assuming reasonable values for modeling and measurement errors through reference to previous studies in finite element analysis and sensor precision. A model involving the right set of assumptions and correct values of parameters has a cost function value that is less than or equal to this threshold when errors due to mathematical modeling and measurement are equal to estimated maximum values. A limitation of this study is that the threshold value is not qualitatively associated with the reliability of identification. In this paper, a novel method of evaluating candidate models that accounts for the reliability of identification is proposed. Random variables are introduced for the errors in modeling and measurements. A new objective function is introduced for the stochastic search. The new form of the function uses threshold values at each measurement location. These threshold values are determined through reference to the required reliability of identification and probability distributions of errors. These methods are illustrated for a timber beam. The paper describes the methodology of generating candidate models, followed by a section that treats errors in system identification and the formulation of a new objective function and concludes with the results and suggestions for future work. 2
METHODOLOGY
The framework of multiple-model system identification research at EPFL is shown in Figure 1. At the beginning, modeling hypotheses lead to a number of possible models using measurements from the structure. The model generation module compares measurements with predictions to identify a set of candidate models. A stochastic global search algorithm called PGSL (Raphael and Smith, 2003b) is used for optimization. A feature extraction module extracts characteristics of these models.
Figure 1: Framework of multiple-model system identification research at EPFL (ongoing work highlighted) 3
Accepted for the 14th EG-ICE workshop in Maribor, Slovenia (2007)
Data mining techniques are used to cluster models (Saitta et al., 2005). Ongoing research includes error estimation for better system identification, improving the measurement system design and developing appropriate engineer-computer interaction. The highlighted areas are focal points of current research. The methodology used to generate a set of candidate models is illustrated in Figure 2. Users input measurement data and specify a set of modeling assumptions. Model parameters and their permitted range of values are set a priori. Structural models are generated by stochastic sampling in a model space that consists of all combinations of acceptable parameter values. At each instance of model selection from the population of models, the structure is modeled as a finite element model, and its predictions are obtained. Responses from each model are compared with measurements in order to ascertain if the model is a candidate model. A candidate model is one that has predictions congruent with measured behavior. PGSL uses an objective function to determine if a model is a candidate model. The objective function is the distance metric used to differentiate candidate models from other models. Once a sufficient number of models have been sampled, a set of candidate models is available for subsequent analysis.
Figure 2: Methodology used for generating a set of candidate models
4
Accepted for the 14th EG-ICE workshop in Maribor, Slovenia (2007)
This paper examines the reliability of system identification. A reliability of 100% requires that the following three conditions are met: all possible models are considered in the set of models; there are sufficient measurement data to filter out wrong models and; all errors are zero. Fulfilling these three conditions completely is never feasible. However, for the purposes of this paper, it is assumed that the first two conditions are met. Many structures can be evaluated using the assumption that through use of good stochastic search algorithms and high tolerance limits all possible models are generated. The second condition requires the assumption that enough measurement data is available to filter out wrong models. Since a goal of this research is to determine systematically the best path to fulfillment of this condition, it is assumed that this goal is reached. Estimating the reliability of structural identification, as discussed in this paper, involves calculation of a threshold range of errors given a statistical tolerance limit. When the assumptions discussed above are not possible, evaluations of reliability that are described in this paper provide upper-bound values. In the following section, errors that affect the reliability of identification are discussed. 3
ERRORS IN SYSTEM IDENTIFICATION
The following discussion is drawn from previous work at EPFL (Robert-Nicoud et al., 2000, 2005a, 2005c). Error definitions are used unchanged in this research. 3.1 MODELING ERRORS Modeling error ( emod ) is the difference between the predicted response of a given model and that of an ideal model that accurately represents behavior. Modeling error propagation is graphically depicted in Figure 3. Modeling error has three constituents – e1 , e2 , and e3 (Raphael and Smith, 2003a). The component e1 is the error due to discrepancy between the behavior of the mathematical model and that of the real structure. Component e2 is introduced during numerical computation of the solution of partial differential equations. Component e3 is the error arising from inaccurate assumptions made during simulation. Such a definition of modeling errors by subdividing it into sources is similar to the delineation of errors in physical system modeling (Mahadevan and Rebba, 2006). Component e3 is further separated into two parts – e3a and e3b . The error part, e3a , arises from assumptions made when using the model (typically assumptions related to boundary conditions such as support characteristics and connection stiffness). The error part, e3b , arises from errors in values of model parameters such as moment of inertia and Young’s modulus. While it might be impossible to separate the components in practice, it is still important to distinguish between these errors since the only error source that is usually recognized by traditional model calibration techniques is e3b . 5
Accepted for the 14th EG-ICE workshop in Maribor, Slovenia (2007)
e1 : During creation of mathematical models of real structures e2 : While representing mathematical models using numerical models e3 : While simulating numerical models on computers
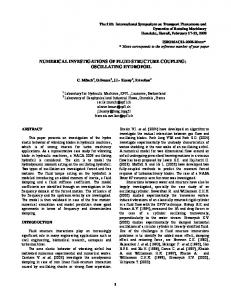
Figure 3: Errors in computational mechanics simulations 3.2 MEASUREMENT ERRORS Measurement error ( emeas ) is the difference between the real and measured quantities in a single measurement. Measurement errors result from equipment as well as on-site installation faults (Sanayei et al., 1997). In addition to sensor precision values reported by manufacturers, the stability and robustness (for example, with respect to temperature), and the effects of location characteristics (for example, connection losses) also account for measurement error. While it is tempting to quantify measurement error as a sum of individual sources, it is more reasonable to quantify them probabilistically using sensor precision and on-site information obtained during sensor installation. 3.3 PREVIOUS OBJECTIVE FUNCTION The model generation task requires an objective function that accounts for the errors to generate a set of candidate models. In Robert-Nicoud et al. (2005a), the objective function is formulated as follows. If xa is the real value of a behavior quantity such as deflection, xmeas is the measured value and xc is the value computed using a model, the following relationships have been obtained for a single measurement. xa = xmeas + emeas
(1)
xa = xc + e1 + e2 + e3
(2)
Model calibration procedures minimize the absolute value of the difference between xmeas and xc . The difference between xmeas and xc is known as the residue q . Rearranging the terms in Equations 1 and 2,
6
Accepted for the 14th EG-ICE workshop in Maribor, Slovenia (2007)
q = xmeas − xc = e1 + e2 + e3 − emeas
(3)
Thus, model calibration techniques minimize the quantity ( e1 + e2 + e3 − emeas ).This is equivalent to inaccurately assuming that this quantity is always zero. The objective function that is minimized during the optimization routine is the root-mean-square composite error (RMSE) which was calculated as RMSE = where qi = xi ,meas − xi ,c
∑q
2
i
n
(4)
= difference between the value measured at the ith
measurement point and the predicted value computed using the model. Any model that gives an RMSE value less than a threshold value is considered to be a candidate model. The threshold is computed using an approximate estimate of modeling and measurement errors. From Eqn. 3, since errors could be positive or negative q ≤ xc + xmeas ≤ e1 + e2 + e3 + emeas est est q ≤ Threshold = emod + emeas
(5) (6)
est est emod and emeas are estimates of the upper bound for modeling errors and est est measurement errors respectively. For quantifying threshold, emod has been emeas est assumed to have a value of 4% (from finite element simulations) and emeas was taken to be the precision of the sensor (Robert-Nicoud et al., 2005a).
4
NEW OBJECTIVE FUNCTION
The formulation described in the previous section for evaluating candidate models is improved by combining errors using statistical methods. Modeling error is difficult to quantify. It is problem dependent and can be minimized using modeling expertise (Banan et al., 1994b). Assuming an ideal situation, e1 = 0 . The other errors can be modeled probabilistically. i i Consider xmeas as the measured value at the ith measurement location and emeas as the
measurement error at that location. Similarly, xipred is the predicted value at the ith measurement location and ( eipred = e1 + e2 + e3 ) is the total modeling error. In the absence of errors, predictions from a candidate model exactly match the measurements. Since errors are present, this is represented in mathematical terms as, i i xmeas + emeas = xipred + eipred i i Δxi = xmeas − xipred = eipred − emeas
7
(7) (8)
Accepted for the 14th EG-ICE workshop in Maribor, Slovenia (2007)
Modeling error is defined by a variable e pred that follows a probability distribution with mean μ pred and standard deviation σ pred and measurement error is defined by a variable emeas that follows a probability distribution with mean μ meas and standard deviation σ meas . Assume that the probability distribution for e pred remains the same for one modeling problem. However, this may depend on element types and in reality, for a complex structure with different element types, the distribution for emeas could be different at each location. Since values of measurement error depend on sensor type and location characteristics, the distribution for emeas changes for each measurement location. Many quantities of engineering interest that are not extreme loads generally follow the normal distribution (Jordan, 2005). Assuming both probability distributions to be Gaussian distributions, the combined error is defined by a variable Z with mean μ z and standard deviation σ z , such that
μ z = μ pred − μmeas
(9)
2 2 σ z = σ pred + σ meas
(10)
Following from Eqn. (9), the threshold values for a certain reliability of identification ( ) are given by i r1i ≤ ( xmeas − xipred ) ≤ r2i
(11)
P ( r1i ≤ Z ≤ r2i ) = preqd
(12)
r1 = μ z − c and r2 = μ z + c
(13)
such that
where c is the value that is determined from the required statistical tolerance limit, preqd . The function, f i , is defined as ⎧0 ⎪ 2 ⎪ f i = ⎨( Δx i − r1i ) ⎪ 2 ⎪( Δx i − r2i ) ⎩
if r1i ≤ Δx i ≤ r2i if Δxi < r1i
(14)
if Δxi > r2i
where superscript i refers to the ith measurement location. The significance of fi is that the difference between measurement and prediction at each measurement location is compared with the corresponding threshold value. A model is a candidate model only if it satisfies condition f i = 0 at each measurement
8
Accepted for the 14th EG-ICE workshop in Maribor, Slovenia (2007)
location, i.e., the difference is within the specified threshold for every single measurement location. This requirement is encapsulated in a new objective function as follows
E=
n
fi
∑n
=0
(15)
1
The new objective function E in Equation 15 is employed for the case study in the next section. Equation 15 could be considered to be a form of the classical error function that is employed for curve fitting since it includes values of errors at each measurement location and provides a probabilistic basis for the reliability of candidate models. 5
ILLUSTRATION
Timber Beam Case Study
Robert-Nicoud et al. (2005a) tested a timber beam in the laboratory using a multiple model approach (Figure 4). The same case study is simulated in this paper. A mathematical model of the timber beam is created by discretizing it into 33 elements each of length 0.1 m. The spring support is modeled using two elements. Position and magnitude of the load and the elastic constant of the spring are treated as unknown variables. Minimum and maximum values for these variables are provided as input to system identification. Three sensors measurements are simulated. Models are randomly generated such that each model parameter has values within bounds specified by engineers. Each model in the set of candidate models has an equal probability of representing true structural behavior. The methodology for generating candidate models is as outlined in Section 2.
Figure 4: Schema of experimental timber beam (used in the case study) The input values and input ranges of unknown variables are shown in Table 1. Results are also analyzed using Principal Component Analysis (PCA). Three model parameters are used as data for PCA. These are transformed to the space defined by two principal components and the results are then clustered following Saitta et al. (2005).
9
Accepted for the 14th EG-ICE workshop in Maribor, Slovenia (2007)
Table 1: Material properties of case study structure and ranges of variables used in system identification Material properties (N, cm)
Beam
E = 6.93 x10⁶
Ix = 4.26x10⁻⁷
A = 0.0032
Spring l Force
E = 0.418 x10⁵
Ix = 1.58x10⁻⁷
A = 0.001856
–25 @ Node 11 of 36 (X = 100cm)
Ranges of variables
Point load position (X)
20 cm to 250cm (10(n-1) where n = [2, 25] (discrete node values)
Load magnitude (F)
–30 N to 0 N
Elastic constant of spring (E)
0.30 x10⁵ N/cm2 to 0.50 x10⁵ N/cm2
6
RESULTS
In this study, 24000 models are randomly sampled. In keeping with the requirements stated earlier, it is assumed that all possible models are generated and that there are enough measurement data to filter out wrong models. One type of sensor is used. The values that are used to characterize random variables pertaining to modeling error and measurement error are given in Table 2. Two cases of composite error having a tolerance limit of 50% and 95% are used. The number of models generated in each case is listed in Table 3. Table 2: Characterization of error variables used Variable Mean ( μ ) Standard Deviation ( σ )
e pred
μ pred = 0
σ pred = 0.1
emeas
μmeas = 0
σ meas = 0.001
Table 3: Number of candidate models obtained Tolerance Limits
50%
95%
No. of candidate models (out of 24000)
7938
15785
10
Accepted for the 14th EG-ICE workshop in Maribor, Slovenia (2007)
It can be seen that higher tolerance limits have greater numbers of candidate models. Data mining is performed to extract information from the set of candidate models in both the cases (Saitta et al., 2005). Principal components are plotted in Figures 5(a) and 5(b). Figure 5(a) shows, in PCA space, the candidate models obtained in the case with 50% tolerance limits and Figure 5(b) shows that there are a greater number of candidate models discovered in the case with 95% tolerance limits. These plots support the postulate that insufficient tolerance limits may result in potentially important candidate models not being identified. The parallel line type clusters with free space between groups misleadingly point to a correlation between certain variables. This is due to the fact that the variable X takes discrete values only.
Figure 5a: Clusters visualized using Principal Component Analysis (at tolerance limit of 50%)
Figure 5b: Clusters visualized using Principal Component Analysis (at tolerance limit of 95%) The additional candidate models in the second case (tolerance limit 95%) are those that are not identified when the tolerance limit is 50%). Results show that it is useful to include error characterization in the objective function in order to identify candidate models within model generation module (Figure 2).
11
Accepted for the 14th EG-ICE workshop in Maribor, Slovenia (2007)
The previous objective function (Section 3.3) did not include statistical reasoning for choosing threshold values. Therefore, a threshold value is chosen without estimating the risk of losing potential candidate models. To illustrate this, consider Table 4, which gives the parameter values for the case study model and four of the candidate models obtained. Model 1 is a candidate model that is identified when the statistical tolerance limit is set to 95%. However, it was ignored when the statistical tolerance limit is 50%. The proposed method enables the selection of a error threshold according to the level of confidence required in the identification process. Table 4: Description of four candidate models X (cm )
F (N)
E (N/cm2)
Case study structure
100
–25
41800
Model 1
100
–24.93
41915
Model 2
150
–22.55
33515
Model 3
150
–22.49
36107
Model 4
130
–21.75
42901
Model
Table 4 also illustrates that errors from different sources may compensate each other such that predictions of bad models match measurements. Model 1 is the right candidate model since it is very close to the case study structure. However, models 3 and 4 are among other candidate models that are identified. Depending upon the error values, either one of these models could have been adopted as the right model if one was to simply minimize the error difference. While the candidate model set includes bad models these can be filtered through further measurements. CONCLUSIONS
Conclusions of this research are:
An explicit statistical formulation of the objective function provides a useful basis for identifying candidate model sets. Since various types of errors may compensate one another, it is risky to accept model predictions based on comparisons that assume no errors. When error characteristics are known, including high tolerance limits expands the set of candidate models. Probabilistic characterizations of errors ensure an estimate of the reliability that the candidate model set includes the correct model.
Future work involves experimental error quantification using full scale studies. Experiments in controlled environments are required to estimate probability density 12
Accepted for the 14th EG-ICE workshop in Maribor, Slovenia (2007)
functions for measurement and modeling errors. Subsequent tasks in multiple-model system identification include data mining in order to classify them into clusters and engineer-computer interaction for improved knowledge visualization. ACKNOWLEDGEMENTS
This research is funded by the Swiss National Science Foundation under contract no. 200020-109257. The authors would like to thank B. Raphael and Sandro Saitta for their contributions to this research area. REFERENCES
Arya B., and Sanayei, M. “Structural Parameter Estimation Accuracy in the Presence of Modeling Error,” Proceedings of the International Conference on Applications of Statistics and Probability, Sydney, Australia, December 12-15, 1999 Banan, M. R., Banan, M. R., and Hjelmstad, K. D. (1994a). “Parameter Estimation of Structures from Static Response. I. Computational Aspects,” J. Struct. Engrg., ASCE, 120(11), pp 3243–3255 Banan, M. R., Banan, M. R., and Hjelmstad, K. D. (1994b). “Parameter Estimation of Structures from Static Response. II. Numerical Simulation Studies.” J. Struct. Engrg., ASCE, 120(11), pp 3256–3283 Billington, D. (1979). Robert Maillart’s Bridges. Princeton University Press. Brownjohn, J., M., W., Moyo, P., Omenzetter, P. and Lu, Y. (2003). “Assessment of highway bridge upgrading by dynamic testing and finite-element model updating,” J. Bridge Engrg., 8(3), pp 162–172 Friswell, M., I., and Mottershead, J., E. (1995). “Finite element model updating in structural dynamics,” Kluwer, New York Haldar, A. and Mahadevan, S. (2000). Probability, Reliability and Statistical Methods in Engineering Design. John Wiley & Sons, Inc. Jaishi, B. and Ren, W. (2005). “Structural finite element model updating using ambient vibration test results,” J. Struc. Engrg, 131(4), pp 617–628 Jordaan, I. (2005). Decisions under Uncertainty – Probabilistic Analysis for Engineering Decisions. Cambridge University Press. Koh, C., G., Chen, Y., F., and Liaw, C., Y. (2003). “A hybrid computational strategy for identification of structural parameters,” Comput. Struct. 81, pp 107–117 Ljung, L. (1999). System Identification – Theory for the User. Prentice Hall. Mahadevan, S. and Rebba, R. (2006). “Inclusion of Model Errors in ReliabilityBased Optimization,” J. of Mechanical Design, 128, pp 936–944 13
Accepted for the 14th EG-ICE workshop in Maribor, Slovenia (2007)
Raphael, B. and Smith, I.F.C. (1998) "Finding the right model for bridge diagnosis", Artificial Intelligence in Structural Engineering, Computer Science, LNAI 1454, Springer, Heidelberg, 308-19 Raphael, B. and Smith, I. F. C. (2003a). Fundamentals of Computer-Aided Engineering. Wiley. Raphael, B. and Smith, I. F. C. (2003b). “A Direct Stochastic Algorithm for Global Search,” Journal of Applied Mathematics and Computation, 146(2-3), 729–758 Robert-Nicoud, Y., Raphael, B., Smith, I. F. C. (2005a). “System Identification through Model Composition and Stochastic Search,” J. of Comp. Civ. Engrg., 19(3), pp 239–247 Robert-Nicoud, Y., Raphael, B., Smith, I. F. C. (2005b). “Configuration of Measurement Systems Using Shannon’s Entropy Function,” Computers and Structures, 83, pp 599–612 Robert-Nicoud, Y., Raphael, B., Burdet, O., Smith, I. F. C. (2005c) “Model Identification of Bridges Using Measurement Data,” Computer-Aided Civil and Infrastructure Engineering, 20(2), pp 118–131 Saitta, S., Raphael, B. and Smith, I. F. C. (2005). “Data Mining Techniques for Improving the Reliability of System Identification,” Advanced Engineering Informatics, 19(4), pp 289–298 Sanayei, M., Bell, E., S. and Javdekar, C. N. (2005). “Bridge deck finite element model updating using multi-response NDT data,” Proceedings of the 2005 Structures Congress and the 2005 Forensic Engineering Symposium, April 20– 24 Sanayei, M., Imbaro, G., McClain, J. A. S., and Brown, L. C. (1997). “Structural Model Updating Using Experimental Static Measurements,” J. Struct. Engrg., ASCE, 123(6), 792–798 Sanayei, M., McClain, J. A. S., Wadia-Fascetti., S. and Santini, E. M. (1999).”Parameter Estimation Incorporating Modal Data and Boundary Conditions.” J. Struct. Engrg., ASCE, 125(9), 1048–1054 Sanayei, M., Arya, B., Santini E. M. and Wadia-Fascetti, S. (2001). “Significance of Modeling Error in Structural Parameter Estimation.” Special issue of the International Journal of Computer-Aided Civil and Infrastructure Engineering devoted to Health Monitoring of Structures, 16(1), 12–27 Smith, I. F. C., Saitta, S., Ravindran, S. and Kripakaran, P. “Challenges of Data Interpretation,” Proceedings of the Structural Assessment Monitoring and Control Workshop (SAMCO), Prague, 18–19 September, 2006
14
Accepted for the 14th EG-ICE workshop in Maribor, Slovenia (2007)
Xia, P. and Brownjohn, J., M., W. (2004). “Bridge structural condition assessment using systematically validated finite-element model,” J. Bridge Engrg., 9(5), pp 418–423
15