Evaluating Simulation Software Components with Player Rating Systems Jonathan Wienß
Michael Stein
Roland Ewald
Institute of Computer Science University of Rostock
Institute of Computer Science University of Rostock
Institute of Computer Science University of Rostock
[email protected]
[email protected]
[email protected]
ABSTRACT In component-based simulation systems, simulation runs are usually executed by combinations of distinct components, each solving a particular sub-task. If multiple components are available for a given sub-task (e.g., different event queue implementations), a simulation system may rely on an automatic selection mechanism, on a user decision, or — if neither is available — on a predefined default component. However, deciding upon a default component for each kind of sub-task is difficult: such a component should work well across various application domains and various combinations with other components. Furthermore, the performance of individual components cannot be evaluated easily, since performance is typically measured for component combinations as a whole (e.g., the execution time of a simulation run). Finally, the selection of default components should be dynamic, as new and potentially superior components may be deployed to the system over time. We illustrate how player rating systems for team-based games can solve the above problems and evaluate our approach with an implementation of the TrueSkillTM rating system [14], applied in the context of the open-source modeling and simulation framework JAMES II. We also show how such systems can be used to steer performance analysis experiments for component ranking.
Categories and Subject Descriptors I.6.7 [Simulation and Modeling]: Simulation Support Systems; I.2.6 [Artificial Intelligence]: Learning
Keywords Software Components, Adaptive Software, Performance Analysis, Bayesian Learning, Online Learning
1.
INTRODUCTION
While a component-based design of simulation systems improves their flexibility, reusability, and maintainability, it
Published in proceedings of the SIMUTools 2013 (see http://simutools.org) .
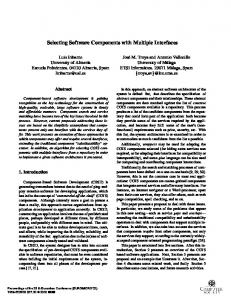
also raises several new issues that have to be dealt with. One such issue is the selection of the most suitable component for a given task. This problem can be tackled in various ways [8], but automatic selection mechanisms usually rely on some form of performance measurements. These measurements do not, however, yield immediate insights into the performance of individual components — instead, they typically measure the performance of component combinations. Consider the example in Figure 1, where (as in the following) the execution speed of a simulation run is the performance metric to be optimized. A new simulation problem is encountered, and the simulator to be used requires an event queue component. Since an event queue may have a strong impact on overall execution speed, component-based simulation systems like JAMES II typically offer several implementations [16]. Assume that event queues A and B are eligible, but neither a user preference nor an automatic selection mechanism is available. Which event queue shall be selected by default? Intuitively, one would like to select the event queue with the best performance on previous problems. However, event queues are combined with other components that influence overall performance (e.g., simulators, data observers, random number generators) and they may have been applied in differing application domains. To make a fair comparison, one has to restrict the comparison to measurements in otherwise identical contexts, i.e., whenever both event queues are combined with the same additional components (the same simulator, and so on) and these component combinations are applied to the same problem. This makes it difficult to gather enough data for an unbiased comparison, since typically only a small subset of potential component combinations are used to solve a single simulation problem (see Section 3.1). Therefore, an empirical comparison of two event queues as described above is either based on few (if any) suitable performance measurements and thus is unreliable, or it requires additional experiments. We propose an alternative approach to compare individual simulation software components: the main idea is to regard each component as a player of unknown ability in some game, and to rank them with a player rating system. A player rating system is a set of rules that allows to rate individual players based on their past performances in playing a game. Player rating systems have been developed in the context of sports (e.g., see [32]) and are typically used to generate rankings of players by considering past game results. A prominent example is the Elo rating system (e.g., see [34]), which has been developed for chess but today serves as a
Problem #1:
A
B
Performance Comparison
A Runtimes:
SC
SD
SE
15 s
25 s
17 s
Problem #2:
Runtimes:
B
A
SD
SF
SG
19 s
22 s
42 s
...
How to choose a default component?
A
?
B
SX Figure 1: Typical performance data available for component-based simulation systems. Imagine that run times are available for combinations of components: here, simulators SC , . . . , SG are combined with event queues A and B. Only a subset of possible combinations is applied to each problem, which makes comparisons difficult. How can we use the available data to decide upon suitable default components within a new context (here simulator SX , bottom), while encountering a previously unseen problem?
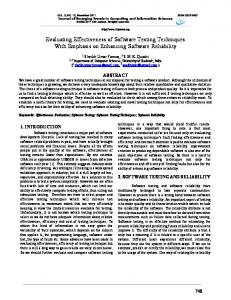
basis for many other rating systems [32]. After each game, a rating system considers both the game’s result and the ranks of the players, which are then updated. After sufficiently many games between players have been observed, the player ranking determined by such a system should reflect each player’s overall ability, leading to global rankings like the FIDE ranking for chess or the FIFA world ranking for football. While football is a team sport, the FIFA world ranking regards teams as monolithic entities and neglects the individual abilities of team members. This restriction is problematic whenever teams are defined in an ad-hoc manner, as, for example, in team-based multi-player games: the general problem to be solved here is to estimate the abilities of individual players by considering game results for teams. This is similar to the evaluation of individual simulation components (see Figure 2), where the problem is to estimate the abilities of such components by considering performance results for component combinations. A well-known approach to solve this problem for multi-player games is TrueSkill [14], a player rating system developed by Herbrich et al. that is used for Microsoft’s online gaming service Xbox LiveTM . In this paper, we use TrueSkill to investigate how suitable player rating systems are for the evaluation of simulation software components. The next section discusses which requirements a player rating system should meet when it is used for this task (Sec-
B
SC
SD
SE
15 s
25 s
17 s
Multi-Player Team Results
1.
SC
2.
SE
B
3.
SD
A
Figure 2: Analogy between multi-player games and performance comparison of software component combinations, for the setups of the first problem in Figure 1.
tion 2.1), describes the advantages and limitations of the TrueSkill approach (Section 2.2), and reviews related approaches (Section 2.3). We then motivate our realization of a TrueSkill-based component rating system by describing a concrete usage scenario (Section 3.1), develop a generic and system-independent interface for component rating systems (Section 3.2), and briefly discuss our current implementation of this interface (Section 3.3). Finally, we evaluate how well our implementation is able to rank simulation system components (Section 4).
2. 2.1
BACKGROUND & RELATED WORK Requirements
As a rating system for components is merely a fall-back mechanism for situations in which no other selection mechanism is available, it should interfere as little as possible with the simulation system as such. This general requirement implies, for example, that the data to be stored for each component should be compact, i.e., recording the whole history of performance results should be avoided. Instead, the knowledge on a component’s overall performance should be stored in an aggregated form, and it should be updated incrementally. An update should require as little execution time and memory as possible, even when many individual components are available in the system. Another important aspect is the robustness of the component ranking: just because a well-established default component has once been used in a combination with bad performance, it does not necessarily mean that it should not be the default anymore. The component’s rank should only gradually decrease if such situations occur more frequently. Note that this requirement may depend on the given performance metric; for example, this behavior may not be desired if components shall be ranked by their reliability. Apart from this issue, the exact kind of the performance metric should be irrelevant to the component rating system: it should work by only considering comparisons between component combinations. The overall problem is therefore quite general and does not require any additional knowledge of component properties. Consequently, the component rating system should be independent of a specific simulation system and re-usable in a broader context.
2.2
The TrueSkillTM Rating System
The TrueSkill [14] rating systems allows us to meet the above requirements by following a Bayesian approach. Basically, this means that player performance is modeled as a
random variable, with a distribution that is updated whenever new evidence is available. TrueSkill assumes player skills si to be normally distributed, si ∼ N (µi , σi2 ), and to resulting in a joint distribution p(s) = Qnbe independent, 2 N (µ , σ ). For example, the TrueSkill parameterizai i i=1 tion described in [14, p. 575] assumes the skill distribution of a new player to be N (25, ( 25 )2 ), where the mean represents 3 the (believed) skill and the standard deviation represents the confidence in that belief. Note that only the relations between these concrete values are meaningful, i.e., whether an estimated skill of 25 is good or not depends on the skills of the other players. A player’s performance in a game mainly relies on the skill si , but external factors like the form of the day (or luck) may also have an impact. Hence, the performance is assumed to be normally distributed around the skill si , with a fixed variance of β 2 : pi ∼ N (si , β 2 ). Therefore, even if the skill of a player would be known with absolute certainty, e.g., si ∼ N (25, 0), the performance of this player would still be assumed to vary from game to game, i.e., in this case pi ∼ N (25, β 2 ). Each of the n players belongs to exactly one of k teams, which is expressed by team assignment A = {A1 , . . . , Ak }. TrueSkill further assumes the performance of P a team tj to be the sum of its members’ performances: tj = i∈Aj pi . The result of a game is represented by a ranking r, which is an ordering of the teams by their performance. Given a ranking r for a team assignment A, Bayes’ theorem (e.g., see [3]) defines how our belief in player skills should be updated to the so-called posterior distribution (see Equation 2 in [14]): p(s|r, A) =
P (r|s, A)p(s) P (r|A)
(1)
where P (r|s, A) is the probability of the observed game result (represented by the ranking r), given player skills s and team assignment A, and p(s) is the prior distribution (i.e., our previous belief regarding player skills). To calculate the posterior p(s|r, A), TrueSkill approximates the integration of the joint distribution over player performances (p) and team performances (t) [14, p. 571]: Z ∞ Z ∞ p(s|r, A) = ... p(s, p, t|r, A)dpdt (2) −∞
−∞
The joint distribution p(s, p, t, r) is represented by a graphical model (e.g., see [3]), the structure of which depends on the team assignments A. The approximation of the posterior distribution p(s|r, A) is briefly outlined in Section 3.3 (more details can be found in [14]). Before each update, TrueSkill increases the variance σi 2 of each involved player by adding a constant value τ 2 . This is done to avoid overly confident beliefs in a player’s skill. When applied to component-based software, the component combinations are represented by the team assignment A and the resulting ranking r orders them by some performance metric (e.g., execution time). As quantitative data is neglected and only the order of the component combinations matters, these observations could even be reused to update beliefs across machines, leading to a ‘global’ ranking of components. While component performance may be highly machine-dependent, a global ranking would converge to the ranks of components on an ‘average machine’, i.e., in terms of the underlying joint probability distribution this means the hardware impact would be marginalized.
In [14], Herbrich et al. show that TrueSkill is able to outperform the Elo rating system in terms of prediction accuracy on player rankings from XBox Live games. Furthermore, TrueSkill meets the requirements outlined in Section 2.1. It only has to store its current belief in the skill si of each player (represented by µi and σi ), and while the flexibility of a simulation system may lead to a combinatorial explosion regarding the number of component combinations, the amount of skill-related data to store only grows linearly with the number of available components. The rating system is inherently incremental and also robust, in the sense that updates of player skill take into account both the previous rank and also its uncertainty. TrueSkill can also be separated easily from component-based simulation systems, as discussed in Section 3.2.
2.3 2.3.1
Related Work TrueSkill Extensions
The original TrueSkill approach has been refined in many ways, typically motivated by its application to a specific problem domain. Nikolenko and Sirotkin extend TrueSkill by more accurately capturing multiway ties, i.e., situations where more than two teams share the same rank [29]. Moreover, they remove the inherent bias towards larger teams, which is introduced by Pthe assumption of additive team performance, i.e., tj = i∈Aj pi (see Section 2.2) — this assumption means the more players a team has, the more likely it should win. Nikolenko and Sirotkin instead use, among other functions, the average player performance as the team performance function [29]. We follow the same approach, since a component combination should not perform better just because it consists of more components. Guo and Sanner use TrueSkill for preference elicitation [13], i.e., their aim is to learn user preferences for certain attributes. To do so, the attributes are regarded as players that are grouped into teams by certain items that exhibit them (e.g., from an online shop). As a user chooses between two different items (i.e., attribute sets), TrueSkill is used to rank their individual attributes by the user’s preferences. Since the attribute sets of two items may overlap, Guo and Sanner consider the special case where a player is part of both ‘teams’ they compare, and conclude that this player can be ignored. Since it is also possible that different component combinations make use of the same component, we have to consider this special case as well (see Section 3.3). Guo and Sanner also propose several query selection strategies, i.e., how to select which question to ask the user, based on the current beliefs. They evaluate some approaches that are based on maximizing the so-called ‘value of information’ of the next question and compare them with some simple heuristics like using the upper confidence bound [12], an approach that is also used in related fields like multi-armed bandit policies (e.g., [2]). In the same spirit, we can use component rating systems to steer performance analysis experiments for software components: just as TrueSkill is used for match-making in online gaming (broadly speaking, by selecting teams of players with similar odds of winning [14]), we could use it to select the most promising component combinations to let them ‘compete’ with each other. Apart from extending TrueSkill, its approximation (see Section 3.3) of Equation (2) can be streamlined as well. Weng and Lin derive analytical update rules that perform
slightly better than the original approximation by the TrueSkill approach and are faster to execute [34]. As we do not yet know in what ways TrueSkill should be adjusted in the future to suit our application domain, we chose to implement the original approach based on factor graphs instead (see Section 3.3). In [6, 7], DeLong et al. introduce TeamSkill, a mathematical framework that uses player rating systems like Elo or TrueSkill as ‘base learners’ and is focused on adequately capturing ‘team chemistry’, i.e., those relations among individual players that impact overall team performance. Formally, this means that the player performances pi are correlated, whereas TrueSkill assumes the performances to be independent (each pi only depends on the player’s skill si , see Section 2.2). To account for correlations, DeLong et al. apply a rating system to the performance history of all subsets of a team for which such data is available. The resulting performance predictions for team subsets are then incorporated into the overall prediction. This allows TeamSkill to outperform TrueSkill when it comes to highly competitive situations (e.g., professional gaming), where the effects of player interaction weigh in most heavily. Similarly, the performance of simulation system components may also be correlated. One example for this are components that have been developed with the needs of a specific application domain in mind, e.g., some event queues in JAMES II have been adapted to work efficiently with DEVS simulators [16]. Another potential source of correlation is the underlying hardware, as some components may have memory footprints and access patterns that are simply more easy to optimize, e.g., via caching (see [23]). However, the solution approach in [6, 7] does not meet all requirements for a component rating system (see Section 2.1), since rating all team subsets either implies to record the overall history (as assumed in [6, 7]) or to always rate all possible team subsets as well, so that (in the worst case) the required storage grows exponentially with the team size. Additionally, proper subsets of component combinations are rarely able to execute a simulation task at all (how would an event queue alone simulate a model?), so that there is little additional insight to be gained in our case.
2.3.2
Software Component Ranking
To the best of our knowledge, no other approach uses player rating systems to incrementally rank software components based on their overall performance at runtime. However, the idea of ranking software components by other metrics is anything but new. Inoue et al. [18], for example, rank components (here, Java classes) by their usage in a software system. Other ranking mechanisms rely (like TrueSkill) on Bayesian networks to predict the reliability of software components, e.g., based on software metrics and test results [1] or based on the software architecture [31]. There are also various methods for ranking and selection that could in principle be applied to component ranking (e.g., see [24, p. 561 et sqq.]). Moreover, the approach of incrementally improving knowledge on the available components at runtime is related to the notion of ‘life-long learning’, as supported by the AOTA framework [10]. In contrast to our approach, the AOTA framework is focused on learning algorithm portfolios and directly controls algorithm execution by assigning computing resources. Besides these general approaches to component ranking,
note that there is also a plethora of adaptive simulation mechanisms — usually fine-tuned to specific simulation systems and component types (or their parameterizations) — that (at least implicitly) rank their execution choices (e.g., [26, 33]). Our approach is focused on selecting suitable default components in situations where such adaptive mechanisms are not available.
3. 3.1
IMPLEMENTATION Ranking JAMES II Components
To illustrate how to integrate a component rating system into a component-based simulation software, we briefly discuss how it can be used to rank the components of JAMES II [17], an open source modeling and simulation framework written in Java, by their execution speed. In JAMES II, the components to be ranked are plugins [17]. They encapsulate most of the functionality and can be combined with each other. In principle, a plugin can be deployed or removed at any time, so that its availability must not be presupposed. A plugin may also have custom restrictions regarding its applicability, so that even if it is available it may not be eligible for the problem at hand. A typical example for this are simulator plugins, which are restricted to work only on models of the modeling formalism they support. To cope with this uncertainty, a plugin for a given task is either pre-configured by the user or can be requested from the JAMES II registry. The JAMES II registry employs several mechanisms to select one of the eligible plugins and thus to resolve the request. If no custom selection method is available, plugins are typically sorted by a so-called efficiency index (see [17]). This index is defined by each plug-in and essentially expresses how well the given component should perform in general. While efficiency indices are a straightforward solution and simple to implement, they are also highly subjective and typically not derived from experiment results. To some extent, they also violate the separation-of-concerns principle of the plugin system itself, as they are used to compare plugins with each other — the semantics of a plugin’s efficiency index therefore depend on the indices of other plugins. Finally, the indices are hard-coded, i.e., they are not adjusted to reflect the capabilities of newly deployed plugins, or to the application domain in which an installation of the simulation system is used predominantly. All these problems can be resolved by re-interpreting the efficiency indices as ranks that are determined by a component rating system, i.e., the JAMES II registry could simply query component ranks from the rating system whenever multiple plugins are eligible and the best default option shall be used. While this explains how JAMES II can leverage the rankings provided by the component rating system, how does the rating system receive its inputs? In case of stochastic simulations, which usually require multiple replications, this can be easily done by relying on another adaptive mechanism that automatically explores the performance of various component combinations at runtime [9]. It is shown in Figure 3. In this case, the observed performances can be averaged and interpreted as the game results, which can then be submitted to the component rating system. If no replications are required (e.g., in case of deterministic simulations), one could still randomly select another eligible component combination from the JAMES II registry whenever sufficient hardware resources (e.g., CPU cores) are available.
Feedback #1 Decision #1
Decision #2
Run Time
Adaptation Policy
Decision #3
Skills
sSC
sSE
sB
sSD
sA
Performance
pSC
pSE
pB
pSD
pA
Team Performance
tSC
Learning
Execution of (Parallel) Simulation Replications
Figure 3: General mechanism of the adaptive simulation replication policy in JAMES II (from [9]). The three squares (white, grey, and black) denote three component combinations. A policy chooses one of them for the next replication, based on what it learned from their previous performance on the same simulation problem (red labels). Although the solution described here would be specific to JAMES II, the approach should work similarly well for other component-based simulation systems, e.g., OSA [5], and in fact in any other kind of component-based software where component combinations can be compared by some metric. We therefore chose to hide this functionality behind a generic interface.
3.2
A Generic Interface for Component Rating Systems
In principle, the interface to a component rating system needs to contain just two methods: one method to submit new ‘game’ results (i.e., a ranking of component combinations), and one method to compare two players (i.e., components) by their rank. To maintain generality and avoid any assumptions regarding the nature of the components being ranked (e.g., Java classes as in [18] or plugins in JAMES II, see Section 3.1), each component is represented by an arbitrary but unique String id. Thus, teams can be represented by sets of String ids. In case an unknown component id is encountered, the component rating system should simply assume that there is a new player, so no explicit addition or deletion of players has to be supported. However, since components may be updated, e.g., because a new version is available, one may want to notify the component rating system. While systems like TrueSkill could also cope without this knowledge, i.e., the component’s rank would eventually converge to a new value, this depends on the rating system that is used. In any case, the update of a component might be easy to detect for the simulation system at hand, and this additional information may be useful for the rating system. Besides other auxiliary methods (e.g., to reset the knowledge base), the interface allows to adjust the (real-valued) weight of a specific component, and also to inject a component rank. Both methods come in handy when outside knowledge on component performance should be incorporated into the knowledge base. For example, when ranking by execution speed, components that are known to have little impact on execution speed could be weighted less than others. External ranking data (e.g., a ‘global’ ranking, see Section 2.2) could be directly ‘injected’ into the knowledge base.
3.3
Realization with TrueSkill
Our implementation of the generic interface for component rating systems, as described in the previous section, is written in Scala [30]. Thus, it is also fully compatible with any Java-based simulation system (like JAMES II). Its
Team Performance Difference
tSE+B
d1
tSD+A
d2
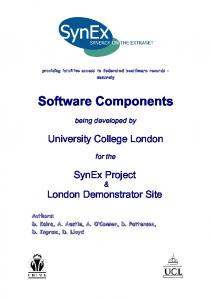
Figure 4: A factor graph as it would be created for the multi-player team ranking given in Figure 2 (after [14]), corresponding to the assumptions of TrueSkill regarding the (in-)dependence of the random variables it considers (see Section 2.2). The rectangles with rounded edges denote random variables. The black squares denote factors, which represent functions that are defined on the connected variables. central entity is the UpdateCalculator, which takes the results of one component comparison and calculates a belief update. Here, beliefs refer to the overall capabilities of the involved components (i.e., their ‘skills’), so that an update may change the global component ranking. The updates are calculated by TrueSkill in two major steps: first, a socalled factor graph [22] is created, a graphical model of the joint probability distribution described in Section 2.2. Its structure corresponds to the component combinations that are involved, i.e., the team assignment A. Then, a messagepassing algorithm is executed on the factor graph to calculate the belief update, i.e., the right-hand side of Equation 2. An example for a factor graph is given in Figure 4. Apart from its team performance variables and their neighboring factors, no node in the graph has more than two edges. The sum-product algorithm [22] is used for these ‘linear’ parts of the graph, whereas expectation propagation [27] may be required for the other parts. Both approaches pass messages between the nodes. The main idea behind message passing on factor graphs is to compute certain mathematical expressions more efficiently, by exploiting their structure. For example, consider a probability mass function for two binary random variables, X1 and X2 : p(X1 , X2 ) = f1 (X1 ) · f2 (X1 , X2 )
(3)
One could calculate the corresponding marginal distribution p(X1 ) via p(X1 ) = f1 (X1 ) · f2 (X1 , >) + f1 (X1 ) · f2 (X1 , ⊥) which requires two evaluations of both f1 and f2 , two multiplications, and one summation. However, this can be improved by exploiting the distributive law: ! X p(X1 ) = f1 (X1 ) · f2 (X1 , x2 ) x2 ∈{>,⊥}
Passive Mode
Active Mode
Users
Simulation Software
which saves one multiplication and one evaluation of f1 . These savings add up considerably when dealing with larger expressions; they can be gained by transforming an expression to a factor graph and then using a message passing scheme for aggregating the results of sub-expressions. TrueSkill exploits structures like the above within the joint probability distribution (represented by the factor graph); its messages contain intermediate results for the belief update (see Equation 2). The concrete messages used by TrueSkill are defined in [14]. The calculation starts with the factors at the top of the graph, which update the skills variables by passing messages downwards along the edges. Then, the performance and the team performance variables are updated in the same manner. If more than two teams participate in the game (as in Figure 4), expectation propagation is used to iteratively approximate variable values in the lower part of the factor graph. In each iteration, all variables on a path between two performance difference factors (the factors at the bottom of Figure 4) are updated by a fixed message passing schedule (see Figure 1 in [14]). Expectation propagation stops when the approximation error becomes sufficiently small, i.e., the difference between previous and updated value is negligible for all involved variables. The algorithm then works its way back to the top of the factor graph: it updates the variables in the upper part of the graph, starting with the team performance variables, until the skills variables are reached (see Figure 4). The (approximated) posterior distribution of player skills (see Equation 2) can now be retrieved from them. More details on the algorithms can be found in [14, 27]. We validated the UpdateCalculator by comparing its results with those of the official web-based TrueSkill calculator [11].1 Additionally, our implementation of the component rating system interface (see Section 3.2) provides a knowledge base to store the current beliefs on component capabilities, expressed by parameters of the normal distribution (µ and σ). Apart from passively considering comparison results for component combinations and updating the ranking correspondingly, one can also use a component rating system to steer experiments, by letting the rating system select which component combinations to apply to a given problem. To support this ‘active’ mode of operation, it is necessary to have a notion of match quality. The match quality is a function that determines the value of comparing two or more component combinations. High match quality indicates that such a comparison would provide a useful update for the knowledge base, in the sense that the resulting ranking more closely resembles the actual ranking. By iteratively selecting a suitable match of component combinations to compare, passing it to the simulation system, and analyzing the result, a component rating system can actively improve its ranking. We therefore implemented an additional experiment control mechanism for JAMES II that operates in this manner. The difference between the active and the passive mode of operation is summarized in Figure 5. Special care has to be taken if a component is part of multiple component combinations that are compared with each other. This may happen, for example, if the same event queue is used by two distinct simulators that are compared
∗ where rs,A is the true rank of team A when competing with the other teams in A(s) on simulation problem s. Note that we approximate r∗ (s, A) by repeatedly applying the component combinations in A(s) to each problem s ∈ S and comparing their observed execution times. To make the ranking experiments as straightforward as possible, we subsequently focus on the ranking of event queue implementations in JAMES II (see [16]) and only consider two-player
1 The implementation details of another open source implementation of TrueSkill [28] also proved to be helpful.
2 This rank is only valid over the given sets of simulation problems and component combinations.
Problem
Results
Simulation Software Component Comparisons
Component Ranks
Problem & Component Combinations Match Selection & Experiment Control
Performance Results
Component Comparisons
Component Rating System
Component Ranks etc.
Component Rating System
Figure 5: Different usage modes for the component rating system. Note that in the active mode, where the components rating system is used to steer experimentation, different kinds of data are exchanged. For example, the uncertainty associated with a component’s capability may also be considered for choosing the next simulation experiment. All differences are highlighted in red on the righthand side. with each other. Since the component is represented multiple times in the factor graph, each time with the same skill, TrueSkill calculates multiple updates for it (according to its performance in each team it belongs to). Currently, we solve this problem by averaging over the conflicting updates.
4.
EVALUATION
4.1 4.1.1
Experiment Setup General Setup
Our aim is to show that TrueSkill is effective in ranking real-world components on arbitrary simulation problems. While observing sufficiently many comparisons between component combinations, its ranking should converge towards the ‘true’ ranking of the individual components. Let S be a finite set of pre-defined simulation problems, and let A(s) be a finite set of suitable component combinations for each problem s ∈ S, with A(s) = {As,1 , . . . , As,n } (i.e., problem-specific team assignments, see Section 2.2). The ‘true’2 rank rc∗ of a component c can be regarded as its expected rank when solving any simulation problem s ∈ S with any suitable component combination c is part of (i.e., an element from Ac (s) = {As,i |c ∈ As,i ∧ As,i ∈ A(s)}): ! P ∗ 1 X A∈Ac (s) rs,A ∗ ∗ (4) rc = Es∈S,A∈Ac (s) [rs,A ] = |S| s∈S |Ac (s)|
teams, i.e., event queues combined with simulators (all other simulator components have been fixed). Moreover, we consider all combinations of event queue and simulator for any simulation problem, so that |Ac (s)| is the same for each event queue and problem. As we are only interested in the ranking of the event queues, i.e., their relative order, we can also 1 discard |S| in Equation (4), which is the same for all components, and simply rank each event queue by summing over its team’s ranks: X ∗ rs,A s∈S,A∈Ac (s)
The litmus test for our component rating system is how fast it can learn the same ranking by only observing comparisons between component combinations with respect to single simulation problems. Since some of the true ranks ∗ rs,A are hard to approximate (e.g., for stochastic models with strongly varying dynamics), we use a resampling approach for evaluation. At first, we replicate the execution of each simulation problem s ∈ S with any component combination A ∈ A(s) 20 times. This allows us to estimate ∗ the rs,A , based on the 20 execution times sampled for each (s, A) combination. We now generate results for the component rating system by randomly drawing execution times from the samples of the corresponding (s, A) combination. Besides speeding up the evaluation as such, this resampling makes the comparison of different TrueSkill configurations easier, since all of them now draw their observations from the same data base. Finally, the resampling also ensures that TrueSkill should indeed converge to the pre-computed ranking (in the limit), as this ranking is now indeed the true ranking for the available data.
4.1.2
Simulation Components and Problems
To illustrate that the component rating system works over several application domains of a simulation system, we selected JAMES II simulators for species-reaction networks [19] (SR), species-reaction networks in discretized space [20] (SRS), PDEVS [15], and stochastic π-calculus [25] (stoch-π). For species-reaction networks and stochastic π-calculus, we selected three simulators each, for the other two application domains (PDEVS, SRS) we selected a single simulator each. Each simulator is configured to use one of ten event queue components from JAMES II (see [16]). We omit their implementation details here, as our focus is on ranking the components without further knowledge (the same holds for the simulator implementations). Altogether, this means there are 3 · 10 = 30 component combinations for SR and stoch-π, as well as 10 component combinations for SRS and PDEVS, summing up to 80 component combinations overall. We chose five models (or model parameterizations) for each of the four application domains (PDEVS, SR, SRS, and stoch-π). For PDEVS, we use the ForestFire model from [16] in five different sizes. For SR, we use three models discussed in [19] (two of which were originally proposed in [4]) and include two additional parameterizations of the linear chain system. For SRS, we use a trivial single-volume model, three models for diffusion in a 3 × 3 sub-volume grid, and a protein phosphorylation model (see [20]). For stoch-π, we use a simple benchmark model, three models of biological systems (genetic networks, ligand-receptor interaction), and one model of an ecological system (Lotka-Volterra). Con-
crete parameterizations that deviate from default parameters are shown in Figure 6, which displays the ranks of the event queues on the individual problems. We omit further details on the models for lack of space. Most importantly, Figure 6 illustrates that our problem set is diverse enough to make the ranking challenging. Note that in case of stoch-π and SR, where three simulators are used, an event queue’s rank is formed by considering its execution times with all three of them (see Equation 4), i.e., using 60 sampled execution times instead of 20 (as for SRS and PDEVS). The simulation stop time was chosen individually for each model, so that the fastest component combination would finish after a few seconds and the slowest combinations after about 30 seconds. However, there are combinations that are much slower on certain problems, so that execution was automatically aborted after 60 seconds of execution time. In these cases, 60 seconds was assumed to be the overall execution time of the setup at hand; as this happened quite rarely, the effect on the overall ranking should be negligible. As another (very) rare occasion, in case of an error in one of the components, the execution time of the combination was assumed to be the maximal Double value, i.e., the malfunctioning combination would receive the last rank.
4.1.3
TrueSkill Configurations
The parameters of TrueSkill, e.g., the prior skill distribution N (µ0 , σ0 ) of new players, the β parameter that characterizes how much a player’s performance is assumed to vary from game to game, and the τ value to increase the uncertainty after each game (see Section 2.2), may all strongly influence TrueSkill convergence and thus need to be tuned carefully to the application domain. For example, Nikolenko and Sirotkin use µ0 = 3000 and σ0 = 1000 [29, p. 606], in [14, p. 575]. We therewhereas µ0 = 25 and σ0 = 25 3 fore explore several TrueSkill configurations to investigate which parameter settings are suitable for rating simulation system components. The configurations varied in µ0 , σ0 , β, and τ over several orders of magnitude. Each configuration is confronted with the same randomly generated sequence of 10.000 component combination comparisons (i.e., game results). Every ten rounds, we count the number of inversions between the ranking currently assumed by the TrueSkill configuration and the true ranking (see Figure 6 and Section 4.1.1). In the beginning, the ten event queues are ranked randomly, i.e., their order is a random permutation (of a sorted list), so that the expected number of inversions is n(n−1) = 10·9 = 22.5 (e.g., [21, p. 16]). Over the sequence 4 4 of the comparisons, we expect the number to fall significantly below this value, the optimum being zero (meaning the true ranking has been learned). Due to the randomly generated sequence of component combination comparisons, this test setup is a stochastic experiment in itself. Thus, we replicated it five times. To also test TrueSkill in its ‘active mode’ (see Figure 5), we let it pre-select the component combinations to be compared for a (randomly drawn) simulation problem. For each round, the two component combinations with the largest uncertainty regarding their player’s ranks are selected, otherwise the setup is the same as described for the ‘passive’ mode above.
SR S: O SR nly S: Dif O fu SR nly sio S: Dif nC O fu e SR nly sio nte S: Dif nM r3x P fu 3 i SR hos sio x3x ph nW 3 S: o S St RST Pro ellS t oc t e h- st ein_ irre di d3x St Pi: ff1 oc Au 3 hd0 to re _K St Pi: oc Bi gu 10 h- sta lat 0_ bl or Ph St Pi: y e oc Lo 10 _G G e htk 0_ en n e a P P1 _V e_ tic St i: oc M 00 o N N h- gC lte et et 0_ rra wo wo 11 PD Pi: l2 rk rk x1 EV Sim 1x S: pl 11 PD Fo e_ EV re Lig S: stF an PD Fo ire d_ EV re R s (10 ec S PD : Fo tFire 0x1 ept o EV re 0 s (50 0) r S PD : Fo tFire x50 EV re ) s (60 S SR : Fo tFire x60 : C re ) s (70 y SR clic tFire x70 : L Ch ) in a (80 SR ear in S x80 : L Ch ys te ) in a SR ear inSy m : L Ch s in a te SR ear inSy m (6 C :T s 0 ot hai tem 1 s p all nS yIn ys (60 eci de tem 1 s es, p 1 pe nd (100 ecie 0.00 s, en 0 0 tS sp 2.0 ini t e ys te cie 00 i ial p s, m n 10 itia arti c l .0 00 par les) in tic iti l al es) pa rti cle s) Event Queues / Models CalendarQueue CalendarReQueue DynamicCalendarQueue MPLinkedList MList TwoList BucketsThreshold Heap LinkedList Simple
1
2
3
4
5
7
8
9
7 9 6 3 4 2 10 5 1 8
7 10 8 3 4 2 9 5 1 6
8 10 7 3 5 2 9 4 1 6
3 4 10 7 2 6 1 8 5 9
6 7 10 4 3 2 8 5 1 9
6 8 9 9 6 5 2 1 4 3 7
8 6 10 5 7 2 4 1 3 9
1 10 8 4 3 7 6 9 5 2
6 9 7 4 5 2 10 8 3 1
55
55
55
55
55
54
55
55
55
10 11 12 13 14 15 16 17 18 19 20 5 2 2 2 3 2 9 2 2 2 7 9 3 3 3 2 3 7 3 3 3 8 2 10 10 10 10 10 10 8 8 8 10 1 9 9 9 9 9 3 7 7 7 5 4 4 4 4 4 4 5 1 1 1 6 3 7 7 7 7 7 4 6 6 6 4 8 1 1 1 1 1 8 4 4 4 2 6 8 8 8 8 8 6 9 9 9 1 7 6 6 6 6 6 2 5 5 5 3 10 5 5 5 5 5 1 10 10 10 9 55
55
55
55
55
55
55
55
55
55
Sum 92 121 171 114 76 91 93 129 80 132
55
Figure 6: Component ranking per problem (ascending order; the smaller the better). Even the best event queue overall, the MList, is a bad choice for some problems (e.g., problem 7) and sub-optimal for almost all other problems, as it only ranks first for problems 17, 18, and 19. Apart from the mostly identical rankings for different instances of ForestFire and LinearChainSystem, the rankings are fairly diverse and thus the overall ranking, as determined by the overall sum of the ranks (right-hand side, see Section 4.1.1), is challenging to learn incrementally. 30
Results
The convergence results for our default TrueSkill configuration — using the default parameters from [14] but assuming the team performance to be the average of player performances — are shown in Figure 7. For clarity, we omit the standard deviation and only report the average number of inversions over five replications. The standard deviation usually varied between 0.5 and 2 inversions. As Figure 7 illustrates, TrueSkill is able to find a relatively accurate ranking over the first 1.000 game results, both in ‘active’ and in ‘passive’ mode. Somewhat surprisingly, the ‘active’ mode setup does not outperform the ‘passive’ mode setup. This rather counterintuitive result should be investigated by trying the heuristics proposed in [12]. The following analysis is focused on the ‘passive’ mode. After about 1.000 comparisons, the average quality of the ranking stabilizes and only slowly moves below five inversions. One reason for this may be the relatively challenging problem set: as shown in Figure 6, the overall rank sum of MList and LinkedList are quite close, as well as those of TwoList, BucketsThreshold, and CalendarQueue. Another reason for this seems to be that TrueSkill underestimates the performance variance of a player from game to game, which may be much larger for simulation components (which typically cannot adapt at runtime) than for human players (who typically can). The impact of β on ranking quality is shown in Figure 8. Clearly, the ranking quality is less noisy and generally better for larger values of β. In contrast to this, Figure 9 shows that increasing τ , i.e., the amount added to the uncertainty regarding a player’s skill for each game, reduces the ranking quality. This could also be due to the
Passive Mode Average Number of Inversions
4.2
Active Mode
25 20 15 10 5 0 0
1000
2000
3000 4000 5000 6000 7000 Component Combination Comparisons
8000
9000
10000
Figure 7: Quality of TrueSkill-based ranking over 10.000 component combination comparisons.
non-adaptivity of the components we considered. In fact, a value smaller than the default value achieved better results overall. Further experiments that varied µ0 , σ0 , or both have shown that these parameters have little impact on the average ranking quality in our test setup.
5.
CONCLUSIONS
In this paper, we propose to rank the individual components of component-based simulation systems with player rating systems. To do so, we re-implemented (see Section 3) and evaluated (see Section 4) the rating system TrueSkill [14], which allows to infer player skills from team perfor-
Average Number of Inversions
25.00
β = 0.83 β = 4.16
20.00
β = 83.3 β = 833.3
15.00
10.00
5.00
0.00 0
1000
2000
3000 4000 5000 6000 7000 Component Combination Comparisons
8000
9000
10000
Figure 8: Quality of TrueSkill-based ranking with = variations of β ∈ {0.8¯ 3, 4.1¯ 6, 83.¯ 3, 833.¯ 3}, with β = 25 6 ¯ 4.16 being its default value. 25
τ = 0.016
Average Number of Inversions
τ = 0.083 20
τ = 1.66 τ = 16.6
15
10
5
experiments (see Figure 5). To make further experimentation with component rating systems as simple as possible, our adapted re-implementation of TrueSkill, controllable via the generic interface discussed in Section 3.2, is available as open source software.3 Clearly, a ranking produced by a component rating system is not infallible, as it is inferred from relatively few input data (e.g., no model features are considered). It should hence be used as a fall-back mechanism to incrementally (i.e., over the execution of several simulation problems) identify poorly performing or highly domain-specific components at runtime and avoid their future selection as default components. One direction of future research could be to increase the data a rating system may observe, e.g., towards relative performance ratios — it does matter, after all, whether the second-ranked component combination is 1% slower than the best one, or if it is 100% slower. Such extensions, however, may require inference mechanisms that are much more computationally expensive than the one used by TrueSkill (see Section 3.3). Finally, the impact of the underlying assumptions TrueSkill makes, e.g., that player skills are normally distributed and that the performance difference between players is normally distributed as well (see [34] for a discussion on alternatives) should be investigated more closely, as these assumptions do not necessarily hold for all simulation system components. How much of a positive impact a component rating system will therefore have in practice, when deployed in regularly used systems for longer time periods, is still unclear.
Acknowledgments
0 0
1000
2000
3000 4000 5000 6000 7000 Component Combination Comparisons
8000
9000
10000
This research was supported by the DFG (German Research Foundation), via research grant EW 127/1-1 (ALeSiA).
6. Figure 9: Quality of TrueSkill-based ranking with 25 variations of τ ∈ {0.01¯ 6, 0.08¯ 3, 1.¯ 6, 16.¯ 6}, with τ = 300 = ¯ 0.083 being its default value.
mances. It meets our requirements for a component rating system (see Section 2.1) and is straightforward to use from within any simulation system with a notion of ‘components’ (see Section 3.2). For the evaluation, we considered its application to components of the open source modeling and simulation system JAMES II (see Section 3.1). We evaluated the approach via resampling from a data set that contains twenty simulation problems from four application domains, executed with 80 distinct component combinations. Our results (see Section 4.2) show that TrueSkill is able to converge relatively quickly (after about 1.000 comparisons) to a ranking that only contains about four inversions when compared to the true ranking. Afterwards, however, convergence is much slower. TrueSkill is also sensible with respect to its β and τ parameters. Without component rankings, developers and users working on new application domains cannot be guided in their choice of default components. Such rankings can be regarded as a knowledge base that allows us to transfer at least some performance knowledge from one application domain of a simulation system to another. Moreover, component rating systems can be used to steer performance analysis
REFERENCES
[1] S. Amasaki, Y. Takagi, O. Mizuno, and T. Kikuno. A bayesian belief network for assessing the likelihood of fault content. In Int’l Symposium on Software Reliability Engineering (ISSRE 2003), pages 215–226. IEEE, 2003. [2] P. Auer, N. Cesa-Bianchi, and P. Fischer. Finite-time analysis of the multiarmed bandit problem. Machine Learning, 47(2-3):235–256, 2002. [3] D. Barber. Bayesian Reasoning and Machine Learning. Cambridge University Press, Mar. 2012. [4] Y. Cao, H. Li, and L. Petzold. Efficient formulation of the stochastic simulation algorithm for chemically reacting systems. The Journal of Chemical Physics, 121(9):4059–4067, 2004. [5] O. Dalle. The OSA project: an example of component based software engineering techniques applied to simulation. In Proc. of the Summer Computer Simulation Conf., pages 1155–1162. SCS, 2007. [6] C. DeLong, N. Pathak, K. Erickson, E. Perrino, K. Shim, and J. Srivastava. TeamSkill: Modeling team chemistry in online multi-player games. In Advances in Knowledge Discovery and Data Mining, volume 6635 of LNCS, pages 519–531. Springer, 2011. [7] C. DeLong and J. Srivastava. TeamSkill evolved: Mixed classification schemes for Team-Based 3
See http://bitbucket.org/alesia
[8] [9]
[10]
[11]
[12]
[13]
[14]
[15]
[16]
[17]
[18]
[19]
[20]
[21]
[22]
[23]
multi-player games. In Advances in Knowledge Discovery and Data Mining, volume 7301 of LNCS, pages 26–37. Springer, 2012. R. Ewald. Automatic Algorithm Selection for Complex Simulation Problems. Vieweg + Teubner, 2011. R. Ewald, R. Schulz, and A. M. Uhrmacher. Selecting simulation algorithm portfolios by genetic algorithms. In Workshop on Principles of Advanced and Distributed Simulation (PADS), pages 48–56. IEEE CPS, 2010. M. Gagliolo and J. Schmidhuber. Learning dynamic algorithm portfolios. Annals of Mathematics and Artificial Intelligence, 47(3-4):295–328, August 2006. T. Graepel and T. Minka. Project Homepage: TrueSkill Ranking System. Microsoft Research. see http://research.microsoft.com/en-us/projects/ trueskill/ and http://atom.research.microsoft. com/trueskill/rankcalculator.aspx. S. Guo and S. Sanner. Multiattribute bayesian preference elicitation with pairwise comparison queries. In Advances in Neural Networks (ISNN 2010), volume 6063 of LNCS, pages 396–403. Springer, 2010. S. Guo and S. Sanner. Real-time multiattribute bayesian preference elicitation with pairwise comparison queries. In Proc. Int’l Conf. on AI and Statistics (AISTATS), 2010. R. Herbrich, T. Minka, and T. Graepel. TrueSkill(tm): A bayesian skill rating system. In Advances in Neural Information Processing Systems 19, pages 569–576. MIT Press, 2007. J. Himmelspach and A. M. Uhrmacher. Sequential processing of PDEVS models. In Proc. of the 3rd EMSS, pages 239–244, 2006. J. Himmelspach and A. M. Uhrmacher. The event queue problem and PDEVS. In SpringSim ’07 Proc., DEVS Integrative M&S Symposium, pages 257–264. SCS, 2007. J. Himmelspach and A. M. Uhrmacher. Plug’n simulate. In Proc. of the 40th Annual Simulation Symposium, pages 137–143. IEEE CS, 2007. K. Inoue, R. Yokomori, T. Yamamoto, M. Matsushita, and S. Kusumoto. Ranking significance of software components based on use relations. IEEE Transactions on Software Engineering, 31(3):213–225, Mar. 2005. M. Jeschke and R. Ewald. Large-scale design space exploration of SSA. In Computational Methods in Systems Biology, volume 5307 of LNCS, pages 211–230. Springer, 2008. M. Jeschke, R. Ewald, and A. M. Uhrmacher. Exploring the performance of spatial stochastic simulation algorithms. Journal of Computational Physics, 230(7):2562–2574, Apr. 2011. D. E. Knuth. The Art of Computer Programming, Volume 3: Sorting and Searching. Addison-Wesley Professional, 2nd edition, May 1998. F. R. Kschischang, B. J. Frey, and H. A. Loeliger. Factor graphs and the sum-product algorithm. IEEE Transactions on Information Theory, 47(2):498–519, Feb. 2001. A. LaMarca and R. E. Ladner. The influence of caches on the performance of sorting. In Proc. of the Annual
[24] [25]
[26]
[27]
[28]
[29]
[30] [31]
[32]
[33]
[34]
ACM-SIAM Symposium on Discrete Algorithms, pages 370–379. SIAM, 1997. A. Law. Simulation Modeling and Analysis. McGraw-Hill Publishing Co., 4th edition, 2006. S. Leye, M. John, and A. M. Uhrmacher. A flexible architecture for performance experiments with the pi-calculus and its extensions. In Int’l Conf. on Simulation Tools and Techniques, Mar. 2010. S. Meraji, W. Zhang, and C. Tropper. A multi-state Q-learning approach for the dynamic load balancing of time warp. In Workshop on Principles of Advanced and Distributed Simulation (PADS), pages 142–149. IEEE CPS, 2010. T. P. Minka. A family of algorithms for approximate Bayesian inference. PhD thesis, Massachusetts Institute of Technology, Jan. 2001. J. Moser. The math behind TrueSkill, 2010. see http://www.moserware.com/2010/03/ computing-your-skill.html, https://github.com/moserware/Skills. S. Nikolenko and A. Sirotkin. A new bayesian rating system for team competitions. In Proc. Int’l Conf. on Machine Learning (ICML), pages 601–608. ACM, June 2011. M. Odersky, L. Spoon, and B. Venners. Programming in Scala. Artima Inc, 2nd edition, Jan. 2011. R. Roshandel, N. Medvidovic, and L. Golubchik. A bayesian model for predicting reliability of software systems at the architectural level. In Software Architectures, Components, and Applications, volume 4880 of LNCS, pages 108–126. Springer, 2007. R. Stefani and R. Pollard. Football rating systems for Top-Level competition: A critical survey. Journal of Quantitative Analysis in Sports, 3(3), July 2007. R. Vitali, A. Pellegrini, and F. Quaglia. Autonomic Log/Restore for advanced optimistic simulation systems. In Proc. Int’l Symp. on Modeling, Analysis and Simulation of Computer and Telecommunication Systems (MASCOTS), pages 319–327. IEEE CS, 2010. R. C. Weng and C. J. Lin. A bayesian approximation method for online ranking. Journal of Machine Learning Research, 12:267–300, Feb. 2011.