1578
IEEE TRANSACTIONS ON BIOMEDICAL ENGINEERING, VOL. 53, NO. 8, AUGUST 2006
Evaluating Sleepiness Using Force Platform Posturography Edward O. Hæggström, Pia M. Forsman*, Anders E. Wallin, Esko M. Toppila, and Ilmari V. Pyykkö
Abstract—We have investigated the feasibility to use posturography as a method to estimate sleep deprivation. This manuscript presents a proof-of-concept of this idea. Twenty-one healthy subjects aged 20–37 years participated in the study. The subjects were deprived of sleep for up to 36 h. Their postural stability was measured as a function of sleep deprivation time. As a reference the critical fusion frequency method for measuring sleepiness was used. The 163 posturographic parameters used for analyzing the posturographic data were found from the literature. Of these parameters, the fractal dimension of the sway path, the most common frequency of the sway, the time-interval for open-loop control of stance, and the most common amplitude of the sway showed the highest linear correlations with sleep deprivation time. Using these four parameters we were able to estimate the sleep deprivation time with an accuracy better than 5 h for 80% of the subjects. Index Terms—Circadian rhythm, critical fusion frequency, posturography, sleep deprivation.
ponent depends on the sleep deprivation time. This component is high at the time of wake-up, but falls rapidly and gradually approaches a lower asymptote [7]. B. Established Methods for Measuring Sleepiness Methods already adopted for measuring sleepiness use critical fusion frequency (CFF) [11]–[18], minimum audible pressure [19], letter cancellation tasks [20], and questionnaires [6], [21]. The result obtained with these methods is dependent on cognitive actions taken by the subject. Results can be biased by learning or by compensating for the loss of sleep. Results can be negatively affected due to bored subjects and the social stress they are exposed to [1], [22], [23]. Another drawback is the time required to make the measurements, which ranges from 5 to 16 min in a dedicated environment [20]. C. A New Method for Measuring Sleepiness
I. INTRODUCTION
S
LEEPINESS due to sleep deprivation is a common cause of accidents [1]–[3]. A method for fast, simple and reliable monitoring of sleepiness would have significant impact among for example car drivers, truck drivers, and train drivers, air traffic controllers, pilots, and medical doctors [1]–[3]. There would be legal interest by government or work safety officials and monetary interest by insurance companies. In Finland, it has been calculated that the costs of sleep debt are almost 1 billion Euros a year [4]. In a French study where 67 671 car crashes were investigated 10% were due to driver fatigue [5]. A. Causes of Sleepiness Sleep deprivation is negatively correlated with performance. The most notable effects of the deprivation are increased sleepiness and reduced alertness [6]. The alertness level and duration of sleep are influenced by the circadian and the homeostatic rhythms. Sleepiness due to the circadian component is sinusoidal with an afternoon peak [7]–[10]. The homeostatic com-
Manuscript received October 8, 2004; revised February 5, 2006. The work of E. Hæggström was supported in part by the Wihuri-foundation and in part by the Academy of Finland. Asterisk indicates corresponding author. E. O. Hæggström and A. E. Wallin are with the Department of Physical Sciences, University of Helsinki, PL 64, FIN-00014 University of Helsinki (e-mail:
[email protected]). *P. M. Forsman is with the Department of Physics, Finnish Institute of Occupational Health, FIN-00250 Helsinki, Finland (e-mail:
[email protected]). E. M. Toppila is with the Department of Physics, Finnish Institute of Occupational Health, FIN-00250 Helsinki, Finland. I. V. Pyykkö is with the Department of Otolaryngology, University of Tampere, FIN-33014 Tampere, Finland. Digital Object Identifier 10.1109/TBME.2006.878069
One candidate for a rapid method to measure sleepiness is the measurement of postural stability. Neurophysiological measurements, such as quantitative posturography, are not influenced by training or motivation [6]. A posturographic measurement of sleepiness does not suffer from the aforementioned problems [25], since it is not dependent on active participation by the subject [24]. The relative rapidity and the capability to observe noncognitive action, makes posturography a potentially valuable method for sleepiness estimation. D. Previous Research and Motivation for a New Study To our knowledge, only four studies have been published on the relationship between postural stability and sleep deprivation related fatigue. The results have been somewhat conflicting. In 1994 Uimonen et al. measured the postural stability of 23 subjects prior to and after 24 h of sleep deprivation [25]. The postural stability was reported to be unaffected by the sleep deprivation. In 1995 Sato et al. [26] measured the postural stability of seven anesthesia doctors before and after an operation. Sato et al. recorded an increase in sway path and area, and reported an increased fatigue in 76% of the cases. In a study on the effects of caffeine in 12 sleep-deprived (36 h) subjects, Patat et al. [6] indicated similar results as Sato et al. Kohen-Raz et al. [3] measured the postural stability of eight doctors prior to and after an 8-h work shift, and reported an increase in the power and frequency of sway due to work and sleep deprivation. Additionally, Kohen-Raz et al. performed the same measurement sequence on the doctors during morning, afternoon, and night shifts, and concluded that the circadian rhythm influenced the postural stability. Three of the studies reported detectable effects of sleep deprivation on postural stability. However, no attempt to quantify
0018-9294/$20.00 © 2006 IEEE
HÆGGSTRÖM et al.: EVALUATING SLEEPINESS USING FORCE PLATFORM POSTUROGRAPHY
these changes was made, in order to assess the sensitivity of the method for possible utilization in sleep deprivation measurements. Moreover, Sato et al. and Kohen-Raz et al. reported on sleep deprivation periods that did not differ from a normal day at work, during which the stability was measured only twice: prior to and after a work shift. This provides little information on the effects of prolonged sleep deprivation, the progression of fatigue and the circadian rhythm. Finally, the relative impact of work was not controlled for, since the physicians were working between the measurements. This work might have been both physically and psychologically demanding. The results reported by Uimonen et al. might have been biased by the fact that their posturographic data was not corrected for the circadian rhythm. During a sleep deprivation period of 24 h, a circadian-related improvement in performance would possibly return the postural stability close to the same level as in the beginning of the deprivation period [6]. In a short 8-h study, as in Kohen-Raz et al., the nonmonotonous impact of the circadian is probably not very evident. There is a clear rationale for posturographically trying to evaluate sleepiness. The increase in the parameter values reported by Sato et al. and Kohen-Raz et al. could be explained by a reduction in the subject’s postural stability. To compensate for this reduction and to stabilize the body-sway, the subject stiffens his muscles by increasing the stochastic activity in the system [27]–[29]. Stiffening the muscles increases the time-constant of the body-sway. The change will be reflected as an increase of the path length as well as the area covered by the center of pressure (COP) trace. The increase in stochastic activity of the system will also increase the frequency of the sway. Albeit there are three studies reporting on detectable effects of sleep deprivation on postural stability, they made no attempt to assess the method sensitivity or to quantify the changes in the postural stability. If posturography is to be used to quantitatively determine sleep deprivation, one first needs to determine if the changes in human postural stability are large enough to produce reliable estimates of the subject’s sleep deprivation. Then, to answer the question whether posturography is accurate enough for practical applications one needs to determine the accuracy of the method. Measuring postural stability is, however, not a simple task. In our literature survey we found 163 different parameters used to evaluate the postural stability. Commonly used parameters are related to lengths, areas, velocities, and frequencies of the COP trace [30]–[36]. Toppila and Pyykkö suggested that a subject can select between several control strategies that are equally efficient, and that the postural control depends on the chosen strategy [37]. The adopted strategy is also age dependent [38]. These differences in individual strategies imply that the same set of posturographic parameters may not be optimal for evaluating sleepiness for all persons posturographically.
E. Purpose of the Study The purpose of this study was to investigate if posturography can be used as a method for evaluating sleepiness by estimating
1579
the sleep deprivation time. We set out to provide a proof-of-concept to validate this idea. To do this we need to find a posturographic parameter that correlates monotonically with sleep deprivation time. This again requires us to be able to extract the homeostatic component from the alertness level. We also need to show that the method provides reasonable estimation accuracy. II. MATERIALS AND METHODS A. Subjects The study group consisted of 21 subjects, 17 men and 4 women aged from 20 to 37 years. All the subjects were nonsmokers. None of them had suffered from a diagnosed balance disorder. They considered themselves healthy. Written consent was obtained from each subject before inclusion in the study. B. Sleep Deprivation, Test Schedule and Practice Intake of caffeine or alcohol was forbidden prior to the test for 12 h and 24 h, respectively. The subjects were asked to arrive rested to the test; a minimum of 8 h of sleep the night prior to the test was required. No attention was paid to the subjects’ history of stress. On the morning of the day that the test was performed, the subject was asked to record the time of wake-up. During the test the subjects were deprived of sleep for 30–36 h (loss of one night of sleep). To ensure continuous wakefulness an experimenter continuously supervised the subjects. Intake of tea or coffee was forbidden, but the subjects were provided with decaffeinated tea. No alcohol, exercise or heavy work was allowed. The subjects were asked to record the time for every meal they had. For all subjects, the test was initiated on Friday morning between 8 a.m. and 10 a.m. (duration Friday morning to Saturday afternoon) to allow for recovery sleep during Sunday. The starting times had been randomly assigned to the subjects the day before. The subjects were divided into three groups (due to laboratory capacity): six subjects during the 1st weekend, six during the second, and nine during the third weekend of our study. Data from the first weekend was designated training set, and data from the following weekends test set. The test schedule began as the subject arrived for the first measurement (between 8 and 10 a.m.). Both postural stability and CFF of the subject were measured every 2 h. Prior to the sleep deprivation, all subjects had been familiarized with the test routine in a separate practice session on the Wednesday before the actual test. Postural stability and CFF measurements were practiced until the subject felt comfortable and familiar with the test situation. This usually took less than 1 h. C. Posturographic Measurements The force platform for the posturographic measurements was built at the Finnish Institute of Occupational Health (FIOH) [39]. During the measurement the subject stood on the platform with his feet together and hands locked on the chest [31]. Marks were fixed at the center of the platform to aid the subject in positioning his feet. The stance of each subject was checked by
1580
IEEE TRANSACTIONS ON BIOMEDICAL ENGINEERING, VOL. 53, NO. 8, AUGUST 2006
the experimenter at each test occasion. The subject was asked to look at a fix-point (Ø 1 mm), attached at the height of his eyes, at a wall 33 cm in front of the platform. The duration of the measurement was 30 s. The signals were digitized (DT 9804, Agilent Technologies) with a sampling rate of 1 kHz. The raw data was centered by removing the arithmetic mean from the data points and filtered with a 0.3 s moving average filter, to remove offset and electronic noise [40]. D. CFF Measurements As reference method for the posturographic sleep deprivation measurement the CFF method was used. The reason for this choice was that the method reflects alertness, and serves as an index of cortical arousal, by measuring the ability to distinguish discrete sensory data [6]. Moreover, the sleep deprivation curves from the CFF measurements (see Appendix I ) show a similar diurnal feature as the core body temperature, which has been correlated to melatonin and cortisol concentration in blood [8]–[10]. CFF is the frequency at which the perception of flickering light is replaced by the perception of a continuous light signal. During the measurement the subject sat on a chair with his chin placed on a supportive stand, 30 cm in front of a light source, a red LED (Ø 5 mm) [41]. The LED was turned on intermittently at decreasing frequencies, from 40 to 30 Hz in 10 s. The LED was set to sweep this sequence six times. The subject was asked to fixate on the LED and press the button when he perceived the flicker. Data from the LED and button was sampled at 10 Hz. The score for the subject was the 30% trimmed average (the three largest and three smallest values discarded) from three repeated sequences (a total of 18 CFF values). This CFF value, in hertz, represented the sleepiness of the subject at the time of the measurement, including the effects of both the circadian and homeostatic rhythms. E. Analysis We calculated from the COP trace, independently of each other, 163 posturographic parameters, that evaluate the postural stability of a subject. These parameters represent different path lengths, areas, and sway frequencies. Each parameter was used to create a sleep deprivation curve for the subject: a total of 163 sleep deprivation curves per subject. In our study, with a sleep deprivation period of 36 h, the circadian rhythm was expected to affect both the posturographic (Kohen-Raz et al. [3]) and the CFF results. Deconvolving (i.e., point-by-point division of two vectors) the posturographic sleep deprivation curves with the CFF curves reduces the sine-shaped circadian feature, high-lighting the sleep deprivation trend in leaving a monotonic correlation between the postural stability and sleep deprivation time. In order to ascertain that the deconvolution of the posturographic curves with the CFF curve did not introduce a linear trend into the deconvolved posturographic curve we took three precautionary steps. 1) We checked that the posturographic curves contained a linear trend before convolution. 2) We filtered out any linear trend from the CFF curve prior to the deconvolution by detrending (subtracting from the vector its gradient). The convolution was then performed with this detrended CFF. 3) We recognized the fact that the deconvolved posturographic curve possessed a linear trend. Hence since the
detrended CFF curve contained no linear trend, we were sure that this nonlinear operation did not introduce a trend into the posturographic curve that was not there prior to the operation. The detrended CFF curve, and the posturographic curve deconvolved with this CFF curve are shown in Appendix I for subject . After this precautionary check we decided that regression lines could be fitted to the posturographic sleep deprivation curves deconvolved by the CFF curve to obtain the correlation between each parameter and the sleep deprivation time, . The posturographic data was analyzed with a Matlab program (version 6.1). 1) Training Set: In the training set analysis we calculated for each of the 163 sleep the linear correlation coefficient deprivation curves ( is the sleep deprivation parameter identification number running 1–163). Per subject we extracted the values and identified the corresponding paramfour highest eters . These extracted parameters, indicating which posturographic parameters showed the highest linear correlation (trend) with sleep deprivation time for a certain subject, were for the purpose of analysis defined as the “best individual parameters.” From these best individual parameters the “best overall parameters” were defined as the four parameters appearing with the highest repeatability. The repeatability was calculated as the ratio of the number of subjects for whom the parameter occurred, to the total number of subjects in the training set. Only these four best overall parameters were further analyzed in the test set. 2) Test Set: The purpose of the test set analysis was to merely predict the uncertainty of the posturographic method, i.e., the uncertainty we would face if we were to make an actual sleep deprivation estimation. We implemented the following procedure: a) For all subjects, calculate the sleep deprivation estimation accuracy (based on the 95% confidence interval (CI) of the regression line fitted to the individual sleep deprivation curves) for the four “best overall parameters” obtained in the training set along all measurement axes (i.e., lateral, anterior-posterior, and radius); b) For each subject, choose the parameter with the highest sleep deprivation estimation accuracy. Identify this as the “best” parameter for the subject, if the sleep deprivation estimation accuracy is less than or equal to our target accuracy, . We emphasize that the size of the CI in a) merely determines the accuracy of the method; the CI is not the sleep deprivation estimator. III. RESULTS A. Training Set Posturographic sleep deprivation curves with a signal-tonoise ratio larger than 10% were subject-wise screened for highest linear correlation with the sleep deprivation time. The “best overall parameters” were identified as the parameters with identification numbers 14, 60, 65, and 143, see Table I. Table I shows the occurrence of the four “best individual parameters” for subjects - in the training set. The numerals (unit-less) indicate the parameter identification number. The bolded identification numbers in the table are the “best overall parameters.” Parameter 14 is the fractal dimension of the COP, parameter 60 the most common frequency in the lateral plane, parameter 65
HÆGGSTRÖM et al.: EVALUATING SLEEPINESS USING FORCE PLATFORM POSTUROGRAPHY
1581
TABLE I “BEST INDIVIDUAL PARAMETERS” IN THE TRAINING SET
AF
Letters - identify the subjects. The unit-less numerals are the identification numbers of the posturographic “best individual parameters.” The bolded numbers are the “best overall parameters.”
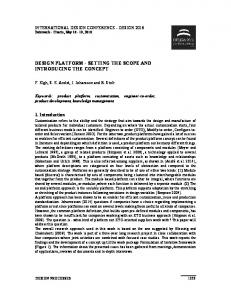
Fig. 2. The fractal dimension as a function of the sleep deprivation time after deconvolution for subject A. This is allowable since we have shown that the posturographic curve had a linear trend prior to the deconvolution, and that a posturographic curve deconvolved with a detrended CFF curve contains a linear trend (see Appendix I ). The linear correlation coefficient is R = 0:88. The solid line indicates the linear correlation with the sleep deprivation time.
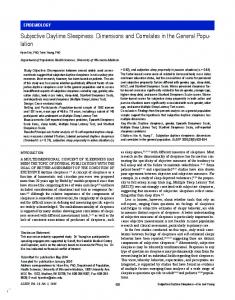
Table II. shows the sleep deprivation estimation accuracies for this bundled “best” parameter for subjects - . Our target accuracy, an accuracy better than 5 h was obtained for 80% of the measured cases. Fig. 1. The fractal dimension as a function of the sleep deprivation time prior to deconvolution for subject A. The linear correlation coefficient is R = 0:55. The solid line indicates the linear regression, which shows that there is a clear linear trend in the posturographic curve, the dashed line (inserted to facilitate visual inspection) the sine feature. This figure corresponds to step 1) [Section II-E].
0
the most common amplitude of the lateral sway, and parameter 143 is the critical time-interval during which stance is exerted by open-loop control. The mathematical definitions of the parameters are given in Appendix II. The repeatability of the parameters 14, 60, 65, and 143 was 50%, 50%, 33%, and 50%, respectively. The accuracy of these parameters was calculated from the 95% confidence intervals for the slope of the regression line that was fitted to the sleep deprivation curves. The mean accuracy of the parameters was , , , and . The correlation between the posturographic parameters and the sleep deprivation time improved and was considered monotonic after deconvolving the circadian component. Fig. 1 shows the sleep deprivation curve of the fractal dimension before the deconvolution for subject . The linear correlation coefficient . Fig. 2 shows the sleep deprivation curve after is deconvolution with the CFF curve. The linear correlation coef. ficient B. Test Set Only the “best overall parameters” were investigated in the test set analysis. The sleep deprivation estimation accuracy of these parameters along the measurement axes was calculated. Bundling these parameter accuracies, we defined the “best” parameter for the subject as the parameter with the highest sleep deprivation estimation accuracy (we call this calibrating).
IV. DISCUSSION A. Main Findings The posturographic measurement showed potential as a method to estimate sleep deprivation that is relatively fast to perform and that is sensitive in detecting the human circadian and homeostatic rhythms. The posturographic parameters that showed sleep deprivation estimation power were the fractal dimension, the most common frequency and most common amplitude of the sway, and the time-interval during which the stance is exerted by open-loop control. The proposed measurement method and our approach of data analysis worked with more than 80% of the subjects with an accuracy that was considered sufficient for practical purposes (5 h). B. Discussion of Method: CFF Deconvolution, Individual Screening and Subjects The analysis of the sleep deprivation data was split into a training and test set. The aim of the training set analysis was to screen the data for possible posturographic parameters sensitive to sleepiness. An individual approach, screening the data subject-wise, was chosen, based on Toppila and Pyykkö’s suggestion that subjects can select between several different postural control strategies [37], which might be reflected as different optimal parameters for different subjects. Based on the parameters found in the training set analysis, the aim of the test set was to find an individual approach and show that it works with a larger sample group. In this study, the subjects were deprived of sleep for up to 36 h. Our core assumption, that the postural stability is affected by the circadian rhythm, is supported by the findings of Kohen-Raz et al. [3] and Patat et al. [6]. A circadian induced increase in postural performance might counteract the deterioration caused
1582
IEEE TRANSACTIONS ON BIOMEDICAL ENGINEERING, VOL. 53, NO. 8, AUGUST 2006
TABLE II SLEEP DEPRIVATION ESTIMATION ACCURACY FOR THE INDIVIDUALLY “BEST” PARAMETER
GU
Letters - identify the subjects. The numbers are the sleep deprivation estimation accuracies in hours. The more accurate the sleep deprivation estimation is, the smaller . the value of
1t
by the sleep deprivation, the effects being additive at night. Removing the circadian component is, thus, necessary to have a monotonic and unambiguous correlation between the posturographic parameters with the sleep deprivation time. This correlation revelation is used in this study to show that the measurement concept works. Deconvolving the sine-shaped posturographic parameter curves with the sine-shaped CFF (i.e., posturographic sine+trend feature/CFF sine feature) reduced the circadian features, high-lighting the sleep deprivation trend. The deconvolving was an effort to separate the homeostatic and circadian effects. This was seen in the improved linear correlation coefficients after deconvolution. The sine, dashed curve, and trend features can be seen in Fig. 1 for posturographic data and in Appendix I for the CFF data. The existence of a trend in the raw data assures us that we do not artificially introduce a trend into the measurement results. However, we were not able to completely separate the homeostatic component and the circadian component from the diurnal rhythm. Thus, it is not clear how big relative impact the circadian and homeostatic components have on the posturographic parameters. In our 36 h sleep deprivation test the residuals of the circadian rhythm in the deconvolved posturographic curves did, after all, not mask the linear and unambiguous correlation with the sleep deprivation time. In addition to inter-subject differences in postural control strategies, as suggested by Toppila and Pyykkö [37], inter-subject differences in circadian rhythm (see Appendix I ) served as our motivation to select an individual approach when analyzing the posturographic data. The individual CFF curves indicated that the subjects reached their worst performance at different times of the day. This circadian offset induces an offset in the posturographic parameters, with respect to a certain time of the day, possibly aggravating a generalization of the method to use a single CFF curve (population mean) to deconvolve the individual posturographic data. Removal of the offset could, in principle, be done by finding a parameter that is sensitive to the homeostatic rhythm but not to the circadian rhythm (effectively removing the offset). If individual calibrating measurements can be performed many of the problems that decreased the intersubject performance (circadian rhythm, age, stance control, etc.) are alleviated. The subjects belonged, in order to reduce age-related variations in posturographic response to sleepiness, to a relatively homogenous group with respect to age. However, the postural control changes with age [38]. Thus, the best overall parameters in our study may not be the optimal ones for older or younger subjects. C. Discussion of Previous Work The four “overall best parameters” were identified by screening the data for parameters with the highest linear corre-
lation with the sleep deprivation time. The fractal dimension is a measure of the stochastic activity of the system, which is the apparently random movements in muscles. This finding of ours agrees with the findings of Collins et al. [27] and Nashner [28]. To compensate for the deterioration in postural stability, the subject stiffens his muscles by increasing the stochastic activity in the system. The increase in stochastic activity of the system will also increase the frequency of the sway, supported by the findings of Kohen-Raz et al. [3]. Increasing the stochastic activity increases the time-constant of the body-sway [27]–[29]. This change will be reflected as an increase in the path length as well as the area covered by the COP trace, as reported by Sato et al. [26]. The area covered was, however, not found to be one of the best overall parameters in our study. In our study COP traces covered a smaller sway area with sleepy subjects (not shown). We believe that the reason for the smaller area is that the subject does not feel comfortable with large sways when the feedback time is longer. He therefore uses a control strategy with smaller sway amplitudes. Screening the training set data for “individual best parameters” indicated that it might be difficult to find a single parameter describing sleepiness (see Table I). This is in agreement with Toppila and Pyykkö who stated that subjects can select between several control strategies [37]. The bundled set of parameters, however, showed potential to work on population level. This bundled parameter, comprising a set of four (classical) parameters, is a descriptive entity. D. Implications of the Results In the test set, the accuracy was better than 5 h (considered sufficient for practical purposes) with 80% of the subjects. The study indicates that the posturographic method works well ( ) when applied to the studied sample of individuals (population level). This accuracy is valid for sleep deprivations ranging from 2 h to 36 h. The offset between subjects could, however, not completely be removed by individual CFF calibrating since the deconvolution of the posturographic curve was performed with the test person’s own subjective CFF curve. The offset makes it hard to find a general posturographic parameter characterizing the sleepiness of every subject. The offset between subjects cannot be determined by a single measurement but only by measuring a whole diurnal posturographic curve. The presented method can, with no need for a simultaneous CFF measurement, be utilized for estimating sleep deprivation, provided the individual diurnal curve is known (and stored in a look-up table), in addition to the time of day when the sleep deprivation measurement is performed. An estimation algorithm is presented in Appendix III . The estimation efficiency of the algorithm has not been investigated within the scope of this paper.
HÆGGSTRÖM et al.: EVALUATING SLEEPINESS USING FORCE PLATFORM POSTUROGRAPHY
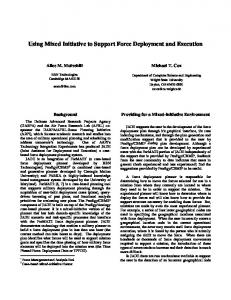
Fig. 3. The CFF as a function of sleep deprivation time for subject A (squares). The curve with the circles is the detrended CFF curve for the same subject. The detrended sinusoid in the figure corresponds to step 2) [Section II-E].
1583
Fig. 4. The fractal dimension as a function of the sleep deprivation time, deconvoluted with the detrended CFF in Fig. 3, for subject A. This corresponds to step 3) [Section II-E]. The linear correlation coefficient is R = 0:14. The solid line indicates the linear regression, which shows a linear trend in the posturographic curve. There is still a sinusoidal component that we were not completely able to remove.
0
E. Further Study In our study no attention was paid to malingering, stress, history of sleep deprivation or changes in lifestyle. As these factors could affect the postural stability [42], the correlation between these and sleepiness should be checked, for example with a questionnaire. By asking the subject to simulate dizziness or vigilance, the effects of malingering as a function of the sleep deprivation time can be investigated [42]. Our study was conducted on nonsmoking subjects, free from drugs and alcohol. Drugs and alcohol affect the postural stability [2], [22], [36]. If the effect of these stimulants is unlike the effect of sleepiness, or if the momentary concentration in the blood is known, sleepiness could also be measured for individuals affected by drugs and alcohol.
lowest CFF scores in the wee hours, an improvement in performance during the morning and early afternoon was seen. The phase difference in reaching the lowest CFF performance, up to 7 h between the subjects, was due to the circadian rhythm. The offset was determined by comparing the temporal instant when the curves reached their minimum. Fig. 4 shows the sleep deprivation curve after deconvolution with the detrended CFF curve in Fig. 3. The linear correlation . coefficient is APPENDIX II The fractal dimension (parameter 14) of the COP is defined as
V. CONCLUSION We have investigated posturography as a candidate for a fast and sensitive noncognitive method for measuring sleep deprivation time. We have presented a proof-of-concept of this idea. We found four posturographic parameters sensitive to both circadian and homeostatic rhythms of the subjects. These parameters, which worked for 80% of the subjects, measured sleep . This accuracy is deprivation time with an accuracy of valid for sleep deprivations ranging from 2 h to 36 h. The single parameter estimates improved with parameter bundling. Posturography shows promise as a method to determine sleep deprivation. APPENDIX I Fig. 3 shows the CFF during the sleep deprivation period for subject (squares), and the de-trended CFF curve (circles) exhibiting a circadian sinus rhythm for this subject. Zero hours (0 h) correspond to the wake-up time of the subject. For all subjects there was a trend of deterioration in the CFF performance as a function of the sleep deprivation time. The worst performance was reached 20–27 h after wake-up. This corresponds to 2–9 a.m., depending on the subject. After the
(1) where
(2) and for a given (spanning data intervals), is the total number of points and and are the positions in lateral and anterior-posterior directions of the COP, respectively. The most common frequency (parameter 60) is defined as the for which the power spectral density energy of frequency the COP trace reaches its maximum (3) where the power spectral density is (4)
1584
IEEE TRANSACTIONS ON BIOMEDICAL ENGINEERING, VOL. 53, NO. 8, AUGUST 2006
and
[6] A. Patat, “Effects of a new slow release formulation of caffeine on EEG, psychomotor and cognitive functions in sleep-deprived subjects,” Hum. Psychopharmacol. Clin. Exp., vol. 15, pp. 153–170, 2000. [7] T. Akerstedt and S. Folkard, “Predicting duration of sleep from the three process model of regulation of alertness,” Occupat. Environ. Med., vol. 53, no. 2, pp. 136–141, 1996. [8] E. Klerman, D. Goldenberg, E. Brown, A. Maliszewski, and G. Adler, “Circadian rhythms of women with fibromyalgia,” J. Clin. Endocrinol. Metab., vol. 86, no. 3, pp. 1034–1039, 2001. [9] T. Wehr, D. Aeschbach, and W. Duncan, Jr, “Evidence for a biological dawn and dusk in the human circadian timing system,” J. Physiol., vol. 535, no. 3, pp. 937–951, 2001. [10] D. Aeschbach, “Two circadian rhythms in the human electroencephalogram during wakefulness,” Am. J. Physiol., vol. 277, no. 6, pp. R1771–R1779, 1999. [11] “Fatigue tester (for eyes),” Elector. (Elector Electron.), vol. 10, no. 7-8, pp. 7–75, 1984. [12] T. Hosokawa, T. Makizuka, K. Nakai, and K. Saito, “A new pockettype flicker apparatus,” Sagyo Igaku, vol. 31, pp. 324–329, 1989. [13] M. Ogata, H. Osaki, and S. Kikuchi, “Simultaneous individual measurements of fatigue by a flicker recognition apparatus using light emitting diode as the light source,” Ergonomics, vol. 20, no. 4, pp. 425–428, 1977. [14] H. Osaki, S. Kikuchi, and M. Ogata, “The flicker control chart method,” Ergonomics, vol. 19, no. 5, pp. 639–644, 1976. [15] ——, “The flicker control chart method,” Ergonomics, vol. 19, no. 5, pp. 639–644, 1976. [16] A. Raninen, The effect of sampling density and luminous flux on temporal resolution and flicker sensitivity across the human visual field. Helsinki, Helsinki Univ., Dept. Psychol., 1992, Ph.D. dissertation. [17] C. Strömberg, Psychomotor Performance and Sedation: Human and Animal Experiments with Atypical Antidepressants and Ethanol. Helsinki, Finland: C. Strömberg, 1988. [18] M.-L. von Post-Lingen, An Experimental Study of the Effect of Carbon Monoxide on Critical Flicker Fusion and Evipan Tolerance Tests in Healthy Persons. Örebro, Sweden: Örebro Univ. Press, 1962. [19] M. Takeda, “Basic study on the measuring of fatigue by the minimum audible pressure,” Ergonomics, vol. 35, no. 5-6, pp. 637–646, 1992. [20] M. Casagrande, C. Violani, G. Curcio, and M. Bertini, “Assessing vigilance through a brief pencil and paper letter cancellation task (LCT): Effects of one night of sleep deprivation and the time of day,” Ergonomics, vol. 40, no. 6, pp. 613–630, 1997. [21] H. Yoshitake, “Relations between the symptoms and the feeling of fatigue,” Ergonomics, vol. 14, no. 1, pp. 175–186, 1971. [22] P. Holliday and G. Fernie, “Changes in measurement of postural sway resulting from repeated testing,” Agressologie, vol. 20, no. 4, pp. 225–228, 1979. [23] E. Poulton, G. Hunt, A. Carpenter, and R. Edwards, “The performance of junior hospital doctors following reduced sleep and long hours of work,” Ergonomics, vol. 21, no. 4, pp. 279–295, 1978. [24] W. Nienstedt, O. Hänninen, and A. Arstila, Människans Fysiologi och Anatomi (in Swedish). Stockholm, Sweden: Liber AB, 1988, p. 367. [25] S. Uimonen, K. Laitakari, R. Bloigu, and M. Sorri, “The repeatability of posturographic measurements and the effects of sleep deprivation,” J. Vestib. Res., vol. 4, pp. 29–36, 1994. [26] O. Sato, “Fatigue and stress of anesthesiologists at work–Third report: Investigation with a flicker photometer and a stabilo-meter,” Masui, vol. 44, no. 5, pp. 674–678, 1995. [27] J. Collins, C. De Luca, A. Burrows, and L. Lipsitz, “Age-related changes in open-loop and closed-loop postural control mechanisms,” Exp. Brain Res., vol. 104, pp. 480–492, 1995. [28] L. Nashner, “A model describing vestibular detection of body sway motion,” Acta Otolaryng., vol. 72, pp. 429–436, 1971. [29] G. McCallum and T. Leen, “Form and exploration of mechanical stability limits in erect stance,” J. Mot. Behav., vol. 21, pp. 225–244, 1989. [30] T. Prieto, J. Myklebust, R. Hoffmann, E. Lovett, and B. Myklebust, “Measures of postural steadiness: Differences between healthy young and elderly adults,” IEEE Trans. Biomed. Eng., vol. 43, no. 9, pp. 956–966, Sep. 1996. [31] T. Prieto, J. Myklebust, and B. Myklebust, “Characterization and modeling of postural steadiness in the elderly: A review,” IEEE Trans. Rehabil. Eng., vol. 1, no. 1, pp. 26–34, Mar. 1993. [32] L. Chiari, A. Bertani, A. Cappello, S. Cavalcanti, and R. Piperno, Intra-Subject Repeatability of Posturographic Parameters 2001 [Online]. Available: http://www-bio.deis.unibo.it/Staff/Lorenzo/Esb.pdf [33] S. Araki, K. Yokoyama, and K. Murata, “Neurophysiological methods in occupational and environmental health: Methodology and recent findings,” Environ. Res., vol. 73, pp. 42–51, 1997.
(5) The most common amplitude of the sway (parameter 65) is weighted so that a smaller sway is given less weight than large sway and is calculated by
(6) where is the number of data with the same amplitude , that . is the frequency by which is present is in the data, and is the total number of datapoints. The length of the time-interval during which the stance is exerted by open-loop control (parameter 143) is defined by
(7) The constants and coefficients are obtained from the regression line in a -plot. and are obtained for a regression where s, and for a regression where s. APPENDIX III Our algorithm to determine the sleep deprivation time from a single PS measurement is as follows.1) Use the best (i.e., most accurate) PS parameter for the person (found with the method described in the Test set section). 2) Use the diurnal PS curve of this subject as a “look-up table.” 3) Perform a PS measurement and record the time of the test (e.g., 11 am). 4) From the “look-up table,” first find the corresponding time of the test (in this example 11 am). Second, from this point in the table, extract the PS value that differs the least from the PS measurement result. 5) Determine the sleep deprivation time estimate correas uncertainty. sponding to the extracted PS value. 6) Use ACKNOWLEDGMENT The authors thank the volunteers that participated in the sleep deprivation tests. REFERENCES [1] R. Meddis, , E. Burton, Ed., “Cognitive dysfunction following loss of sleep,” in The Pathology of Cognition. London, U.K.: Methuen, 1982, pp. 224–252. [2] L. De Gennaro, M. Ferrara, L. Urbani, and M. Bertini, “Oculomotor impairment after 1 night of total sleep deprivation: A dissociation between measures of speed and accuracy,” Clin. Neurophysiol., vol. 111, pp. 1771–1778, 2000. [3] R. Kohen-Raz, M. Himmelfarb, S. Tzur, A. Kohen-Raz, and Y. Shub, “An initial evaluation of work fatigue and circadian changes assessed by multiplate posturography,” Percept. Mot. Skills, vol. 82, pp. 547–557, 1996. [4] M. Hyyppä and E. Kronholm, Uni ja Vire (in Finnish). Jyväskylä, Finland: Gummerus Kirjapaino Oy, 1998. [5] P. Philip, F. Vervaille, P. Le Breton, J. Taillard, and J. Horne, “Fatigue, alcohol, and serious road crashes in france: Factorial study of national data,” BMJ, vol. 322, pp. 829–30, 2001.
HÆGGSTRÖM et al.: EVALUATING SLEEPINESS USING FORCE PLATFORM POSTUROGRAPHY
[34] L. Chiari, A. Cappello, D. Lenzi, and U. D. Croce, “An improved technique for extraction of stochastic parameters from stabilograms,” Gait Posture, vol. 12, pp. 225–234, 2000. [35] J. van Parys and C. Njikiktjien, “Romberg’s sign expressed in a quotient,” Agressologie, vol. 17B, pp. 95–100, 1976. [36] H. Diener, J. Dichgans, M. Bacher, and B. Gompf, “Quantification of postural sway in normals and patients with cerebellar diseases,” Electroencephalogr. Neurophysiol., vol. 57, pp. 134–142, 1984. [37] E. Toppila and I. Pyykkö, “Chaotic model of postural stability – A position and velocity dependent system?,” Automedica, vol. 19, pp. 115–34, 2000. [38] I. Pyykkö, “Determination of parameters for computing postural stability,” Automedica, vol. 19, pp. 39–62, 2000. [39] T. Tossavainen, “Postural control as assessed with virtual reality,” Acta Otolaryngol., no. Suppl. 545, pp. 53–56, 2001. [40] H. Aalto, Force platform posturography. methodological aspects and practical applications. Helsinki, Finland, Helsinki Univ., Dept. Otolaryngol, and Dept. Phys., 1997, Ph.D. dissertation. [41] P. Nyman, “Plattformstabilometribaserad Trötthetsmätning,” M.S. thesis, Helsinki Univ., Dept. Phys. Sci., Helsinki, Finland, 2001. [42] S. Uimonen, K. Laitakari, H. Kiukaanniemi, and M. Sorri, “Does posturography differentiate malingerers from vertigous patients?,” J. Vestib. Res., vol. 5, no. 2, pp. 117–124, 1995. Edward Hæggström received the D.Sc. degree in applied physics from the University of Helsinki, Helsinki, Finland, in 1998, and the MBA degree in innovation management from the Helsinki University of Technology, in 1998 and 2001, respectively. He was a visiting scholar at E.L. Ginzton Laboratory, Stanford University, CA, from 2002 to 2003, and a Project Leader at CERN, Geveva, Switzerland, from 2004 to 2005 while on leave from his position as Assistant Professor at the Department of Physical Sciences, University of Helsinki. His principal research interests are within ultrasonics and instrumentation.
Pia Forsman received the Ph.Lic. degree in applied physics from the University of Helsinki, Helsinki, Finland, in 2005. She is currently working towards the Ph.D. degree in the Department of Physics at the Finnish Institute of Occupational Health, Helsinki. Her research is focused on modeling postural stability. She is a Researcher with the Department of Physics at the Finnish Institute of Occupational Health. Her research is focused on modeling postural stability.
1585
Anders Wallin received the M.Sc. degree in applied physics in 2002 from the University of Helsinki, Helsinki, Finland. His current research, at the University of Helsinki, Finland, involves biophysical applications of optical tweezers, funded by the Finnish National Graduate School of Nanosciences.
Esko Toppila received the Ph.D. degree from the Department of Physics, University of Helsinki, Helsinki, Finland, in 2000. He is an Associate Professor, with the Department of Physics, Finnish Institute of Occupational Health, Helsinki. His research interests include modeling of the inner ear function, modeling the development of noise induced hearing loss and balance control, and modeling the biological causes of cochlear damage.
Ilmari Pyykkö received the Ph.D. degree from the Faculty of Medicine, University of Helsinki, Helsinki, Finland, in 1974. He was a Professor at the University of Helsinki from 1990 through 1995, Professor and head of the Department of Otolaryngology, Karolinska Institutet, Stockholm, Sweden, from 1995 through 2002. He is Professor and head of the Department of Otolaryngology, University of Tampere, Tampere, Finland. He is a medical doctor specialized in ear, nose, and throat diseases and works in the clinical field. His main research interests are vestibular testing, inner ear disorders, and falls in elderly, on which he has published about 500 papers.