The Customs and Border Protection (CBP) organization must secure the homeland by preventing ... We may directly apply this to SoS in that a requirement.
Available online at www.sciencedirect.com
Procedia Computer Science 16 (2013) 631 – 638
Eds.: C.J.J. Paredis, C. Bishop, D. Bodner, Georgia Institute of Technology, Atlanta, GA, March 19-22, 2013.
Evaluating the Allocation of Border Security System of Systems Requirements David Flanigana, Dr Peggy Brouseb a
The Johns Hopkins University Applied Physics Laboratory, 11100 Johns Hopkins Road, Laurel, MD 20723, USA b George Mason University, 4400 University Drive, Fairfax, VA 22030, USA
Abstract The Customs and Border Protection (CBP) organization must secure the homeland by preventing illegal entry into the United States. In order to successfully accomplish this task, a System of Systems (SoS) of airborne, ground, fixed, mobile, manned, and unmanned capabilities must act together in order to successfully accomplish the objective. However, it may be difficult to identify a specific SoS configuration that will meet the objective and quantify the requirements allocated for each specific system. This paper offers a methodology to evaluate the SoS phases to detect, track, identify, decide, act, and assess the actions of CBP forces. This methodology is exercised to quantify the system contributions to the CBP SoS and the interfaces needed for each system.
© 2013 Published by Elsevier B.V.B.V. © 2013The TheAuthors. Authors. Published by Elsevier Selection and/or under responsibility of Georgia Institute of Technology Selection and/orpeer-review peer-review under responsibility of Georgia Institute of Technology. System of Systems, System Methodologies
1. Introduction Requirements are often the largest source of variability and unknown quantities at the start of traditional systems engineering projects. From a System of Systems (SoS) perspective, increased difficulty is added with multiple systems and independently managed program offices whose efforts need to be coordinated in order to achieve the SoS objectives. Without sufficient guidance, there will be a failure to adequately identify and allocate requirements to constituent systems for their respective program office to manage. Our motivation for this paper is to develop a SoS requirements engineering (RE) process to quantify the requirements on constituent systems. 2. Background
1877-0509 © 2013 The Authors. Published by Elsevier B.V. Selection and/or peer-review under responsibility of Georgia Institute of Technology doi:10.1016/j.procs.2013.01.066
632
David Flanigan and Peggy Brouse / Procedia Computer Science 16 (2013) 631 – 638
A literature search on existing and previous requirements engineering processes was conducted in order to evaluate SoS RE processes and allocations. Also included in the literature search were the concepts of resiliency from a SoS perspective, in order to understand how these requirements may be allocated to constituent systems. Existing traditional systems engineering standards (ISO-15288 [1], IEEE-1220 [2], IEEE-1223 [3], and EIA-632 [4]) were reviewed for requirements allocation techniques, but they contained no specific guidance on SoS requirements allocation processes. The literature of system resiliency was reviewed in order to evaluate their implications on SoS requirements allocation. Madni and Jackson define a conceptual framework for resilience engineering, and identify several motivations for why resilience is needed in response to types of disruption: operational contingencies may cause systems to fail, natural disasters may cause disruption, terrorism or instability may influence system operational environments, and financial environment meltdowns may affect operations [5]. Jackson develops architecture of system resilience, identifying capabilities and infrastructure as two components that could enable resilience [6]. He identifies the multiple-system dependence on outputs from the preceding system that may affect the SoS performance. Outputs from an individual system may be uncertain and thus may cause an emergent (or unpredictable) output in the final outcome [6]. We may directly apply this to SoS in that a requirement levied upon one system could cause positive or negative repercussions to the following system and ultimately the SoS execution of a mission. Erol et al. examines four properties when evaluating system resilience: definition of the system boundary, identification of the specific components, examination of the component and element relationships, and definition of the system environment interactions [7]. We may extend this analogy to SoS by replacing component with system, in order to examine how a SoS may behave by examining how SoS requirements may be affected. Pflanz explores the effect of resiliency on command and control architectures within his dissertation. Within his exploration of several command and control examples, he models the system processes, information flows, and system interfaces in order to assess the system performance as it adjusts to disruptive events and performs system recovery [8]. We emulate his approach in utilizing our SoS architecture artifacts in order to describe the structure and evaluate initial requirements allocations to constituent systems. These SoS outcomes may then serve as an indicator of whether our allocation was correct or not, and serves to identify particular system requirements that contribute to a satisfactory SoS performance. There are three notable examples of using architectures to describe SoS performance and behavior that relate to our topic. The first example is the Department of Defense SoS Guide [9] that provides a framework in which to define the types of SoS, as well as addressing SoS requirements that begin with the understanding of individual systems and their needs. The second example from Adams and Meyers [10] analyzes the US Navy carrier strike group as a SoS, comprised of dissimilar platforms working together to achieve a common objective, which is similar to our approach. The final example from Schuck [11] is the description of a SoS to conduct surveillance and monitoring for national parks, extending the enterprise architecture into the activities, components, and information exchanged. 3. Description of SoS RE Process We offer a three step approach to the SoS RE process in order to adequately capture and document the ability to allocate requirements to the system level. The three main metrics with which we can measure SoS performance are: operational reach, system contributions to the SoS, and system-system interactions throughout the SoS. The operational reach measures the effective range and extent of the SoS activities while it executes the mission, from start to finish. The system contributions indicate the percentage of time that a particular system is active throughout the SoS mission (and also within which SoS phase it is active), indicating a critical system that may require redundancy in order to ensure the SoS mission is successfully executed. The system-system interactions (also referred to as SoS network usage) are also calculated in order to identify the number of interactions that a system may require during the SoS mission. This may provide insight into the required network performance for the entire SoS, and also identify which system requires interactions at a critical SoS phase. The three-step process is as follows: Step 1 identifies the scope of the SoS to the relevant constituent systems in order to specify which systems will be analyzed. Step 2 allocates SoS requirements to the systems in a three-part sub process. Step 2a decomposes the SoS objective into distinct SoS phases of operations, and identifies the
David Flanigan and Peggy Brouse / Procedia Computer Science 16 (2013) 631 – 638
633
relevant systems participating in each phase. Step 2b identifies the frequency of use that each SoS phase is operating. Step 2c calculates the system-system interactions within each of the SoS phases through a series of adjacency matrices. Step 3 assesses the SoS mission through an executable model of the SoS architecture artifacts in order to evaluate our three SoS metrics.
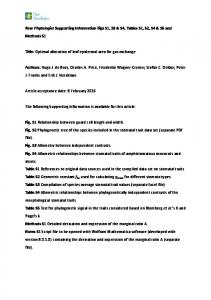
4. Case Study of SoS RE Process This case study examines the Customs and Border Protection efforts to monitor and respond to border incidents as a SoS. It is referred to as a SoS due to the multiple systems under its scope to perform the assigned mission that could be comprised of fixed and mobile surveillance sensors, manned and unmanned aircraft, and manned and unmanned ground vehicles to respond to border incursions [12]. This case study will utilize the SoS requirements allocation process in a predictive manner for a yet to be built SoS, where top-level requirements have not been fully developed and allocated. Step 1 - scope the case study to the immediate CBP assets. This is based on the CBP identification of three main operating environments: urban, rural, and remote, which are in increasing distance from the border point of interest. For the purpose of this case study, we will focus on the remote environment that may require several minutes to several hour response times. Systems described in our border surveillance concept include a command and control unit, fixed surveillance towers, communications towers, patrolling agents in vehicles, and patrolling agents on foot. The effects of a fixed and mobile surveillance source are also represented in the SoS analysis. The target for this case study may be embarked in vehicles, horseback, or on foot, and can travel a direct or indirect path from an unknown starting region to various points on the border. Step 2 - allocate SoS requirements to constituent systems. As SoS requirements are defined, individual system contributions and interfaces are identified in order to meet these SoS requirements. The approach in this step is to decompose and quantify the SoS functions to the system level for each of the CBP SoS mission phases. This second step is further defined as follows. Step 2a Decompose the main SoS objective into SoS phases: as the SoS executes its mission, there will be multiple phases that it will progress through towards completion. We leverage the functional phase description by CBP in their Integrated Fixed Towers (IFT) system development effort: detect/track, identify/classify, respond, and resolve [13]. We will utilize this functional flow to describe the CBP SoS activities as it performs its mission. Step 2b Identify the frequency of usage of each SoS phase. We develop an initial bounding scenario for the CBP SoS mission area to compute the frequency of each SoS phase duration. In order to calculate this phase allocation, an example target path was initialized at the beginning of the scenario, with surveillance towers performing the initial detection / tracking, and then conducting classification / identification functions. At this point, vehicles are sent to intercept the target during the response phase. When the target is intercepted, the resolve phase and the scenario come to an end. Within an example setup for a starting target range of 30 NM, target speed of 15 mph, tower surveillance sensor range of 30 NM, intercept vehicle location located at the border with a 15 mph intercept speed, we can calculate our SoS phases as: detect/track: 57%, identify/classify: 36%, respond: 24%, resolve: 10%. These example phase allocations are intuitive since the majority of a surveillance problem is spent during the detection and identification phases in order to surveil a large area of territory surrounding the defended area. Step 2c - Calculate system-system interactions within each of the SoS phases. We now need to identify the different system-system interfaces within each of the SoS phases. Figure 1 provides a set of adjacency matrices for the CBP SoS example based on the functional description of the four SoS phases. We generate these matrices in order to document the presence and direction of system-system interface within each of the SoS phases. Directionality is important due to the possibility that each interface may not be bimatrices enter into the calculations to the SoS network usage, described in the following pages and contribute towards the development of Tables 3 and 4.
634
David Flanigan and Peggy Brouse / Procedia Computer Science 16 (2013) 631 – 638
Fig. 1. CBP SoS adjacency matrices for the border surveillance mission area
Step 3 - Assess the SoS requirements allocation among their constituent systems. For the CBP SoS mission area, we calculate the SoS attributes and system-level requirements allocation process in addition to evaluating our hypotheses. The following factors were modified: surveillance tower sensor range, number of towers, number of patrol vehicles, and target speed. Each factor was given three levels, resulting in 729 unique SoS configurations. If the CBP SoS configuration could not intercept the threat prior to it reaching its objective, the SoS configuration was considered to fail to perform the CBP mission. Table 1 provides the factors and levels for the border surveillance mission analysis. These were notional values based on US Customs and Border Protection Integrated Fixed Tower statement of objective values and interviews with CBP subject matter experts familiar with related analysis problems. The range of values were chosen to represent a variety of current and projected capabilities. Table 1. Full factorial setup for the border surveillance mission Factor
Level
Descriptive metric
Surveillance tower sensor range
5, 15, 50
Measured in NM
Number of surveillance towers
1, 3, 5
Measured in quantity
Number of intercept vehicles
2, 4, 7
Measured in quantity
Intercept vehicle speed
5, 15, 30
Measured in mph
Target speed
5, 15, 30
Measured in mph
Vehicle starting position
0, 15, 30
Measured in NM
Within each of the configurations, a series of target routes were evaluated in order to represent the variability of the target starting and ending point and the CBP SoS was evaluated over the entire range of possible routes. The target routes were calculated by the use of nine discrete starting and ending points, resulting in a total of 81 different trajectories that varied from a straight-line trajectory towards the objective to a cross-wise path. The SoS mission is then executed in a time-stepped fashion, where the systems transit towards their objectives, and logical decision steps are evaluated to when the SoS phases may start and stop. The sequence of events during the mission execution starts with the movement of the target towards its objective.
David Flanigan and Peggy Brouse / Procedia Computer Science 16 (2013) 631 – 638
635
The range from the surveillance towers to target are checked to determine when the SoS detect/track or classify/identify phases are started and stopped to transition to the next phase. One the classify/identify phase is complete, the CBP vehicle heads towards the target in a direct intercept course during the response phase. When the vehicle reaches the resolve range to the target, the scenario ends and the intercept point is recorded as a success. If the target reaches its objective, the SoS run is considered a failure. Data in terms of final range of target to border, time of SoS phase duration, and number of system-system interactions are recorded for post-processing calculations. When the scenario has completed (either ending in success or failure), the SoS metrics are calculated to determine the SoS operational reach, the percentage of system usage, and percentage of system exchange of data compared to the total interactions sent. The full factorial is executed to each set of 81 target paths to evaluate how the SoS performs. From the analysis, we may be able to identify the critical system attribute(s) that contribute to two metrics: SoS operational reach and the percentage of the 81 target paths that were successfully intercepted, which are provided in Table 2. Table 2. Summary of critical factors in the CBP SoS mission area analysis SoS Operational Reach
SoS Percentage Coverage
Tower sensor range,
Tower sensor range,
Tower sensor range * Target speed,
Target speed,
Tower sensor range * Vehicle speed,
Vehicle speed,
Target speed,
Tower sensor range * Target speed,
Vehicle speed,
Tower sensor range * Vehicle speed,
Vehicle speed * Target speed
Vehicle speed * Target speed, Vehicle start position
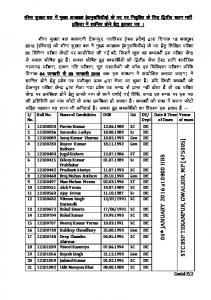
The most significant factor(s) to influence the SoS operational reach are the Tower sensor range, which is to be expected as this factor drives the initiation of the SoS functions to intercept the inbound targets. Note the longer sensor range may be representative of an airborne sensor stationed forward of the border. The earlier the problem may be started for the CBP SoS, it is intuitive that the CBP SoS would achieve greater success. However, other combinations of factors to include tower sensor range and intercept vehicle speeds also contribute to the SoS operational reach, which is intuitive since the earlier the intercept initiation and the faster the intercept vehicle, the greater the SoS operational reach. The most significant factor(s) to influence the SoS percentage coverage are the Tower sensor range, and is also expected as this factor initiates the SoS functions. It was surprising to note that the number of towers and number of vehicles did not provide as large of a significant contribution to the coverage of the multiple target routes as expected. This may lead to an evaluation of alternative requirements for the CBP to not invest heavily in a large vehicle interceptor force in order to provide sufficient coverage. Figure 2 provides an overall plot of all 59,049 number of SoS configurations from the entire full factorial. The indicates the target start and stop points, and the green diamonds indicate the initiation of vehicles sent to intercept the target. Table 3 provides a summary of network usage from the analysis, and Table 4 provides a summary of system contribution within the SoS. These tables were a result of the evaluation of the full factorial of SoS configurations in order to identify the usage of network and system usage throughout each scenario run. We utilize quartiles 1 through 3 in order to gain a sense of the most commonly occurring data points for network and system usage in order to provide insight into SoS requirements at the early systems engineering lifecycle stages. The network usage counts the number of messages sent from each system, with the frequency of transmission dependent on the SoS phase. During the detect/track phases, messages are transmitted every 12 seconds; identify/classify phase is every 6 seconds, respond phase is every 3 seconds, and resolve phase is every 6 seconds. The intent is to provide a measure of realism of the frequency of messages sent during the high and low levels of intensity during a scenario. The system usage table tracks the number of seconds (and overall percentage) of how active a particular
636
David Flanigan and Peggy Brouse / Procedia Computer Science 16 (2013) 631 – 638
system was during the scenario. In cases where the intercept vehicle is not cued due to lack of search and detection by the tower, it would accordingly provide a lower number, thus the reason why intercept vehicles were not active in every scenario. The quartiles in the tables provide a sense of activity level when evaluating the more valuable systems within the SoS. The software to develop Figure 2 was MATLAB using a time-stepped simulation approach. For the start of the scenario, the program would move all applicable players (e.g. targets and intercept vehicles), check if the ranges or detections of the target met the exit criteria of a SoS phase, and proceeded to the next phase. For the detect/track phase, the range from the surveillance tower to target were checked, if it reached the identify/classify range, the intercept vehicle would move on a direct course towards the target until it reached the resolve range, where the scenario would end successful (indicated by a blue circle). If the target remained undetected by the tower or intercept vehicle and reached its destination, it would be considered a SoS failure. Figure 2 axes are in NM. Within Tables 3 and 4 are two underlying equations to develop the SoS metrics. The system network usage (for each individual system) is calculated by dividing the sum of all applicable system-system interactions by the total number of system-system interactions of all systems. This provides insight into how much a particular system requires interaction within the SoS. The system usage (for each individual system) is calculated by summing the time in each SoS phase (in this case we use seconds as the unit of measure) the system was active during that phase. This provides insight into how much a system is active and contributes to the overall SoS.
Fig. 2. CBP Mission Operational Reach Summary
Table 3. Summary of SoS network usage Network Usage
Quartile 1
Quartile 2
Quartile 3
Surveillance Tower
24
91
207
Communication Tower
68
132
360
Intercept Vehicle
0
113
265
Command and Control Node
114
194
384
David Flanigan and Peggy Brouse / Procedia Computer Science 16 (2013) 631 – 638
637
Table 4. Summary of SoS system usage System Usage
Quartile 1
Quartile 2
Quartile 3
Surveillance Tower
0.105
0.768
1
Communication Tower
0.573
0.910
1
Intercept Vehicle
0
0.232
0.750
Command and Control Node
0.823
0.933
1
We can make the following remarks from the network and system usage tables: the surveillance towers are a required system that must operate for essentially the entire time of the scenario; which is expected since all action sensor capability. The communications tower is in use when the surveillance towers have an active detection and track on the inbound target, but are not active when there is no detection by the tower. These trends are similar for evaluating the vehicle usage, where there cannot be an intercept if the target is not detected nor identified. The command and control node is involved in most of the phases, so its usage is unsurprisingly high. The SoS Total Network Capacity can vary between 20 400 messages per platform, in either a successful or failed SoS configuration. The SoS System Contribution requires that each individual system (surveillance towers, communication towers, intercept vehicle, and the command and control node) be present and available throughout the entire scenario, which may lead to future resilience / reliability requirements for these nodes to ensure continual operations and availability. 5. Conclusions and Recommendations for Future Research This case study was intended to explore a developing SoS mission area with a large potential range of system level performance characteristics, which were then evaluated using the SoS requirements allocation and analysis method. These results may be used to help shape requirements for future SoS configuration development. Areas for further research with this case study may be to evaluate a larger surveillance area that may utilize multiple CBP SoS to evaluate future SoS capacities on a larger scale. Other areas of research may be to add a stochastic element in the SoS activities and logic processes during mission execution, where the SoS requirements would have a probabilistic range and confidence interval that may be allocated to the constituent systems during concept development. References 1. International Organization for Standardization and the International Electrotechnical Commission. "ISO/IED 15288 Systems engineering System Life Cycle Processes." (2002). 2. Software Engineering Standards Committee of the IEEE Computer Society. "IEEE Std 1220-2005 IEEE Standard for Application and Management of the Systems Engineering Process." (2005). 3. International Organization for Standardization and the International Electrotechnical Commission. "ISO/IEC/IEEE 29148:2011(E) Systems and software engineering Life cycle processes Requirements engineering." (2011). 4. TechAmerica. "TechAmerica/ANSI EIA-632(R2003) Processes for Engineering a System." (2003). 5. A.M. Madni and S. Jackson, "Towards a Conceptual Framework for Resilience Engineering." Systems Journal, IEEE 3.2 (2009): 181-91. 6. S. Jackson, "A Multidisciplinary Framework for Resilence to Disasters and Disruptions." Journal of Integrated Design and Process Science 11.2 (2007): 91-108. 7. O. Erol et al.,"Perspectives on Measuring Enterprise Resilience". Systems Conference, 2010 4th Annual IEEE. IEEE, 2010. 587-592. 8. M.A. Pflanz, On the Resilience of Command and Control Architectures (2012). 9. Office of the Deputy Under Secretary of Defense for Acquistiion and Technology, Systems and Software Systems Engineering (IJSSE) 2.2 (2011): 91-97. 11. T.M. S
-enabled effects-
638
David Flanigan and Peggy Brouse / Procedia Computer Science 16 (2013) 631 – 638
Engineering 13.3 (2010): 20-216. 12. U.S. Customs and Border Protection, SBInet Block 1 Fact Sheet, http://www.CPB.gov. (2009). 13. U.S. Customs and Border Protection, "Integrated Fixed Towers" SECTION C DESCRIPTION/SPECIFICATIONS/WORK STATEMENT STATEMENT OF OBJECTIVES, https://www.fbo.gov/?s=opportunity&mode=form&id=e42bc175f912cffa33bbf93ed4f3fe20&tab=core&_cview=1. (2012).