Evaluating the Effectiveness of Virtual Environment Displays for Reviewing Construction 3D Models Mohd.Fairuz Shiratuddin
Walid Thabet
Doug Bowman
Department of Building Construction Virginia Tech, VA 24061, USA
[email protected]
Department of Building Construction Virginia Tech, VA 24061, USA
[email protected]
Department of Computer Science Virginia Tech, VA 24061, USA
[email protected]
Abstract Conventionally, 2D paper-based CAD drawings are mainly used to view, extract, change, and exchange project information. This may lead to potential design and constructability conflicts. Through the use of 3D models in a Virtual Environment (VE), the design intent can be reviewed and modified during virtual interactive sessions, hence minimizing or even avoid conflicts. This paper presents the results of an experiment to compare and evaluate the effectiveness of five VE displays to review construction 3D models. The experiment involved using subjects from the AEC (Architecture, Engineering, Construction) industry that viewed and performed specific tasks on five construction 3D models. The five VE displays used were the CAVE™ (Cave Automated Virtual Environment), a Head Mounted Display (HMD), an Immersive-Workbench (IWB), a 1.5 meter hemispherical display and a desktop monitor. Based on the experiment results and subjects’ comments, summaries of the tradeoffs of all the VE displays were gathered and tabulated. Keywords 3D models, CAVE™, HMD, Immersive Workbench, Planning, Virtual Environment
1. INTRODUCTION In any construction project and prior to the actual construction, the medium used to visualize a proposed facility is mostly two-dimensional (2D) paper-based CAD drawings. The drawings provide the project team members “what” needs to be built. Throughout the entire process, the project team generates, visualizes, and exchanges textual and geometrical information using 2D paper-based drawings [Shiratuddin03b]. Due to the different level of interest, knowledge and understanding of the project among team members, proper design intent may not be fully understood and the overall strategy for the execution of work may not be well-formulated, which may result into design conflicts. Currently, the realization of a facility and how it should be built are mostly dependent on 2D paperbased CAD drawings. Those involved in planning and constructing the facility are expected to visualize, in abstract terms, all the perceived characteristics and spatial relationships among various components of the project. This presents a difficult task and imposes heavy burdens on the project team to lay out the best possible planning and construction decisions. Limitations imposed on the planning process through the use of 2D paper-based drawings have been identified by [Waly00].
The use of three-dimensional (3D) computer models has recently become more common for visualizing construction projects and how its components need to be placed together [Fu99]. Virtual environment (VE) displays and applications, when integrated with 3D models, allow the project team to walkthrough and freely view the 3D scenes from a first-person perspective point of view. VE allows them to visualize 3D scenes in an intuitive way and immersed within a synthetic world that solely exists in the computer. There is a wide range of VE displays and technologies that can be used to support the pre-construction planning processes. These include the fully-immersive headmounted displays (HMD) [Davis96], semi-immersive projected displays such as the CAVE™ [Cruz-Neira93] and tabletop displays such as the Responsive Workbench [Krueger95]. To date, there has not been any research that compares VE displays directly. The motivation for this experiment was to study and understand the tradeoffs involved in choosing a suitable VE display for construction related tasks based on six main VE features. This paper presents the results of an experiment comparing five VE displays to visualize 3D models of facility and building assemblies. The paper first introduces a brief description of the VE displays used. This is followed by a discussion on the development and how the experiment was conducted, methods used,
results and discussion. Finally, conclusion and future work is presented.
2. THE VE DISPLAYS All five VE displays used in the experiment are available at Virginia Tech main campus in Blacksburg, Virginia, USA. They are the CAVE™, the HMD, the VisionStation and the IWB (Immersive Workbench) and typical desktop monitor. The displays were divided into three categories; immersive, semi-immersive and non-immersive. The HMD is considered as immersive, the CAVE™, the VisionStation and the IWB are semiimmersive and the desktop monitor is non-immersive (Table 1). In the experiment, the CAVE™, the HMD and the IWB had real-time tracking system associated with them. Each tracker had 6 degrees of freedom (DOF) to track the user’s body movements (usually the hand and/or head) in order to accurately display the correct perspective view. However, the VisionStation and the desktop monitor did not have any tracking system installed since it was not necessary. The CAVE™, the IWB and the VisionStation were capable of displaying stereoscopic images, while the HMD and desktop computer monitor were not.
Displays Immersive Semi-Immersive Non-Immersive Tracked Stereo
CAVE™ P P P
with which the user navigates in the VE, has a small joystick with 4 buttons. To move in the VE, the user simply points the wand in the desired direction of travel and press the joystick forward and backward, left and right.
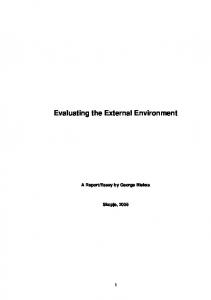
Figure 1: The CAVE™ at Virginia Tech
2.2. The Head Mounted Display (HMD) The Head Mounted Display or HMD enables the user to be completely immersed in the VE. A typical HMD houses 2 miniature screens and the user is secluded and completely isolated from the real world, and can only see the computer-generated images. In the experiment, the Virtual Research V8 HMD (Figure 2) with a resolution of 640 x 480 pixels and a 60-degree field of view (FOV) was used.
HMD IWB VisionStation P P P P P P P Table 1: A summary of the setup used for the displays
2.1.
The Cave Automated Virtual Environment (CAVE™) The CAVE™ is a large surround-screen projection VE display that was developed to overcome the limitation of single-user VE display such as the HMD. It is described as a cubic like shape that consists of 2 to 6 walls of screens. Rear-projected images are displayed using two to six projectors (one for each screen). Virginia Tech has a 4-screen CAVE™ display (front, left, right and bottom) measuring 10 feet in length, width and height (Figure 1). Since the CAVE™ walls surround (or partially surround) the user and the images can be projected in stereoscopic mode, resulting in the `illusion of immersion’ [Cruz-Neira93]. The size of CAVE™ also supports multi-user, where several users can share the same space and experience while maintaining visual contact, communication and movement inside the CAVE™ in a more natural way [Czernuszenko97]. During the experiment in the CAVE™, the user’s head and hand were tracked by the InterSense IS-900 VET tracking system. The hand tracker called the “wand”
Figure 2: The V8 HMD
Monitor P -
In the experiment, the V8 HMD was associated with the IS-900 VET tracking system that allowed the user’s head, hand and body movement to be tracked. The head tracker information was used to update the user’s view as he moved or turned. The wand (similar to the one used in the CAVE™) was used for navigation. The navigation technique was similar to the CAVE™, with an exception that rotation was not present. Rotation using the wand was not necessary because the HMD tracking system was already tracking the user’s head and body movement. 2.3. Immersive Workbench (IWB) The IWB is a portable drafting table display developed by Fakespace System. Generally it is characterized as a projection based virtual display that provides a large FOV. Similar to the CAVE™, it is also characterized as a multi-user display that supports high resolution, stereoscopic and head tracked images [Czernuszenko97]. The IWB has an adjustable, rear projected viewing plane made out of frosted glass and mounted on a frame (Figure 3). The plane can be oriented horizontally or at arbitrary angles. A projector
that is placed underneath displays the computergenerated 3D images onto the viewing plane. In the experiment, the user’s FOV was tracked using a Polhemus Fastrak head tracking system mounted on the stereoscopic shutter glasses. Using the glasses, the user was able to see different views of the 3D model from different perspectives. Besides the head tracker, a joystick was also used which allowed the user to rotate the 3D model displayed on the IWB. The learning curve of the IWB was the easiest as stated by the subjects, since the interaction technique employed only allowed users to rotate the 3D model either clock or counter clockwise. Also, by leaning closer to the viewing plane, the user was able to have a closer view of the model.
Figure 3: The IWB
Figure 4: The VisionStation
2.4. The VisionStation (VS) When compared to a CAVE™’s setup, the VisionStation model 1024s (Figure 4) by Elumens can be considered as an affordable and portable 3D immersive viewing system. It is hemispherical in shape with a diameter of 1.5 meters. The VisionStation used in the experiment is capable of projecting real-time stereoscopic images at a maximum resolution of 1024 x 768 pixels. It can comfortably accommodate between 2 to 3 people at a time. In the experiment, no tracking system was required for the VisionStation. Instead, a 2-button mouse was used to allow users to navigate in the VE. To move forward, the user simply pressed and held the left mouse button and to move backward, the user pressed and held the right mouse button. To look up or down, the user simply moved the mouse forward or backward. 2.5. The Desktop Computer Monitor A 21 inch desktop monitor was used in the experiment. It was displaying images at a resolution of 1280 x 960 pixels, in non-stereoscopic mode and no tracking system as it was not required. The user was able to move in the VE using a 3-button mouse. To move forward or backward, the user pressed and held the left mouse button and moved the mouse forward or backward. To move up or down, the user pressed and held the middle mouse button and moved the mouse forward or backward. To move left or right, the user pressed and held the right mouse button and moved the mouse left or right.
3. THE SOFTWARE Three different VE software application engines were used in the experiment to view the 3D models (Table 2). They were Diverse [Kelso02], the Unreal Tournament 2003 3D Game Engine (http://www.epicgames.com), and Simple Virtual Environment (SVE) [Kessler00]. The reason for using different VE software was primarily governed by the fact that each of the host computers attached to each VE displays varied in technology and computing platform. Although different VE software applications were used, the appearance of the 3D models in the VE was fairly similar to each other. Also, users were allowed some initial time to try out with each application before the experiment was conducted. This helped the users to focus on criticizing the quality of the display, and minimizing any preconceived notion resulting from the ease or difficulty of using one application versus another. A brief description of the VE software used in the experiment is shown in the sub-sections below. 3.1. Diverse DIVERSE stands for Device Independent Virtual Environments - Reconfigurable, Scalable, Extensible. It is developed and maintained by a research group at Virginia Tech (http://www.diverse.vt.edu). Diverse is free software and licensed under the terms of the GNU General Public License (GPL) and the GNU Lesser General Public License (LGPL) licenses. Diverse provides a set of common Application Programming Interface (API) to various VE hardware attached to the VE displays [Kelso02]. Diverse was used as the VE application residing in the host computers of the CAVE™, the IWB and the desktop monitor. 3.2.
Unreal Tournament 2003 3D Game Engine (3DGE) Prior to this experiment, there have been successful research efforts at the Department of Building Construction in utilizing 3D game engines’ (3DGE) technology as a VE application [Shiratuddin02]. Since the VisionStation did not come with any specific VE software, it was decided to test and use the same 3DGE technology on the VisionStation. The experiment utilized the Unreal Tournament 2003 (UT2003) 3D Game Engine (3DGE) as one of the VE applications for the VisionStation. The UT2003 3DGE was developed by EpicGames (http://www.epicgames.com). The all-inone integrated development tools provided by EpicGames have made the VE application development easier and faster [Shiratuddin03a]. 3.3. Simple Virtual Environment (SVE) Simple Virtual Environment (SVE) is a set of software library and run-time system developed to support the creation of simple VE applications by novice developers and for rapid application development [Kessler00]. SVE also provides a framework to extend simple VE applications that can include additional and
more complex behavior and technology. SVE was used as the VE application on HMD’s host computer. SVE was also used as a test bed application for the VisionStation alongside the UT 2003 3DGE. Display
Cave™
OS VE Apps
Unix Diverse
Hmd
Win Sve
Iwb
Vs
Mon
Unix
Win
Unix
Diverse
Sve & Game Engine
Diverse
Table 2: VE applications installed on the host computers
4. METHODOLOGY Prior to the final experiment with the industry, 30 students from the Department of Building Construction and Department of Architecture were recruited for a pilot study. In the pilot study, only two 3D models were used on 3 VE displays, the CAVE™, the HMD and the IWB. The VS was not yet available when the pilot was conducted. The monitor was intentionally left out for the pilot study. A set of similar questions were given out to the students. Results from this study had led to further understanding of the general characteristics of the VE displays and the issues involved in performing such an experiment. Based on these results, extensive lists of tasks and questionnaires to be used in the final experiment were developed.
Since the research theme revolved around making design and construction planning decisions using VE and involved professionals from the AEC (Architect, Engineer, Contractor) industry, the 3D models must be detail enough and have sufficient characteristics for the subjects (i.e. the architect, engineer or contractor) to fully recognized, understand and able to complete the given tasks and make construction related comments and decisions. A total of six 3D models were developed and they were: · 1 x single story house showing only the structural frame element · 1 x complete commercial facility · 1 x room showing only mechanical components · 3 x construction assembly details Each of these 3D models has their own characteristics and was assigned to a specific AEC professional from the industry. Table 2 depicts the major characteristics of the 3D models and the AEC experts it was assigned to. The questionnaires were designed in accordance to the main objective and were developed iteratively throughout the development of the experiment.
5. THE EXPERIMENT
Company A has a major problem with the coordination of multiple subcontractors in the “above-ceiling” area of commercial buildings. Discussion with field personnel indicated that VE was seen as a platform where work assemblies above the ceiling can be virtually modeled and the layout and construction sequence of mechanical, electrical and plumbing services can be discussed and modified.
The goal of our experiment was to evaluate the perceived suitability of the VE displays for decisionmaking tasks in construction. A combination of formative and summative evaluation techniques [Hix99] was used in the experiment. The formative evaluation included observational studies of the subjects and posthoc questionnaires that were designed to solicit their satisfaction or dissatisfaction with the VE displays as a tool to assist specialists in general and specific decisionmaking tasks. The summative element compares between a set of standard VE displays and the specified tasks performed. Our metrics included observations of critical incidents and subjective ratings of the displays by the subjects. We also collected more objective metrics, such as task timings and error counts, but due to high variability, the subjective data is much more useful.
b) Company B uses a walkthrough physical mockups (PMU) method to review the design of modular houses they build. These walkthroughs take place in a full-scale framed house built either near the office or on site, and involve participants from around the country. When the walkthrough is completed, the design is modified, and the structure is then disassembled. This procedure could be much more efficient and cost-effective if performed in a VE rather than using a physical structure. c) Company C already uses 3D graphics and animation in their design process. The use of realtime VEs could further enhance their ability both to visualize and modify their designs, as well as to present the designs to clients.
The first task was a navigation task where the subject familiarized him/herself with the display and navigation technique by moving around the VE until he/she felt comfortable. In the second task the subject was asked to make a specific decision about the 3D computer generated model. Each model has a set of tasks defined during the development of the experiment. Subject’s behavior and performance with each of the VE displays was observed and noted. Immediately after each session was completed, the subject filled in a questionnaire about the VE display. Once the subject had gone through the whole sessions with all the five displays, a final set of questions to compare all the five displays was given out. The experiment was concluded with a general discussion session.
In gathering more information and understanding of the tasks to be performed in the experiment, several site visits were also made to our industrial partners that perform services in the both the design and construction fields. Some of the important highlights of the visits were: a)
3D Models Structural frame house
Major characteristics
Target audience
· Showing only the framing elements of a single story
Architect, Contractor
house. Four rooms with various sizes and shapes. A kitchen, a garage and two bathrooms. · Doors were also included for the line of sight task. · Point of reference models i.e. a vehicle, a kitchen cabinet and two trees were also present in the VE. Complete commercial facility
· A four story building of a commercial facility.
Architect, Contractor
· Detailed textures were mapped to reflect the colors and materials used for the facility. · Surrounding building blocks and roads were present to reflect setback lines of the facility. · Point of reference models i.e. a vehicle, benches and trees were also included in the VE. MEP room
· A room consisted of above ceiling mechanical,
Contractor, Engineer
electrical and plumbing components e.g. duct works, air outlets, electrical cable trays, various shapes and sizes of hot and cold pipes and fire extinguishers.
Construction assemblies (a set of 3)
· Three
types
of
construction
assemblies
were
Contractor
developed.
Table 2: Characteristics of the 3D models
Once a 3D model was identified and matched with a subject, the subject was shown the same 3D model across all five VE displays. However, for each display, different tasks were allocated for the subject to perform. This was necessary in order to avoid learning effects, where subjects perform much better on displays that they encounter later in the experiment. Although this makes it harder to directly compare the displays, we carefully designed our tasks to have similar levels of difficult, and we believe that subjects could still make an accurate comparison since we were using only subjective metrics. Due to time constraints and conflicts of work schedules, only a total of 12 subjects from the industry were recruited for the experiment. The remote location of Virginia Tech’s main campus which is in rural Blacksburg was also a factor as to why we were not able to recruit more participants within the research allotted time. The 12 subjects consisted of 10 males and
2 females with an age range between 22 to 56 years old. The breakdown of the subjects is shown below in Table 3. Subjects have various pre-construction experiences activities related to design such as drawings’ drafting, project estimating, project management, construction management and engineering. Each subject was matched with a 3D model type that closely fit his/her expertise. Once a 3D model was identified and matched with a subject, the subject was shown the same 3D model across all five VE displays. However, for each display, different tasks were allocated for the subject to perform. Type of Industry No. of personnel Architecture 5 Architecture, Engineering and Planning 1 General Contractor 4 Higher Education 2 Total Population Sample 12 Table 3: The breakdown of the population sample
6. RESULTS & DISCUSSION The results and discussion presented in this paper compared all the five VE displays based on the six main VE features: · Quality of visual presentation of the model · Physical comfort · Level of realism · Ease of navigation · Ability to keep one from getting lost · Overall suitability for making decisions and performing tasks on design/construction related models Table 4 shows how subjects use computers on a daily basis at work. On average, subjects use computers between 4 to 8 hours a day to perform various tasks and most of them are involved in managerial and planning tasks. Computer Uses % of users Web browsing/email 91 Document editing/word processing 91 Personal organization 75 (calendars, contacts, to-do list) 2D modeling and/or design 16 3D modeling and/or design 8.3 Project scheduling and planning 66 Inventory and material tracking 25 Image editing 33 Table 4: Use of computers in subjects’ daily work
Table 5 shows the subjects familiarity with CAD, 3D modeling and VE displays. ¾ of the subjects involved in the experiment are used to CAD, ¼ familiar with 3D modeling and ¼ with the CAVE™ and/or HMD. Familiarity with CAD, 3D Modeling & VE % of users Computer-aided design (CAD) or 3D 75 modeling software packages such as AutoCAD, Architectural Desktop (ADT), Rhino 3D and 3D Studio Max. Producing 3D animations e.g. walkthroughs 25 and flythroughs in their work. The software used are ADT and 3D Studio Max 25 VE display HMD and the CAVEÔ. Table 5: Familiarity with CAD, 3D modeling software packages and VE display
With regards to the subjects’ tendency for motion sickness, ranked from a scale of 1 to 7 (from Low tendency to High tendency), the mean value is 2.17, with many of the subjects less prone to motion sickness. On average, subjects rated 4.25 (range from 1 to 7, `Not At All’ aware to `Completely Aware’) on how much they remained aware of the physical world around them when watching a movie. The average rating was 4.08, on how much the subjects tend to get `drawn into’ the `world’ of a story when they read a book. Table 6 summarizes these results.
Issues Mean Summarized Results Tendency for motion 2.17 Less prone to motion sickness sickness Awareness of the 4.25 Neutral physical world around them when watching a movie (awareness) Tendency to get `drawn 4.08 Neutral into’ the `world’ of a story when they read a book (focus) Table 6: Other issues
6.1. Display Comparison In the experiment, subjects were asked to compare and provide rankings to all the five VE displays, where 1 represents the `best display’ and 5 the `worst display’ for each given category. Table 7 shows the results of `the most’ and `the least preferred’ display based on the VE feature tested. Statistical analysis and calculation was based on the mean values (with a CI of 95%) gathered from the 12 respondents. Feature
Most Preferred Display CAVE™
Least Preferred Display VS
Quality of visual presentation of the model Physical comfort Monitor HMD Level of realism CAVE™ Mon Ease of navigation CAVE™ VS Ability to keep one from IWB Monitor getting lost Overall suitability for making CAVE™ Monitor decisions and performing tasks on design/construction related models Table 7: Summary of the results for VE displays features
6.1.1.
Quality of Visual Presentation of the model In the experiment, subjects ranked the CAVE™ being the ‘best display’ in terms of providing better quality of visual presentation of the environment/model. With 95% CI (Confidence Interval), the CAVE™ has a mean score of 1.92 and a CI of (+/-) 0.63, while ‘the worst’ rated by the subjects were the VS with a mean score of 3.58 and a CI of (+/-) 0.92 (Table 8). Quality of visual presentation of the model
VE Display Mean Value Cave™ Mon Hmd
Iwb
Vs
Ranking 1.92 3.20 2.75 2.92 3.58 95% CI (+/-) 0.63 0.92 1.11 0.67 0.92 Table 8: Mean & CI values for quality of visual presentation of the model [Rank: 1= the best & 5 = the worst]
Subjects described their experience when viewing the models in the CAVE™ as “felt being inside” because they can correctly and easily identify the elements and their sizes. Some related comments made by subjects
were “real”, “cabinets looked more realistic than with other models”, “overall model looked better”, “best display so far” and “I can tell a person and a tree”. The larger visual and FOV allowed subjects to easily identify elements and objects in the 3D model/environment. The CAVE™ provided a more natural interactivity with the subjects. Subjects’ decision in selecting the CAVE™ was also influenced by the life size images of the models where subjects can naturally ‘walk through’ them.
VE using the mouse. Generally, all subjects have familiarity with desktop computers and the use of a mouse, as compared to using other VE interaction devices (e.g. the wand). There are no enclosures of their surrounding and users are still aware of outside world. This awareness results in less attention and focus given to the display hence causes least fatigue to the users. Using the mouse also led subjects to feel more in control in terms of movement while navigating in the VE and also the speed of movement.
Conversely, the VS was selected as having the lesser quality of visual presentation as compared to other displays tested. A subject described the details of the models as “blurry”. This maybe because of the flickering images due to the non-synchronized stereoscopic mode. Other comments made by subjects were: “colors are not as distinctive”, “sketchy details”, “couldn’t tell exterior material”, “flipped upside down”, and “don’t see as good a texture as I would expect”. The poor quality of presentation by the VS was also due to the indistinct color of the models. The qualities of colors were somewhat too shady and dark in some areas. This was mainly due to the UT2003 3DGE dynamic lighting rendering feature where it tried to simulate real lighting effects and shadows. In addition, the resolution of the images displayed was poor and at times were jagged. The VS used in the experiment was only capable of displaying a maximum resolution of 1024 x 768 pixels hence may contribute to the jaggedness of images displayed. Some subjects experienced dizziness when viewing the models. This has influenced the subjects to rate the VS as giving them lesser quality of visual presentation of the 3D models displayed.
The HMD was less preferred by the subjects mainly because of the fatigue effect the subjects had experienced. Some related comments were “fatiguing”, “keep on losing orientation”, “can’t stay level at all times” and “frustrated sometimes”. It was observed that the HMD’s weight also caused the overall fatigue to the subjects. Subjects also described the HMD experience as being bothered by the glasses. It was also observed that some subjects lost their orientation inside the VE. Subjects had to get use to moving both head and hands to fly and to using the wand. This was a new navigation technique for them where they found it difficult to stay level most of the time, and they kept on losing focus on the 3D models. This has caused frustration and discomfort for the subjects.
6.1.2. Physical Comfort For physical comfort, the Monitor was ranked by the subjects as providing reasonable comfort while using it. With a 95% CI, the Monitor scored a mean value of 2.00 with a CI of (+/-) 0.96. The HMD was ranked ‘the worst’, with a mean value of 4.00 and a CI of (+/-) 0.89 (Table 9). Physical comfort
VE Display Mean Value Cave™ Mon Hmd
Iwb
Vs
Ranking
2.42
2.75
3.08
2.00
4.00
95% CI (+/-) 0.88 0.96 0.89 0.77 0.77 Table 9: Mean & CI values for physical comfort [Rank: 1= the best & 5 = the worst]
After undergoing the hands-on sessions with all the VE displays, subjects ranked familiar and simpler displays such as the Monitor and the IWB as causing low level of discomfort, as opposed to more complex display like the HMD. Subjects selected the Monitor as a comfortable display to use. A subject commented, “a lot finer control” when using the monitor, indicating he has better control of the
6.1.3. Level of Realism The subjects ranked the CAVE™ ‘the best’ for displaying high level of realism of the environment/model. This result corresponds to the same question asked in the previous section on individual display questionnaire regarding the level of realism. In this section, with a 95% CI, the CAVE™ scored a mean value of 1.92 with a CI of (+/-) 0.83. Interestingly, in the previous section, the VS was ranked the lowest in terms of the level of realism. However, in this section the Monitor was selected as having the lowest level of realism. The mean score for the Monitor was 4.10 and CI of (+/-) 0.74 (Table 10). In this section, the CAVE™ was preferred by subjects as able to provide a high level of realism and realistic views and images of the VE compared to the other four displays. Subjects indicated that the 3D models viewed in the VE of the CAVE are much closer to the real world compared to other displays. Some comments made were “real”, “I wanted to walk in”, “easy to identify elements”, “better feeling being inside”, “navigation feels like videogames”, “cabinets looked more realistic than with other models”, “overall model looked better” and “I can tell a person, a tree”. Such comments were made because the CAVE™ provided a wide, surrounding field of view (FOV), a more immersive display with higher resolution of images and allowed a more natural interaction between the subjects and the VE. The images displayed were also life-size which added to the realistic attribute.
Level of realism
VE Display Mean Value Cave™ Mon Hmd
Iwb
Vs
Ranking
1.92
3.25
3.50
4.10
2.25
95% CI (+/-) 0.83 0.74 0.86 0.72 0.77 Table 10: Means & CI values for level of realism [Rank: 1= the best & 5 = the worst]
According to Lantz [Lantz97], due to the higher resolution available on the monitor, finer detailed images can be displayed and hence instigated a more realistic view. Subjects did make positive comments regarding the images displayed: “easy to see detail”, “good to show owners”, “I can keep myself from walking through walls” and “looks like more detail”. However, in this section, subjects still ranked the monitor as ‘the worst’, maybe because they could view both the monitor screen and the surrounding environment at the same time. This has made them still aware of the outside world and less focused on the environment/model on the monitor screen. As a result, less realism was experienced by subjects. 6.1.4. Ease of Navigation In the previous section regarding the ease of navigation for individual display, the IWB scored highest, but in this section, the CAVE™ scored the highest for providing the ease of navigation. With a 95% CI, the CAVE™ scored a mean of 2.5 and CI of (+/-) 0.79. In the previous section, the Monitor was ranked by the subjects as providing the least ease of navigation, however, in this section, the subjects selected the HMD. The HMD scored a mean of 3.25 and a CI of (+/-) 1.12 (Table 11). Ease of navigation
VE Display Mean Value Cave™ Mon Hmd
Iwb
Vs
Ranking
2.50
2.75
2.75
3.00
3.25
95% CI (+/-)
0.79 0.90 1.12 0.72 1.12 Table 11: Mean & CI values for ease of navigation [Rank: 1= the best & 5 = the worst]
Subjects ranked based on the simplicity they felt to move around in the VE. Subjects selected the CAVE™ as the best display. The comments subjects made were: “navigation feels like videogames”, “overall model looked better” and “best display so far”. The first comment indicated that the subject felt ease when navigating because of the similarity of the VE in the CAVE™ with videogames. The second and third comments indicate that subjects showed interest in the VE, thus led them to navigating with ease. In addition, subjects could have a bird’s eye view of the VE by flying through. Using the walkthrough mode, subjects felt as if they were walking in a real building because of the life size scale of the VE. Subjects navigated through the VE using these features in addition to the hardware i.e. the wand. Even though subjects have to move tentatively to various different locations in the VE, navigation was generally smooth and with ease. On the
contrary, the HMD was ranked by subjects as the least preferred display. Some of the comments made by subjects were: “fatiguing”, “not easy to go into building”, “keep on losing orientation”, “a bit lost”, “can’t stay level at all times” and “frustrated sometimes”. It was observed that subjects were having difficulty to maneuver in the VE. These comments indicate that subjects had difficulty in navigating in the VE. The total seclusion when using the HMD made the subjects unable to physically see the wand. Therefore this situation had made the subjects’ familiarization with the wand and learning its navigation technique through viewing impossible. 6.1.5. Ability to keep one from getting lost In comparison with other four displays, the IWB was ranked by subjects as the best for being able to avert them from getting lost in the VE. The IWB was ranked by subjects as never made them felt lost or disoriented in the 3D environment/model. In this section, with a 95% CI, the IWB scored a mean value of 1.67 and CI of (+/-) 0.72. In the previous section, the other displays were ranked as making the subjects felt lost or disoriented in the VE ‘once or twice’. In this section, subjects ranked the Monitor as ‘the worst’ in terms of the ‘ability to keep one from getting lost’. The Monitor has a mean score of 3.50 and CI of (+/-) 0.90 (Table 12). The difficulties encountered by the subjects were to try to have clearer view and to figure out the views of the models. Some comments made by the subjects were “not sure where is back of building” and “looks fuzzy”. It was observed that subjects have more confidence when using the IWB, thus provided less tendency to make subjects got lost in the VE. Subjects did not easily get lost because the perspective view of the 3D environment/model in the IWB can be controlled with ease. Subjects used a joystick to control their navigation. Subject also commented that they can see the overall plan of the building and determine how and where it was located within the surrounding area. The physical nature of the IWB where the viewing plane is adjustable and extendable has a similarity to a drafting table. This resemblance may have provided a sense of familiarity and confidence in navigation, increased in focus and thus subjects did not easily get lost in the VE. However, in the experiment, the only movement that can be made using a joystick was rotation of the environment/model clock-wise or anti-clockwise. Nonetheless, the IWB is the preferred display by the subjects. Ability to keep one from getting lost
VE Display Mean Value Cave™ Mon Hmd
Iwb
Vs
Ranking
2.42
1.67
3.25
3.50
3.00
95% CI (+/-) 0.92 0.90 1.03 0.72 0.49 Table 12: Mean & CI values for ability to keep one from getting lost [Rank: 1= the best & 5 = the worst]
Subjects ranked the Monitor as ‘the worst’ and could easily make one gets lost while navigating in the VE. Comments made by subjects were “hard to get used to controls”, “hard to move sideways” and “I’m not doing so well with this”. These comments indicated the difficulties the subjects felt using and navigating in the VE using the Monitor. Unlike the CAVE™, the HMD and IWB that provided physical cues for navigation, a non-standard setup of the mouse was used. Instead of using a mouse-free-look setup, navigation was entirely achieved through 3 different mouse clicks in combination with the mouse movement. It was seen that subjects felt the navigation setup was not easy to grasp and confusing, they had to think for a while on their movement and how to navigate in the VE. This consequently contributed to the feeling of being lost or disoriented. 6.1.6. Overall Suitability for Making Decisions and Performing Tasks on Design/Construction related Models For this experiment, subjects ranked the CAVE™ being the ‘best display’ in terms of the overall suitability for making decisions and performing tasks on design/construction related models. In this section, with 95% CI, the CAVE™ scored a mean of 2.33 with a CI of (+/-) 0.83 while the IWB mean score was 2.75 (CI of (+/-) 0.81). The Monitor was selected by subjects as the ‘worst display’ for overall suitability for making decisions and performing tasks on design/construction related models. The Monitor scored a mean of 3.20 and CI of (+/-) 0.72 (Table 13). Overall suitability for making decisions and performing tasks on design/construct ion related models
VE Display Mean Value Cave™ Mon Hmd
Iwb
Vs
Ranking
2.33
2.75
3.00
3.20
3.00
95% CI (+/-) 0.83 0.72 1.16 0.81 0.94 Table 13: Mean & CI values overall suitability for making decisions and performing tasks on design/construction related models [Rank: 1= the best & 5 = the worst]
Referring to Table 13, when considering each CI values for each display, the results may not be conclusive. The overall results were very much divided and not fairly clear, hence indicating various factors may have influenced it. The CAVE™ was selected by the subjects as suitable for making decisions and performing tasks on design/construction related models. This is because subjects thought the life size scale of the models displayed in the VE was useful and would help them to solve problem quicker. This matches up with the comments made by the subjects, “real”, “I wanted to walk in”, “easy to identify elements”, “better feeling being inside”, “cabinets looked more realistic than with other models”, “overall model looked better” and “best
display so far”. The scale feature would allow performance of tasks on design/construction related models to be viewed realistically. The CAVE™ large visual and FOV also allowed subjects to easily understand the 3D environment/model and identify elements of the models. The built-in walkthrough and flythrough features of the CAVE™ were also the contributing factors where subjects can walk and do inspection up close and also have a bird’s eye view of the VE. Subjects also suggested that since the large space of the CAVE™ can accommodate more than 1 person at any one time, it is suitable for a group decision-making session. As mentioned earlier, users of the CAVE™ felt a ‘high’ sense of involvement and presence in the VE and this is an important factor for group decision-making. On the contrary, subjects ranked the Monitor as having lesser suitability and usefulness for performing design/construction tasks. Subjects commented the Monitor: “hard to get used to controls”, “hard to move sideways”, “hard to tell roads” and “I’m not doing so well with this”. These comments indicate that subjects found a certain level of difficulty while using the Monitor as a display. Subjects found that they could easily get lost while navigating in the VE. The use of a non-standard setup of mouse has made navigation not easily mastered. The Monitor also has a limited FOV for use by more than one person at any one time. This would be less effective for decision-making sessions. The limited size of the Monitor screen resulted in a restricted view of 3D environment/model in the VE. Even though the view area can be ‘zoom in’, ‘zoom out’, or ‘scrolled up or down’, these can distract attention and users of the Monitor can easily lose focus and get lost while navigating in the VE. These factors are thus may become an obstacle and making the Monitor lesser effective and less suitable for decisionmaking.
7. CONCLUSION & FUTURE WORK Although the size of the sample population used was very low due to the aforementioned reasons, data and results acquired have provided invaluable basic and preliminary findings with regards to the suitability of the types of construction 3D computer models and related tasks that can be displayed on each VE displays. Table 14 summarizes the characteristics of the different displays relative to the six main features tested. In the experiment, subjects ranked the CAVE™ as highly suitable to display 3D models because of its physical structure and the quality of the projected images viewed by subjects. The CAVE™ provided a larger field of view (FOV) and a large space to accommodate more than one user at any one time. As a result, subjects were able to communicate and interact with each other more easily. This instigated more discussion and decision-making. The clarity and highresolution images projected has allowed better
perception of the 3D models in the VE. Due to the enclosed space, surrounding FOV and life-sized images projected, subjects felt the existence of a certain level of realism of the models/environment displayed on the CAVE™. Although not directly evaluated during the experiment, some of the known downsides of the CAVE™ were discussed with the subjects during the discussion session. The reason for the discussion was to know whether these issues may affect the practical use of a CAVE™ in construction projects and its daily activities. Some of the main facts agreed by the subjects that may hinder the use of a CAVE™ are its requirement for a large space and its high initial cost as well as cost for maintenance and operation. It is also technically a challenge to setup as it requires accurate adjustment of walls, precise calibration of projectors, requires complex hardware and software to coordinate all the screens. These facts will somewhat make the CAVE™ non-portable and impractical to be used frequently in the daily activities in a construction project. The HMD provided immersion but subjects felt confined in the VE because of the limited FOV. Communication and interaction was very minimal because during the experiment the HMD session was only “a one-man experience”. Interaction with the navigation device was somewhat difficult because subjects cannot see it while holding it. Subjects also expected to see a virtual representation of their hand moving in the VE, which was not implemented in the application during the experiment. Inspection and wayfindings were somewhat easy to be conducted. However, using the HMD caused the most physical discomfort as compared to the other four displays. This was caused by the overall fatigue effect the subjects experienced. Other discomfort when using the HMD are dizziness, stomach discomfort, head/neck strain, eye strain, and arm/hand strain. Discomfort was also caused by the HMD’s weight. In addition, subjects had to get use to the wand and moving both head and hand to navigate in the 3D environment/model. If the aforesaid issues can be resolved, the HMD can be a useful display. The IWB was preferred as a display that can give a general overview of a building, facility, landscape or site. It can be used by many people at one time for them to view and make group discussions and decisions. However subjects commented that the IWB was not suitable for close inspection purposes or fault-findings of highly complex and detailed 3D models. This was due to the scaled-down in size of the 3D models displayed on the IWB. In the experiment, subjects found it difficult to view and inspect detailed components of the 3D model/environment. This was because way-findings were achieved not through virtually navigating but by simply physically pointing out where the location was. In summary, subjects preferred the IWB as a display to view an overall
environment with less detail because of its similarities to a drafting table. Compared to the other four displays, the monitor was regarded by subjects as providing the most physical comfort. This was an obvious choice as the monitor are widely used in offices and homes, thus the level of familiarity among subjects was very high. However, when comparing the monitor with the other four displays in terms of the level of realism, the ability to provide easier way finding and the suitability for making decisions and performing tasks on design/construction related models, the monitor was ranked the lowest. This ranking was due to the physical nature, structure and the way the monitor is normally used. Physically, the monitor has limited FOV and does not provide an enclosure for the user to focus on in the 3D model/environment. These factors made the monitor unsuitable for a comfortable viewing by more than one person at any one time for the purpose of group decision making. Smooth decision making may be affected due to space constraint where only one person can sit in front of the monitor and controlling the mouse for navigating in the 3D model/environment. In the experiment, navigation was entirely achieved through 3 different mouse clicks in combination with the mouse movement itself (i.e. moving the mouse left, right, forward and backward), instead of using a mouse-freelook setup. Even though the 3D environment/model displayed on the monitor was realistic due to high resolution images, due to the aforesaid factors, it was the least preferred display by the subjects for the purpose of performing tasks on design/construction related models and decision making. Subjects rated the VisionStation (VS) as presenting unsatisfactory qualities in many aspects. The VS was perceived as providing poor realism because subjects felt a lesser sense of presence and involvement when using it. Subjects also had difficulty understanding the 3D environment/model due to poor visual fidelity, poor representation of details and complex navigation. Navigation technique employed was somewhat too fast, the stereoscopic images displayed were flickering (due lower video refresh rate used by the projector) and also distortion of the images was noticeable at the edges of the hemispherical display. Due to these constrains that primarily existed in the way the experiment was developed and implemented, subjects felt the VS was not suitable for performing tasks on design/construction related models and decision making. In the experiment, only passive walkthrough VE applications were used. Interaction was limited to walking or flying through the 3D model. Future work will focus more on interactive VE applications specifically designed and related to construction design and planning processes. The success of a construction project lies deeply in the collaborative effort amongst the players. Therefore future implementations will also
investigate collaborative virtual environments. The VE decision support system will allow various project participants to collaboratively review a design, modify a design, verify constructability issues, rehearse construction sequences etc.; all of these with real-time response and real-time information access, retrieve and modification. CAVE™ Potential suitability to display 3D environment/model Potential suitability for use in design/planning and decision making Level of realism
Quality of visual presentation/projected images Ease of finding Physical issues Others
navigation
and
way
comfort/disorientation
Quality of visual presentation/projected images Ease of navigation and wayfinding
Physical issues
Others
comfort/disorientation
Potential suitability for use in design/planning and decision making
High High High (due to high semiimmersion, high level of naturalness of interaction with user, high level of involvement, large FOV i.e. 270 degrees) Clear, high resolution, high level of details, high fidelity, life-sized Easy with the use of the wand
Level of realism
High Low due to single user, not suitable for collaborative effort High (due to full-immersive nature, high level of involvement) Clear, high resolution, high level of details, high fidelity Fairly easy with the use of wand. Subjects have to get use to using the wand and moving both head and hands to navigate in the VE by way of walking or flying. High level of physical discomfort e.g. dizziness, stomach discomfort, head/neck strain, eye strain, and arm/hand strain Head-mounted glasses has to be carried by the subjects may cause discomfort Communication and interaction among users is difficult to achieve due to “a one-man experience”
Low due to experiment setup
improper
Can be highly suitable if proper application is developed and setup Low due to improper experiment setup Possible high. Can accommodate at least 3 people. Low due to improper experiment setup
Quality of visual presentation/projected images
Low (due to non-immersive nature, low level of naturalness of interaction with user, low level of involvement, noticeable edge distortion around the dome) Low due to improper experiment setup
Ease of navigation and wayfinding
Poor (due to improper stereoscopic images, flickering, low level of details, poor fidelity) Poor due to improper experiment setup
Very minimal Adequate space to accommodate more than one user at any one time. Requires a large space to accommodate, expensive maintenance and operation, require complex hardware and software. Not portable.
Head Mounted Display (HMD) Potential suitability to display 3D environment/model Potential suitability for use in design/planning and decision making Level of realism
VisionStation (VS) Potential suitability to display 3D environment/model
Physical issues Others
comfort/disorientation
Should be OK if properly setup
Immersive Workbench Potential suitability to display 3D environment/model Potential suitability for use in design/planning and decision making Level of realism
Quality of visual presentation/projected images Ease of navigation and way-finding Physical issues Others
None
comfort/disorientation
High (if to display a general overview of a building, facility, landscape or site. Low due to very less detail can be seen Low (due to low level of immersion, no enclosure to viewing, low level of naturalness of interaction with user, low level of involvement Clear, high resolution, high level of details, high fidelity Bird’s eye view and scaleddown image sizes Easy by simply physically pointing out the required location. None It can be used by more than one person at any one time to view and make a group decision Not suitable to use for closeup inspection purposes or fault-findings of highly detailed 3D models Similar to a drafting table
Desktop Monitor Potential suitability to display 3D environment/model Potential suitability for use in design/planning and decision making Level of realism
Quality of visual presentation/projected images Ease of navigation and way-finding
Physical issues Others
comfort/disorientation
Low Low Low (due to low level of immersion, no enclosure to viewing, low level of naturalness of interaction with user, low level of involvement, limited FOV) Clear, high resolution, high level of details, high fidelity Difficult due to improper experiment setup Can be improved using standard mouse setup None
Space constrain and limited FOV for collaborative decision making Table 14: Summary of the characteristics of the VE displays
8. REFERENCES
[Hix99] D. Hix, J. Edward Swan II, J.L. Gabbard, M. McGee, J. Durbin and T. King, User-Centered Design and Evaluation of a Real-Time Battlefield Visualization Virtual Environment, Proceedings of IEEE Virtual Reality (1999) 96-103. [Kelso02] J. Kelso, L.E. Arsenault, R.D. Kriz and S.G. Satterfield, DIVERSE: A Framework for Building Extensible and Reconfigurable Device Independent Virtual Environments, IEEE Virtual Reality Conference 2002, (Orlando, Florida, USA, March 24 - 28, 2002). [Kessler00] G.D. Kessler, D.A. Bowman and L.F. Hodges, The Simple Virtual Environment Library, an Extensible Framework for Building VE Applications, PRESENCE, 9 (2) (Apr. 2000) 187-208. [Krueger95] W. Krueger, C.A. Bohn, B. Froehlich, H. Schueth and W. Strauss, The responsive workbench: A virtual work environment, IEEE Computer (July 1995) 28(7):42--28. [Lantz97] E. Lantz, E, Future Directions in Visual Display Systems, Computer Graphics (May 1997).
[Cruz-Neira93] C. Cruz-Neira, D.J. Sandin and T.A. DeFanti, Surround-screen projection-based virtual reality: the design and implementation of the CAVE, Proceedings of the 20th International Conference on Computer Graphics and Interactive Techniques, (1993) 135-142.
[Shiratuddin02] M.F. Shiratuddin and W. Thabet, Virtual Office Walkthrough Using a 3D game Engine, Special Issue on Designing Virtual Worlds, in: International Journal of Design Computing, Vol 4. (2002).
[Czernuszenko97] M. Czernuszenko, D. Pape, D. Sandin, T. DeFanti, G.L. Dawe and M.D. Brown, The ImmersaDesk and Infinity Wall Projection-Based Virtual Reality Displays, in: Computer Graphics (May 1997). Available at: http://www.evl.uic.edu/pape/CAVE/idesk/paper
[Shiratuddin03a] M.F. Shiratuddin and W. Thabet, A Framework for a Digital Design Review System Utilizing 3D Game Development Tool, Proceedings of the 20th CIB W78 Conference on Information Technology in Construction, (Waiheke Island, Auckland, New Zealand, 2003).
[Davis96] E. Davis, Visual Requirements in HMDs: What Can We See and What Do We Need to See?, In Melzer, J. and Moffitt, K. (Ed.), Head-Mounted Displays: Designing for the User (McGraw-Hill: New York, 1996) 207-249.
[Shiratuddin03b] M.F. Shiratuddin and W. Thabet, Issues in Implementing a Virtual Environment based Design Review System, Proceedings of the Conference on Construction Applications on Virtual Reality (CONVR2003), (Virginia Tech, Blacksburg, VA 24061, USA, 2003).
[Fu99] M.C. Fu and W.E. East, The Virtual Design Review, Computer-Aided Civil and Infrastructure Engineering, 14 (1999) 25–35.
[Waly00] A. Waly and W. Thabet, A Virtual Construction Environment (VCE) for Project Planning, Proceedings of the Conference on Construction Applications on Virtual Reality: Current Initiative and Future Challenges (CONVR2000), (University of Teesside, Middlesbrough, UK, September 4-5, 2000).