conclusion The InterVA model is an easy to use and cheap alternative to ... assessing AIDS mortality in populations without vital registration and medical ...
Tropical Medicine and International Health
doi:10.1111/j.1365-3156.2010.02484.x
volume 15 no 5 pp 547–553 may 2010
Evaluating the InterVA model for determining AIDS mortality from verbal autopsies in the adult population of Addis Ababa Biruk Tensou1, Tekebash Araya1, Daniel S. Telake1,2, Peter Byass3, Yemane Berhane4, Tolcha Kebebew1, Eduard J. Sanders5,6 and Georges Reniers2,7 1 2 3 4 5 6 7
Addis Ababa Mortality Surveillance Project, Faculty of Medicine, Addis Ababa University, Addis Ababa, Ethiopia Population Program, Institute of Behavioral Science, University of Colorado, Boulder, CO, USA Public Health and Clinical Medicine, Umea˚ University, Umea˚, Sweden Addis Continental School of Public Health, Addis Ababa, Ethiopia Centre for Geographic Medicine Research-Coast, Kenya Medical Research Institute, Kilifi, Kenya Centre for Tropical Medicine, Nuffield Department of Clinical Medicine, University of Oxford, Oxford, UK Office of Population Research, Princeton University, Princeton, NJ, USA
Summary
objective To evaluate the performance of a verbal autopsy (VA) expert algorithm (the InterVA model) for diagnosing AIDS mortality against a reference standard from hospital records that include HIV serostatus information in Addis Ababa, Ethiopia. methods Verbal autopsies were conducted for 193 individuals who visited a hospital under surveillance during terminal illness. Decedent admission diagnosis and HIV serostatus information are used to construct two reference standards (AIDS vs. other causes of death and TB ⁄ AIDS vs. other causes). The InterVA model is used to interpret the VA interviews; and the sensitivity, specificity and cause-specific mortality fractions are calculated as indicators of the diagnostic accuracy of the InterVA model. results The sensitivity and specificity of the InterVA model for diagnosing AIDS are 0.82 (95% CI: 0.74–0.89) and 0.76 (95% CI: 0.64–0.86), respectively. The sensitivity and specificity for TB ⁄ AIDS are 0.91 (95% CI: 0.85–0.96) and 0.78 (95% CI: 0.63–0.89), respectively. The AIDS-specific mortality fraction estimated by the model is 61.7% (95% CI: 54–69%), which is close to 64.7% (95% CI: 57– 72%) in the reference standard. The TB ⁄ AIDS mortality fraction estimated by the model is 73.6% (95% CI: 67–80%), compared to 74.1% (95% CI: 68–81%) in the reference standard. conclusion The InterVA model is an easy to use and cheap alternative to physician review for assessing AIDS mortality in populations without vital registration and medical certification of causes of death. The model seems to perform better when TB and AIDS are combined, but the sample is too small to statistically confirm that. keywords mortality, surveillance, verbal autopsy, InterVA, cause of death, HIV ⁄ AIDS, Ethiopia
Introduction Mortality statistics are an important resource for evaluating the effectiveness of antiretroviral therapy (ART) programmes (Diaz et al. 2005). In developing countries and in Africa in particular, establishing the distribution of causes of death is often difficult because of incomplete vital registration and lack of medical certification of causes of death (Mathers et al. 2005; Setel et al. 2007). Post-mortem interviews with next of kin or other caregivers, also known as verbal autopsy (VA) interviews, are an alternative method for estimating the distribution of causes of death in a population (Chandramohan et al.
ª 2010 Blackwell Publishing Ltd
1994; Soleman et al. 2006). So far, the interpretation of VAs largely relied on physician reviews and it has an acceptable sensitivity and specificity for causes of death such as HIV ⁄ AIDS (Kahn et al. 2000; Quigley et al. 1999; Setel et al. 2006a). However, physician review has been criticized because the cause of death assignment is influenced by the local medical culture and may therefore not be suitable for comparisons across populations. In addition, the reliability of physician review is thought to be weak, time consuming and not cost-effective (Murray et al. 2007; Soleman et al. 2006). Expert and data-derived algorithms permit automation and standardization of the coding process and are cheaper than physician review but 547
Tropical Medicine and International Health
volume 15 no 5 pp 547–553 may 2010
B. Tensou et al. Evaluating the InterVA model for determining AIDS mortality
require validation (Quigley et al. 1999, 2000; Reeves & Quigley 1997). The InterVA model is an expert opinion-based algorithm that has been applied in Ethiopia and Vietnam, but it has never been validated in a sample with a reliable reference or gold standard (Byass et al. 2003, 2006; Fantahun et al. 2006). For constructing a reference standard, VA validation studies typically rely on a sample of deaths that occurred at a health facility. These populations may be uncharacteristic in their cause of death distribution, but also in terms of the knowledge of caretakers concerning the illness and cause of death, and that may lead to the misspecification of the sensitivity and specificity of the VA tool (Lopman et al. 2006). In this study, we constructed a reference standard for individuals who ever visited a hospital during the course of their illness but did not necessarily die in a medical facility. In a different study, we established that 25% of patients in Addis Ababa died in a medical facility, but 87% had ever visited a medical facility prior to death (Reniers & Tesfai 2009). Without arguing that our validation sample is therefore representative, it is an improvement over a sample of exclusively hospital deaths. In addition, we used patients’ serostatus information for constructing the reference standard. Such a reference standard will more accurately distinguish AIDS from non-AIDS deaths than more commonly used reference standards in VA validation studies such as the retrospective review of medical records (Chandramohan et al. 1998; Kahn et al. 2000; Setel et al. 2006a,b) or the physician review ascertained cause of death (Byass et al. 2003, 2006; Fantahun et al. 2006; Quigley et al. 1996, 1999, 2000). Data and methods The study was conducted in Addis Ababa, Ethiopia. The first diagnoses of AIDS in Ethiopia date back to 1986
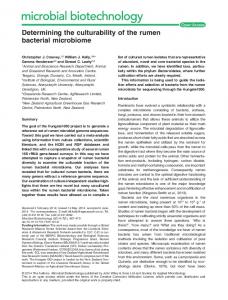
(Lester et al. 1988). By 2005, HIV prevalence in the age group 15–49 had grown to 7.1% according to the Ministry of Health (MOH 2007), an estimate that lies between those of the 2005 Demographic and Health Survey (5.0%) (CSA & ORC Macro 2006), and earlier extrapolations from antenatal clinic data (11.7%) (MOH & NHAPCO 2006). The impact of HIV on mortality is substantial: estimates for 2001 attribute between 54.7% and 62.4% of adult deaths (ages 20–64, both sexes) to AIDS (Reniers et al. 2006). Data for this study come from hospital surveillance and a set of VA interviews (Figure 1). The reference standard was constructed from data collected during a 9-month prospective surveillance in the Zewditu Memorial Hospital, a large governmental hospital in the center of Addis Ababa. The surveillance started in May 2003 and covered the TB-HIV clinic (serves outpatients) and the medical emergency, internal medicine, gynaecology, surgical and paediatric wards. A ward nurse collected basic background characteristics, admission and discharge diagnosis for each patient. A Determine rapid HIV1–2 test was carried out on the blood sample, and post-test counselling was conducted by a nurse from the voluntary counselling and testing unit. Written informed consent was obtained from the patient or guardian. Capillus� HIV-1 ⁄ HIV-2 confirmatory tests were performed on positive samples. In the event that the results from the two tests were discrepant, a Uni-Gold� HIV test was carried out as a tie breaker. All tests were offered free of charge. An HIV test was conducted for 1332 of 1650 registered patients. Non-response on the HIV test was due to both refusals and discharge prior to administering the test. The surveillance protocol and a discussion of the association between non-response and HIV status are given elsewhere (Reniers et al. 2009a). We also retrieved the patient card information for 38% of the decedents (the
Hospital surveillance (N = 1650)
Match Discharged dead Discharged alive (N = 190) or discharge status (N = 28) unknown
Burial surveillance
VA interview (N = 193 completed VAs, response rate = 88.5%) Reference standard - AIDS death (N = 167) - TB/AIDS death (N = 174)
548
InterVA output Validation
- AIDS death - TB/AIDS death
Figure 1 Study protocol flow chart.
ª 2010 Blackwell Publishing Ltd
Tropical Medicine and International Health
volume 15 no 5 pp 547–553 may 2010
B. Tensou et al. Evaluating the InterVA model for determining AIDS mortality
others were not found). A brief history of the decedent, physical examination, lab investigation, final diagnosis, course of treatment, condition of discharge and immediate cause of death were summarized from the patient card. Patient card information, if available, was used in conjunction with the admission diagnosis and the HIV serostatus to determine the cause of death in the reference standard. The verbal autopsy interviews were administered for patients who died in the hospital under surveillance (N = 28) and for those who died elsewhere, but whose hospital record matched with a record from an ongoing burial surveillance (N = 190) (Figure 1). The burial surveillance was initiated in February 2001 at all known cemeteries in Addis Ababa and has been described elsewhere (Reniers et al. 2009b; Sanders et al. 2003). VA interviews were conducted 2–9 months (mean = 4.7) after the death by a pair of community health workers. The VA interviewers received 1-week training in the administration of VAs, including fieldwork practice. The VAs are being conducted for monitoring all causes of death, so there is no specific focus on HIV ⁄ AIDS in the questionnaires, during training or data collection. The VA response rate was 88.5%. In the interview debriefing section of the VA
questionnaire, the interviewers reported on the cooperativeness of the respondent and the perceived truthfulness of his or her answers. In three cases, the cooperation and perceived truthfulness were low, and these cases are included in the analysis that follows. The verbal autopsy questionnaire is based on the standard VA questionnaire developed by the INDEPTH Network (http://www.indepth-network.org/) and includes a section wherein respondents give a brief account of the illness, and a section with closed-ended questions wherein respondents are prompted for the presence of particular symptoms. Important symptoms that were not included in the structured part of the questionnaire (i.e. oral candidiasis, drowsiness, excessive food or water intake and any prior diagnosis of a stroke) are included in the analysis if they were reported in the open-ended narrative part of the questionnaire. Bilingual Amharic-English questionnaires were developed, but the interviews were almost exclusively conducted in Amharic, the lingua franca in Ethiopia. Reference standard The reference standard was constructed using information from the admission diagnosis (or discharge diagnosis if
Table 1 Definition of AIDS death in the reference standard using admission diagnosis (ICD-10) and HIV status Cause of death HIV test result
AIDS death
Positive
A09, A15.0, A16.2, A18.2, A19.9, A41.9, B20.0, B24, B29, B37.0, B54, B58.2, B58.9, B59, C53.9, G05.2, I95.2, J18.9, J93.8, J98.4, K30, K60.3, K76.6, L51.1, R40.2, R50.9, R57.9, R69 (N = 99)
Negative
(N = 0) Not available
A16.2, B20.0, B58.9, B59, I95.2
(N = 9)
Non-AIDS death
Not classified E14.0, R50.9
(N = 0)
(N = 2)
A09, A16.2, A18.3, A41.9, D64.9, I10, I31.3, I50.9, I63.3, J18.9, K27, K29.7, K56.2, K56.3, K56.6, K65.0, K67.3, K75.9, K76.9, K80.1, K83.1, K93.0, N18.9, N20.0, N81.9, O03.4, R10.0, R11, R50.9, T65.9 (N = 54)
R50.9, R58
A19.9, A35, I10, J18.9, K72.9, & died within 7 days of admission (N = 5)
(N = 2) A09, A16.2, A19.9, A41.9, A68.9, D64.9, E16.2, I10, I95.2, J18.9, K29.7, K38.8, N81.9, O05, R57.1, R69 (N = 22)
When HIV status was not measured, the classification of cases by cause of death relied heavily on the information on the patient card. Patient card information is not summarized in the table above. The table simply classifies admission diagnoses against cause of death.
ª 2010 Blackwell Publishing Ltd
549
Tropical Medicine and International Health
volume 15 no 5 pp 547–553 may 2010
B. Tensou et al. Evaluating the InterVA model for determining AIDS mortality
available) and HIV status (Table 1). All cases with a negative HIV test result were classified as non-AIDS deaths. Among those with a positive HIV test result, deaths were classified as AIDS related if the admission diagnosis was indicative of an opportunistic infection. Two cases of HIV positive patients were coded as undetermined because the admission diagnosis did not refer to an opportunistic infection (i.e. diabetes mellitus, fever of unknown origin). The HIV status is unknown for 36 individuals. For most of these, we could not establish whether the cause of death was AIDS related or not (N = 22). Cases with an undetermined or missing cause of death in the reference standard were excluded from further analysis. Patients without HIV serostatus record, but with very specific AIDS-related admission or patient card information (e.g. toxoplasmosis, AIDS), were classified as AIDS deaths (N = 9). Five patients who were admitted for reasons other than HIV ⁄ AIDS and died within 7 days of admission were classified as non-AIDS deaths. Because TB and AIDS often occur in the same subjects, share many symptoms and are difficult to distinguish (Quigley et al. 1999), we also developed a reference standard whereby TB ⁄ AIDS cases are contrasted against non-TB ⁄ AIDS cases. The only difference with the AIDS reference standard is the reclassification of 21 TB cases (ICD10 of A15–A19) in those with an unknown or negative HIV status. InterVA model outputs and validation The InterVA model is a Bayesian probability theory-based expert algorithm. Bayes’ theorem defines the conditional probability of a cause in the presence of a particular indicator (Byass et al. 2003, 2006; Fantahun et al. 2006). The first version of the InterVA model was designed for the identification of 25 causes of death based on 66 indicators. In building the model, prior probabilities were assigned by expert panels using a semi-qualitative scale for each indicator and cause of death. The likelihood of each cause of death was calculated by applying the aforementioned theorem, taking into account each pertinent indicator. Up to three causes of death, with associated likelihoods, were reported for each case. The likelihood of any cause reported by the model had to exceed the square root of the prior probability for that cause, and any second or third likely cause had to reach a likelihood of at least 50% of the most likely cause (Byass et al. 2003). For this study, we used InterVA-3, which distinguishes between 35 causes of death based on 104 indicators. The model requires a local setting for the prevalence of malaria and HIV in the population (Byass et al. 2006). In the case of Addis Ababa, we specified low 550
malaria (the city is located at high altitude) and high HIV prevalence conditions. We defined an AIDS (or TB ⁄ AIDS) death as a case where any of the InterVA-assigned causes is indicative of AIDS (or TB ⁄ AIDS) and compared these with the reference standard by means of standard diagnostic statistics (sensitivity, specificity and positive predictive value). We used receiver operating characteristic (ROC) curves to determine the likelihood cut-off point that maximizes the diagnostic accuracy of the InterVA model. Using those optimal cut-off points, we compared cause-specific mortality fractions by age from the model and reference standard. Ethics Data for this study were collected with ethical clearance from the Addis Ababa University Faculty of Medicine (Faculty Research and Publications Committee), the Ethiopian Science and Technology Agency, the Institutional Review Boards of the University of Pennsylvania and the Centers for Disease Control and Prevention, the Research Ethics Review Committee of the WHO and the Human Research Committee of the University of Colorado at Boulder. Results One hundred ninety-three VAs were conducted for adults (aged range 14–85) with a matched hospital record. The male to female ratio of deaths in the sample was 0.95, and 90.7% of the cases pertain to adults in the 20–64 age range. Close to 82% of the decedents were tested for HIV with an HIV prevalence of 63.5%. Because of missing HIV serostatus information in the reference standard, only 167 of 193 cases could be classified as either AIDS or non-AIDS (Table 1). The TB ⁄ AIDS reference standard was defined for 174 cases. In the reference standard, the AIDS-specific mortality fraction was 64.7% (108 of 167 cases, 95% CI: 57–72%), and the TB ⁄ AIDS mortality fraction was 74.1% (129 of 174 cases, 95% CI: 68–81%). In our sample, the InterVA model provided up to two underlying causes of death, each with an assigned likelihood (Table 2). Based on the most likely cause, the most prominent underlying cause of death was HIV ⁄ AIDS (54.9%) followed by liver disease (15.0%) and pulmonary tuberculosis (14.5%). Close to 14% of the cases had a second cause of death assigned. The majority of those were classified as HIV ⁄ AIDS (44.4%), followed by tuberculosis (22.0%). No cases were attributed three causes of death. For making comparisons with the reference standard, we
ª 2010 Blackwell Publishing Ltd
Tropical Medicine and International Health
volume 15 no 5 pp 547–553 may 2010
B. Tensou et al. Evaluating the InterVA model for determining AIDS mortality
Table 2 Distribution of the major underlying causes of deaths using the InterVA model
1 0.9
Likelihood
0.8 n (%)
Minimum Maximum Mean
Cut-off: = 40%
First cause of death HIV ⁄ AIDS 106 Liver disease 29 Tuberculosis 28 Pneumonia ⁄ sepsis 9 Kidney or urinary 3 disease Meningitis 3 Stroke 4 Bloody diarrhoea 2 Other digestive 2 disease Other 7 Total 193 Second cause of death HIV ⁄ AIDS 12 Tuberculosis 6 Pneumonia ⁄ sepsis 2 Liver disease 3 Other 4 Total 27
(54.9) (15.0) (14.5) (4.7) (1.6)
42 35 55 33 45
100 100 98 94 96
86 84 81 66 63
(1.6) (2.1) (1.0) (1.0)
61 30 92 51
100 84 93 72
86 59 93 62
(3.6) 24 (100.0)
93
59
(44.4) (22.2) (7.4) (11.1) (14.8) (100.0)
47 50 47 37 44
32 33 47 30 24
0.6 Cut-off: = 90%
0.5 0.4 0.3 0.2 0.1 0 0
41 44 47 34 34
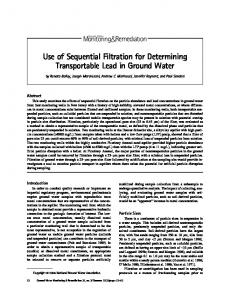
dichotomized the model outputs into AIDS vs. non-AIDS and TB ⁄ AIDS vs. non-TB ⁄ AIDS, and, in doing so, we considered the first as well as second cause of death. The InterVA model also provided an estimate of the likelihood with which causes of death are assigned. The likelihood of the first cause of death ranged from 24% to 100% with an average of 82.1%. The mean likelihood of the second cause of death was 40.4% varying from 24% to 50%. The likelihoods with which AIDS and TB ⁄ AIDS cases could be established were generally higher (Table 2). In Figure 2, we used those likelihoods as cut-off points (first and second most likely causes combined) to identify the likelihood level at which the area under the ROC curve is maximized. The highest likelihood cut-off point produced the lowest sensitivity and vice versa. In addition, a reduction in the likelihood cut-off point resulted in large gains in sensitivity relatively small losses in specificity. In case of the AIDS reference standard, the maximum is reached at a likelihood cut-off point of 50%. The corresponding sensitivity and specificity are 0.81 (95% CI: 0.73–0.88) and 0.80 (95% CI: 0.67–0.89), respectively. For the TB ⁄ AIDS reference standard, the maximum is reached at the lowest observed likelihood cut-off point (40%). The sensitivity and specificity under that condition were 0.91 (95% CI: 0.86–0.97) and 0.78 (95% CI: 0.63–0.89), respectively. The optimal area under the ROC
ª 2010 Blackwell Publishing Ltd
Sensitivity
0.7
0.1 0.2 0.3 0.4 0.5 0.6 0.7 0.8 0.9 1-Specificity AIDS death
1
TB/AIDS death
Figure 2 Receiver operator characteristics curves for the AIDS and TB ⁄ AIDS references standards: sensitivity plotted against specificity at different likelihood cut-off points. Points with the highest likelihood cut-off point have the lowest sensitivity and highest specificity, and vice versa.
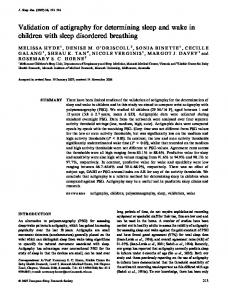
curve was 85% (95% CI: 78–91%) for the TB ⁄ AIDS reference standard compared to 81% (95% CI: 74–87%) for the AIDS standard, confirming that the model performed better against a reference standard whereby TB and AIDS are combined. These differences were, however, not statistically significant. The individual-level agreement of the reference standards and model outputs were confirmed by Kappa statistics: these are 0.58 (95% CI: 0.50–0.65) and 0.69 (95% CI: 0.61–0.76) for the AIDS and TB ⁄ AIDS reference standards, respectively. At the lowest likelihood cut-off point (i.e. any diagnosis of AIDS or TB ⁄ AIDS irrespective of the likelihood) and accounting for both the first and second assigned cause of death, the AIDS-specific mortality fraction estimated by the InterVA model was 61.7% (103 out of 167 cases, 95% CI: 54–69%). This is very close to the 64.7% (108 out of 167 cases, 95% CI: 57–72%) in the reference standard. The TB ⁄ AIDS mortality fraction estimated by the model was even closer to the observed value: 73.6% (128 out of 174 cases, 95% CI: 67–80%) compared to the 74.1% (129 out of 174 cases, 95% CI: 68–81%) in the reference standard. Figure 3 further illustrates that the InterVA model reproduces the age pattern of AIDS and TB ⁄ AIDS mortality fairly well. Again, that is particularly the case for TB ⁄ AIDS 551
Tropical Medicine and International Health
volume 15 no 5 pp 547–553 may 2010
CSMF
B. Tensou et al. Evaluating the InterVA model for determining AIDS mortality
In conclusion, this validation exercise confirms that the InterVA model is a useful tool for monitoring TB ⁄ AIDS mortality in resource-constrained settings with routine VA collection and could be valuable for assessing the impact of ART programmes. This study thus confirms the promise shown in earlier applications of the model (Byass et al. 2003, 2006; Fantahun et al. 2006). Because of the relatively small validation sample, our appraisal is restricted to adult deaths and the most important cause of death in adults, namely TB ⁄ AIDS mortality.
100 90 80 70 60 50 40 30 20 10 0
20–29