Oct 4, 1997 - NETWORK AND USABILITY CHARACTERISTICS OF VR CONFERENCING. BT Technol J Vol 15 No 4 October 1997. 102. ⢠Scaling to larger ...
Evaluating the network and usability characteristics of virtual reality conferencing C Greenhalgh, A Bullock, J Tromp, and S Benford
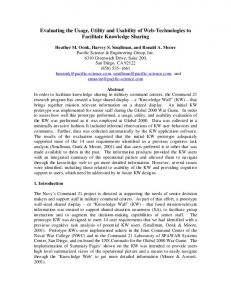
This paper presents the results of the BT-funded ‘Inhabiting the Web’ project which conducted a series of twenty virtual meetings using the MASSIVE virtual reality teleconferencing system between five universities and BT Laboratories. The aims of the project were, firstly, to assess the characteristics of the network traffic generated by MASSIVE and, therefore, by extension, the network traffic generated by other peer-to-peer unicast-based collaborative virtual environments, and, secondly, to identify key human factors issues arising from the long-term and regular use of such a system. The paper gives an overview of the MASSIVE system and the organisation of the meetings and then presents an analysis of its results. The network analysis involves a statistical analysis of system logs in order to build a profile of typical user behaviour. This profile indicates how much users might be expected to engage in basic actions such as moving and speaking during a typical meeting and also to what extent these actions might be correlated among users. When combined with an understanding of MASSIVE’s network protocols, this leads to a model to predict the network traffic generated by varying numbers of users. It also suggests new design possibilities such as ‘group portals’, caching of worlds and the use of multicast protocols. Usability reflections address the issues of embodiment, navigation and use of the spatial model of interaction as implemented in MASSIVE. New design possibilities are identified including higher level support for gestures on embodiments and socalled object-centred and context-sensitive styles of navigation.
1.
Introduction
R
ecent years have seen a growing interest in the technology of collaborative virtual environments (CVEs) — distributed multi-user virtual reality systems that support mutual awareness and communication among their inhabitants [1]. The essence of CVEs is that multiple users share a computer-generated virtual world. Each user is able to freely navigate their own viewpoint within this world, is directly represented to other users through a process of embodiment, can communicate with other users employing a range of media (such as audio, text, graphics and video), and can directly manipulate objects within the world. There might be many potential applications of CVEs including virtual meeting rooms, shared 3-D information visualisations, battle and emergency simulations, and various kinds of entertainments. BT’s own research into CVEs has included the Virtuosi project, a three-year DTI/EPSRC-funded project which was led by BT and which developed CVE demonstrators for the manufacturing and fashion industries [2], and The Mirror, a project between BT, Illuminations Television, the BBC and Sony, to stage a public trial of a ‘dial-up’ CVE alongside the television series The Net. There are several potential benefits of this CVE technology [3].
•
Support for natural, spatial communications skills Humans have developed a range of subtle but important communications skills based on the use of space as a ‘shared resource’. Key examples include the importance of gaze direction in conversational turntaking and the deployment of a wide range of spatial gestures such as pointing, facing and many other more subtle accompaniments to speech. CVEs may allow users to employ these skills to an extent that is not possible with other communications technologies.
•
Dynamic group formation Many social situations, especially those involving more than a handful of participants, involve a degree of dynamic group formation — conversational groups come and go, groups split into sub-groups, sub-groups merge into larger groups and participants move between groups. In contrast to previous teleconferencing systems which often assume a relatively static and predefined group membership, CVEs actively encourage ‘mingling’ behaviours and highly dynamic group formation. BT Technol J Vol 15 No 4 October 1997
101
NETWORK AND USABILITY CHARACTERISTICS OF VR CONFERENCING
•
Scaling to larger numbers of participants Following on from the previous observation, a common goal of CVEs is to support large numbers of simultaneous participants. CVEs support scalability in several ways — the perspective view offered by 3-D interfaces allows many participants to be seen at once, the use of attenuation with distance or even fully 3-D sound might help participants cope with many simultaneous audio streams, and the application of scoping techniques (such as ‘aura’, described in sections 2.1 and 5) allows users to limit their personal scope of communication in a densely populated environment. Current systems claim anything between ten and a hundred simultaneous participants, depending on the level of communication supported (e.g. audio or text), and other factors such as the level of user activity (indeed, factors affecting scalability are a key topic of this paper).
•
Peripheral awareness Computer-supported co-operative work (CSCW) research has indicated the importance of users establishing ‘peripheral awareness’ of the presence and activities of others [4]. By situating users within a 3-D space, CVEs implicitly support users in conducting locally focused communication, while at the same time ‘keeping an eye’ on more distant (i.e. peripheral) events. Some CVEs, such as the MASSIVE-1 system discussed in this paper, go further by introducing explicit mechanisms for establishing different levels of awareness within a shared virtual space.
•
102
However, to date there has been little formal experimentation aimed at verifying or refuting these various claims. There is also little understanding of the network traffic characteristics of CVEs, i.e. what kind of traffic will they generate or, conversely, what limits on scalability and complexity will be imposed by the use of different underlying networks (e.g. what could realistically be achieved using ISDN, ATM or the Internet). Answering these last questions will be a key step in provisioning any future CVE-oriented network services. This paper presents the results of a programme of experimentation aimed at answering some of these questions. This programme has been carried out in the ‘Inhabiting the Web’ (ITW) project, a BT-funded project within the BT/JISC (Joint Information Systems Committee of the Higher Education Funding Council for England) Research Collaboration Programme. ITW ran from October 1995 until March 1997 and involved a collaboration between BT Laboratories and five UK universities (Nottingham, Lancaster, Manchester, Leeds and UCL). The project ran a series of network experiments of Nottingham’s MASSIVE-1 VR teleconferencing system [3] over the SuperJANET network in order to:
•
Partially overlapping media An interesting property of human perception in the physical world is that we do not perceive the same objects at the same levels of detail in all of the available media. Typically, we can see some things that we cannot hear (e.g. distant objects) and hear some things that we cannot see (e.g. objects that are behind us). These ‘partial overlappings’ of media give rise to the potential for peripheral awareness. For example, we can listen to one person while keeping an eye on someone else who is approaching from the distance. Unlike other teleconferencing technologies which tend to depict the same objects across all media, CVEs naturally support the idea of trading off directed and peripheral awareness across different media.
•
within a single shared display space, thereby enabling participants to see who is attending to, or working with, what aspects of the information, from spatial cues such as body position, gaze direction and representations of virtual limbs.
Representation of users and information within a single display space Many teleconferencing technologies fail to adequately integrate communications channels with shared information. For example, shared drawing tools and editors are usually displayed in windows that are separate from the representations of the participants. In contrast, CVEs locate participants and information
BT Technol J Vol 15 No 4 October 1997
•
construct a predictive model of network traffic valid for CVEs which are based on a peer-to-peer unicast network architecture — this involved the statistical analysis of system logs and network traffic measurements captured from virtual meetings, identify key social issues inherent in the use of CVEs, especially potential limitations of the technology or new emergent social phenomena — this involved a programme of ‘usability’ studies.
A secondary effect of the project has been to refine the methodologies required for dealing with these kinds of issues. Section 2 of this paper provides a brief description of the MASSIVE-1 system and of the underlying spatial model of interaction upon which it is based. Section 3 describes the structure and organisation of the experiments. Sections 4 and 5 then focus on the network traffic analysis and model, while section 6 discusses the social issues that have been raised. Finally, section 7 brings us fully up to date by describing the design of the new MASSIVE-2 system and introducing two new projects, both involving BT and the University of Nottingham, which build on this work within the context of so-called ‘Inhabited Television’ applications.
NETWORK AND USABILITY CHARACTERISTICS OF VR CONFERENCING 2.
A brief overview of MASSIVE-1
F
irstly, a brief overview of the MASSIVE-1 VR-teleconferencing system is provided, describing both its functionality and its underlying network architecture. MASSIVE-1 was implemented as part of EPSRCsponsored PhD research. The system runs on Silicon Graphics workstations over standard Internet protocols. A detailed description can be found in Greenhalgh and Benford [3]. 2.1
Functionality of MASSIVE-1
MASSIVE-1 supports multiple virtual worlds connected via portals. Each world may be inhabited by many concurrent users, where each user can independently navigate their own viewpoint within the world. These users can communicate using combinations of graphics, audio and text media. The graphics medium renders objects visible in a 3-D space and allows users to navigate this space with six degrees of freedom. The audio medium supports both real-time conversation and the play-back of preprogrammed sounds. The text medium provides a plan view of the world via a window (or map) which looks down on to a 2-D plane across which users move (similar to some multi-user dungeons). Text users may interact by typing messages to one another or by emoting (e.g. smile, grimace, etc). These different media may be arbitrarily combined according to the capabilities of a user’s terminal equipment. Thus, at one extreme, the user of a sophisticated graphics workstation may simultaneously run the graphics, audio and text clients (the latter providing a map facility and allowing interaction with non-audio users). At the other extreme, the user of a dumb terminal (e.g. a VT-100) may run the text client alone.
munication capabilities of the users they represent (e.g. ears suggest audio capability, eyes suggest graphics capability, and so forth). A simple mouth object is also provided which appears whenever a user speaks above a specified volume threshold. The most sophisticated aspect of MASSIVE-1 is the way in which all communications media are driven by the so-called ‘spatial model of interaction ’ [5]. The spatial model defines a set of high-level mechanisms called ‘aura’, ‘awareness’, ‘focus’, ‘nimbus’ and ‘adapters’ which enable users to negotiate social interaction in terms of different levels of mutual awareness. These mechanisms also drive underlying network connectivity and level of detail for the different media. The spatial model assumes the existence of some kind of shared space (i.e. a shared co-ordinate system), populated by objects which are exchanging information over a set of media types (e.g. graphics, audio, text and video). As implemented in MASSIVE-1, aura is a bounding volume on a user’s personal presence. Auras are medium specific, so that a user might have a different-sized aura for each medium. Consequently, different media have different scopes of interaction (e.g. a user might be seen at a greater distance than they are heard). A collision between two users’ auras (as notified by the MASSIVE-1 aura collision detector process) results in a network connection being established. Figure 1 shows a space containing five objects which, as a result of their auras, are currently connected into two separate conversing groups for this particular medium (there might be other patterns of connectivity in other media).
MASSIVE-1 is a specific VR-conferencing application and many of the features that one might expect of a general VR platform are not supported (e.g. full immersion and the ability to directly manipulate objects in a virtual world). The core functionality that is provided includes:
A
C
D
B
• • •
•
E
moving with six degrees of freedom, communicating — speaking, triggering simple graphical gestures, and exchanging text messages, adopting a range of different camera views (e.g. out of body, over the shoulder, bird’s-eye and mirror views) with the added ability to zoom the virtual camera in and out, posting text messages on simple message-board objects located within the virtual world.
Each user may specify their own graphics embodiment via a configuration file. In addition, some default embodiments are provided which are intended to convey the com-
aura in medium M
Fig 1
network connection in medium M
Auras used to establish network connections.
Once connections have been established in this way, the exchange of information across these connections is determined by mutual levels of awareness. Awareness in MASSIVE-1 is a quantifiable measure of the relevance that one object has to another at a given moment in time. Awareness can loosely be interpreted as an expression of desired quality of service for a given connection. Awareness is continually renegotiated as objects move around space BT Technol J Vol 15 No 4 October 1997
103
NETWORK AND USABILITY CHARACTERISTICS OF VR CONFERENCING through the further mechanisms of focus and nimbus. Focus models an observer’s allocation of attention across space and nimbus the corresponding projection of their presence into space. The more that an object is within your focus the more you become aware of it. The more an object is within your nimbus the more it becomes aware of you. As with aura, focus and nimbus can be defined on a per-medium basis. The awareness that an observing object, A, has of an observed, B, is therefore a function of A’s focus on B and B’s nimbus on A. Figure 2 shows how different arrangements of focus and nimbus can result in different levels of awareness. The figure is only concerned with A’s awareness of B and hence only involves A’s focus and B’s nimbus. In Fig 2(a) A is focusing on B and B is nimbusing on A, resulting in A having full awareness of B. In Fig 2(c) the converse is true, so that A has no awareness of B. Figure 2 (b) shows the two cases where peripheral awareness occurs — in one of these A is focusing on B but B is not nimbusing on A (perhaps A is monitoring B?) — in the other B is nimbusing on A but A is not focusing on B (perhaps B is trying to interrupt A?).
A
B
(a) full awareness
example, audio awareness levels are mapped on to volume with the net effect that audio interaction is sensitive to both the relative distances and orientations of the objects involved. Unlike Fig 2 where focus and nimbus are simple containment volumes of space, MASSIVE-1 defines them as scalar functions across space. The shapes of these functions are such that focus and nimbus are at a peak directly in front of the user and then gradually drop off with distance from the user and with angle from their direction of face. Consequently, a range of different levels of awareness are possible. In the current implementation, users can choose between three predefined settings for focus and nimbus — normal (intended for general conversation), narrow (intended for private conversation) and wide (intended for browsing). The wide setting is the default and is used most of the time. Figure 3 shows how a virtual world appears in the graphics interface. Three embodiments can be seen, of which the one in the foreground (‘Chris’) is our own seen from an out-of-body camera view. A message-board can also be seen in the background. Figure 4 shows an example of the text interface. Top left of Fig 4 is a plan view of a virtual world; top-right is the key to the symbols used in this plan as well as an indication of current awareness levels between the user and objects in the world; and at the bottom the on-going text dialogue.
A B B
A
B
A (c) no awareness
(b) peripheral awareness nimbus
focus
Fig 2
Focus, nimbus and awareness.
Users can manipulate aura, focus and nimbus, and hence awareness, implicitly by moving and re-orienting themselves within space or explicitly by choosing between different settings or even directly changing their shape and extent, e.g. retracting their aura in order to drop some network connections. Various adapter objects can also be used to dynamically alter aura, focus and nimbus. Examples of adapters in MASSIVE-1 include a podium which increases the range of aura and nimbus and a conference table which gives its users common auras, foci and nimbi, centred on the table.
104
MASSIVE-1 applies these concepts to each of its three media so that audio volume, graphical level of detail and the display of text messages are all awareness driven. For BT Technol J Vol 15 No 4 October 1997
Fig 3
2.2
Three MASSIVE-1 embodiments.
Architecture of MASSIVE-1
This section focuses on the underlying network architecture of MASSIVE-1 as some knowledge of this is required in order to understand the analysis of network traffic later on (see Greenhalgh and Benford [3] for a detailed description). The processing model used in MASSIVE-1 is of independent computational processes communicating over typed peer-to-peer connections. Each computational process may support any number of interfaces, each of which is characterised by a combination of remote procedure calls (RPCs), attributes and streams in
NETWORK AND USABILITY CHARACTERISTICS OF VR CONFERENCING triggered. The implementation of adapters exploits the ability to parameterise focus and nimbus functions; when triggered, an adapter passes some new parameters back to the object across the adapter medium. These new parameters replace the object’s current parameters. Thus, an adapter may extend the range of focus and nimbus, may change their shape (i.e. conical angle), or may alter the way in which they fade to a background level. The object restores its normal parameters, when it moves away from the adapter. 3.
An overview of the experiments
T Fig 4
The text interface.
order to support a mixture of distributed VR functions (e.g. collision detection), distributed system functions (e.g. trading), and continuous media (e.g. audio). In the interests of scalability, responsibility for detecting aura collisions and establishing connections is distributed. On entering a world, an object contacts the ‘master trader’ for this world and declares its interfaces (media). The master trader returns the addresses of the aura collision detectors responsible for these interfaces. At present there is a separate aura collision detector for each type of interface. These detectors monitor for aura collisions and, when they occur, pass peer interface references (combinations of IP address, port and a local interface ID) to the objects involved, allowing them to establish a connection. Once connected, the calculation of mutual awareness levels using focus and nimbus is the responsibility of the peer objects. In the current implementation, objects are described solely by a sphere located in space, and focus and nimbus are described by scalar fields over space, which are sampled at the location of a peer object to generate focus and nimbus values. The current awareness function is multiplicative (i.e. focus and nimbus are multiplied to give awareness). This gives equal control to the observer and the observed, and is subtractive in nature, i.e. either party can force zero (no) awareness, but neither party can force awareness against the other’s wishes. Current focus and nimbus functions describe conical volumes projecting forwards from an object with some additional transition volume where focus or nimbus drops off to a specified background level. The operation of focus and nimbus may therefore be controlled by a few key parameters such as conical angle, maximum radius, background level and transition rate, allowing variation from generally spherical to tightly focused regions. Adapters exist in their own medium, complete with aura, focus and nimbus. As an object moves about, it may connect to an adapter as a result of an aura collision in the adapter medium. When the object’s awareness of the adapter subsequently crosses some threshold the adapter is
he ‘Inhabiting the Web’ project staged twenty virtual meetings using the MASSIVE-1 system. These meetings involved up to ten participants from BT Laboratories and the five universities listed above. On average, the meetings were held once a fortnight. A suite of meeting worlds and associated tasks were specifically designed for the project. The default workstation used by participants was a Silicon Graphics Indy, although a few participants had access to higher specification machines such as Indigo 2s. The meeting worlds were most often hosted on a twin processor Onyx 2 at Nottingham which was used for its computational power, not for its graphical rendering performance. The SuperJANET network provided connectivity between the partners, with appropriate tunnelling through the fire-wall at BT. Four kinds of data were captured from the meeting:
• •
•
•
direct video output from participants’ machines at Nottingham and BT Laboratories, MASSIVE-1 log files were created at each site, where each file recorded and time-stamped all MASSIVE-1 events for a given local client (e.g. all movements, speech, gestures and so forth for an individual user), output from the ‘tcpdump’ command recording details of packet type (e.g. UDP, TCP), size and IP source, and destination addresses for packets which were observed on the local network (i.e. shared Ethernet) at Nottingham, completed questionnaires which were designed to capture information about users’ backgrounds and experiences and which related to specific experimental tasks.
The twenty virtual meetings can be divided into four distinct phases — familiarisation and training, stabilisation, experimental tasks, and post-project social events. Familiarisation and training involved three initial meetings with standard MASSIVE-1 worlds, where participants were given some tutorial instruction on how to navigate and control their embodiments. They also involved some exploration of possible experimental tasks. Stabilisation focused on creating a stable experimental infrastructure in terms of the MASSIVE-1 software, virtual worlds, and also BT Technol J Vol 15 No 4 October 1997
105
NETWORK AND USABILITY CHARACTERISTICS OF VR CONFERENCING user skills and procedures (e.g. data capture techniques). During this time, the Inhabiting the Web virtual worlds were created and refined and a number of problems with software and networking were identified. Technical problems included configuration of the firewall at BT, problems with variable network delays and setting appropriate time-out values in MASSIVE-1’s protocols, problems with overly complex worlds and/or underpowered server machines, as well as more general bugs which had to be fixed.
participants interacting with three message-boards as part of a team game. Figure 7 shows the obstacle course located in the end-of-project party world. Figure 8 shows the final scene from the ‘Fruit Sketch’.
The experimental phase of the project involved six meetings in which different tasks were carried out. The tasks were chosen to exercise a range of different MASSIVE-1 capabilities (e.g. movement, speech, interaction with the board and the resizing of focus) as well as different modes of co-operation (e.g. team games which required co-operation within teams and also competition between them). The content of these six meetings included:
•
• • •
• •
team and individual word games (e.g. teams pairing off categories of words which were written on two boards and writing the answers on another board) — this exercised navigation, conversation, dynamic group formation (e.g. to discuss answers in teams), board usage and peripheral awareness (e.g. overhearing the other team’s discussions),
Fig 5
Gathering around the meeting table.
Fig 6
A word game on the message boards.
Fig 7
The obstacle course and disco world.
searching for objects (e.g. fragments of text) or solving a sequence of clues located in different virtual worlds — this exercised the use of portals, dynamically altering audio focus so as to identify individual sound sources from among a large collection of sources — this exercised focus manipulation, the ‘balloon debate’ (a hypothetical discussion of which character should be thrown out of a rapidly descending balloon) — this exercised conversation among a relatively static and focused group, playing hide and seek in a virtual maze and completing a virtual obstacle course — these exercised navigation and awareness, disco dancing — this exercised rapid navigation and movement.
Finally, at the request of the participants (several of whom had never met face-to-face), several post-project meetings have been held. To date, the focus of these meetings has been the staging of a dramatic sketch (Monty Python’s Fruit Sketch).
106
Figures 5—8 show different scenes from the ITW meetings and virtual worlds. Figure 5 shows several users gathering around the table in the central meeting space where Jolanda is giving a talk. Figure 6 shows several BT Technol J Vol 15 No 4 October 1997
NETWORK AND USABILITY CHARACTERISTICS OF VR CONFERENCING
• •
changing focus and nimbus settings,
•
making graphical gestures,
•
4.
Enacting the ‘Fruit Sketch’.
Network traffic analysis — user profiling
A
primary goal of the ITW project was to explore the characteristics of the network traffic generated by MASSIVE-1 and, as a generalisation, by peer-to-peer unicast-based CVEs. More specifically, the aim was to be able to predict what volumes and patterns of traffic might be expected under different circumstances (e.g. for different numbers of users) and, conversely, what constraints on scaling would be imposed by the use of different network technologies.
The analysis proceeds in two stages. Firstly, a profile of typical user behaviour is developed which allows predictions of how an individual participant might be expected to behave (e.g. how much time they might spend moving, how often they might talk, and so forth) and also to what extent are different users actions correlated with one another (e.g. whether participants tend to move together in groups). Secondly, this profile is combined with knowledge of the MASSIVE-1 protocols in order to predict network traffic for different numbers of users. The first part of this analysis might be expected (within limits) to apply to a wide range of CVEs. The second part is specific to MASSIVE-1, although the general pattern that emerges might apply to the class of peer-to-peer unicast CVEs and a similar process could be repeated for other systems given sufficient knowledge of their protocols. The data presented in the following is based upon six experimental ITW meetings.
•
starting the application,
•
moving to a new virtual world (through a portal),
speaking (or, more specifically, whether the user’s graphical ‘mouth’ is displayed), sending and receiving network data.
Each program generates its own independent log file, and one of the problems of analysing this information is relating the information from different hosts, especially since each machine’s system clock is typically different. 4.1
Analysis of movement data
The area of user behaviour which has proved most amenable to analysis based on the available MASSIVE-1 data is that of user movement. In particular the MASSIVE-1 event logs from a user client application record that user’s moment-by-moment position and orientation within the virtual world, and also any change of world (due to passing through a portal). Firstly, an overview is provided of the movement data available, which is then used to address three issues for a subset of the meetings held using MASSIVE-1. The things that need to be established are:
• • •
the fraction of time which people spend moving rather than stationary, and whether participants move simultaneously or independently, whether participants move through portals singly or in groups, and if, moving as groups, how long the transition takes, whether participants return to worlds which they have already visited, and if so after what period of time. The implication of each of these is then considered:
• •
Quite early in MASSIVE-1’s development, facilities were added to all programs, though especially the user client programs (the visual, audio and text clients), to generate time-stamped logs of key events. The events which can be recorded include:
updating the graphical view (i.e. rendering a single frame),
• •
Fig 8
moving and changing orientation within a virtual world,
•
network and computational requirements for handling movement within virtual worlds, the scope for using multicast to handle inter-world transitions by a group’s participants, whether ‘world caching’ (i.e. the user’s local machine retaining a copy of the world for some time after they have left it in case they return again) would be effective and if so on what time-scale.
Figure 9 is a visualisation of movement-related information from the ITW meeting held on 25 September 1996. BT Technol J Vol 15 No 4 October 1997
107
balloon
user 1 user 3 user 5 user 7
games world
user 1 user 3 user 5 user 7
meeting world
user 1 user 3 user 5 user 7
foyer
user 1 user 3 user 5 user 7 user 1 user 3 user 5 user 7 15-00-00 15-10-00 Fig 9
15-20-00 15-30-00 15-40-00 time
Time is shown along the horizontal axis, while a combination of participant and world is presented on the vertical axis. More specifically, the plot is divided into six horizontal bands which correspond to the six virtual worlds which were visited by participants during this meeting. The top-most band corresponds to the ‘presentation world’, the next to ‘balloon world’, and so on. Each participant is allocated a consistently placed slice within each of these bands; when a participant is present in a particular world this is represented by a horizontal bar in that participant’s slice of the world band. When participants change worlds this is represented by vertical dashed lines between the worlds in question. Finally, the width of the horizontal line which represents a participant’s presence within a world is varied according to whether that participant is moving or not; a thick line or box indicates that the user is moving, whereas a thin line indicates that they are stationary. So, considering the top-most band of Fig 9, it can be seen that participant number 3 jumps from ‘meeting world’ to ‘presentation world’ at approximately 15:10, moves about for a short time (probably checking if anyone else is there) and soon returns to ‘meeting world’. Time spent moving
108
Figure 10 shows the percentage of time which participants spent actively moving within a world. Each participant was considered independently, and for each visit BT Technol J Vol 15 No 4 October 1997
15-50-00
16-00-00
16-10-00
Visualisation of movement data from 25 September 1996 ITW meeting.
to a world the time for which they were moving and the total time for which they were present was established. In Fig 10 the horizontal axis corresponds to the percentage of time spent moving, while the vertical axis indicates the number of person-seconds for which that level of movement was observed. Both cumulative and point distributions are shown with 1% bucket sizes. 140000 occurrence, person-seconds
presentation world
user 1 user 3 user 5 user 7
gateway
NETWORK AND USABILITY CHARACTERISTICS OF VR CONFERENCING
120000
100000 80000
cumulative
60000
point
40000 20000 0 0
Fig 10
20
40 60 time spent moving, %
80
100
Percentage of time present in a world which was spent in motion.
The average percentage of time spent moving for all participants and worlds is 19.6%, though it is clear from
NETWORK AND USABILITY CHARACTERISTICS OF VR CONFERENCING Fig 10 that this measure is highly variable. Independent of world visited, the figure for each participant varies from 7.2% to 28%. On the other hand, for each world, averaging over all of its visitors, the percentage of time spent moving varies from 7.5% (in the classical music world of the ITW end-of-project virtual party) to 54.6% (in the disco world, home of the disco dancing competition); in the main meeting world the average value was 16.7%.
occurrence, seconds
The figures above are based on analysing each participant independently. In addition each world was analysed over the duration of the meetings to determine whether participants tended to move at the same time, or independently. Figure 11 shows the distribution of the number of participants in the same world at the same time who were moving. The solid line shows the observed distribution, while the dotted line shows the distribution that would be expected if all participants ignored each other and just moved when they felt like it (based on the same overall time spent moving, as previously determined). It is apparent from the graph that participants do co-ordinate their movements to some extent — the deviation from random activity is significant at the 99.9% level. However, the overall shape of the graph is very similar, and large numbers of participants moving simultaneously is possible — but less likely — in either case.
Once a participant is stationary no further positional updates are necessary until they start to move again. Consequently the amount of time which participants spend moving can be a significant factor in assessing network and computer requirements. The overall average percentage of time spent moving observed in the six meetings being analysed here was 19.6%, as noted above. This may be taken as a base-line value. However, there is also a large variation between individuals and also a significant task dependence, as indicated by the differing averages in different worlds. Consequently, the figure arrived at here should be treated as something of a rule of thumb, rather then a definitive answer. Additionally, when considering the combined instantaneous load due to several participants, it has been noted in this analysis that it is not valid to assume that their activities will be independent and uncorrelated. Rather, at least when participants are involved in a common task, there is a small but highly significant element of correlation, statistically, between their activities. This argues for additional caution when considering, for example, the scope for exploiting statistical multiplexing of movement-related traffic for larger numbers of users (i.e. being able to require or reserve less bandwidth on the basis that while some users are moving — and generating network updates — many other users will not be).
14000
actual
12000
random
Group world transitions
population
Having discussed one key aspect of movement within a world, two aspects of moving between worlds are now considered. Firstly, the likelihood and form of co-ordinated inter-world transitions by groups of participants is considered, and, secondly, whether and in what circumstances participants return to previously visited worlds.
10000 8000 6000 4000 2000 0 1
Fig 11
2
5 3 4 number of participants
6
7
8
Distribution of numbers of virtually collocated participants moving simultaneously.
The time which participants spend moving and the amount of correlation between participants will have implications in terms of the network and computational requirements of communicating, processing and presenting each participant to the rest of the virtual world. Specifically, when a participant is moving, position and orientation updates need to be sent over the network and received and processed by each observing process. When dealing with non-deterministic agents (e.g. people) techniques such as dead reckoning may — or may not, depending on the application — reduce the number of such updates; however, they can never entirely eliminate the need for some of them.
It would be expected from some of the activities organised in the meetings being analysed that group world transitions would occur. For example, participants would typically gather initially in the gateway world and wait for the others to arrive. Then at some point the meeting organiser would invite everyone to go through to the meeting world for the formal start of the meeting, and all of the participants would move — in a vaguely co-ordinated fashion — through to the meeting world. The purpose of this aspect of the analysis is therefore not simply to discover whether such transitions occur — it is already known that they do. Rather, it is the significance and character of such transitions that needs to be assessed. For the purpose of the automated analysis, a group world transition is defined as an event in which two or more participants who are in a world at the same time move via a single portal-jump to another world so that they are together again. Figure 12 shows the incidence of singleton and group world transitions in the meetings analysed. The solid line BT Technol J Vol 15 No 4 October 1997
109
NETWORK AND USABILITY CHARACTERISTICS OF VR CONFERENCING shows the number of incidents, while the dashed line shows the total number of participants involved in those incidents. 250
incidents participants
occurrence
200
150
100
50
0 0 Fig 12
1
2
3 4 group size
5
6
7
8
Distribution of group size for group world transitions.
Summarising the underlying data:
•
participants jumped to new worlds on a total of 584 occasions, of which 337 (58%) were in groups of two or more,
•
individuals or groups made world transitions on 350 occasions, of which 103 (29%) were group transitions and the average size of those groups was 3.27 participants.
Figure 13 shows the distribution of world entry delay for participants involved in group transitions, i.e. for each member of a group (excepting the leader) it shows how much time elapsed between the group leader and the group member reaching the destination world. The range of delay shown on the graph, up to 30 seconds, accounts for 203 (87%) of the 234 non-leading participants to make group world transitions; 104 (44%) of these occur within 5 seconds, while 159 (67%) occur within 10 seconds. 250
200
150 occurrence
distribution (1% buckets) cumulative
100
50
0
110
0
Fig 13
5
10
15 20 delay, seconds
25
30
Distribution of group member arrival delay for group world transitions.
BT Technol J Vol 15 No 4 October 1997
Group world transitions are important when considering the design and requirements of this kind of system, because moving to a new world is a significant event which will almost always involve an exchange of data between the participant’s processes and the rest of the system. In MASSIVE-1, for example, on entering a new world the user’s client applications terminate connections to objects in the old world, are informed of the existence and identity of nearby objects in the new world, establish network associations with each other, and exchange general and medium-specific information such as location, awareness, name, graphical appearance, etc. This can result in a significant but transient burst of network traffic and implied load on other processes. Different systems will organise this information in different ways and obtain it from different sources, but there will still be some requirement for the participant’s applications to learn about the new world. This makes the occurrence of group world transitions important in two respects:
•
•
a co-ordinated movement by a large group could generate a much greater transient load than might be expected if inter-world movement were assumed to be independent and uncorrelated, specialised system support for group world transitions (for example, based on the use of network-supported multicasting of new world information to all group members) could not only alleviate this problem, but also reduce the total load relating to world transitions when compared to a model of independent and uncorrelated movement.
For example, for the meetings analysed, imposing a world transition delay of 10 seconds would both ensure that state transfers for the same world did not need to be performed more than once in any 10-second period, and would require approximately 325 unicast and 100 multicast state transfers rather than 584 unicast state transfers. Imposing longer delays on world transitions would increase the effectiveness of group transfers, by allowing more transitions to be effectively grouped, whereas shorter delays would include fewer transitions. Before moving on to consider participants returning to worlds, a little must be said about the general applicability (or otherwise) of this result. As was noted at the beginning of this section, group world transitions were an organised aspect of the activities being analysed — will they occur in other applications and situations? Such an question cannot be answered definitively without gathering a great deal more data about a wide range of different applications and scenarios. However, some more subjective and tentative observations can be made:
NETWORK AND USABILITY CHARACTERISTICS OF VR CONFERENCING
• •
MASSIVE-1 is not alone in adopting a multiple world model with portals between worlds (see, for example, DIVE [6]), the world and portal model was widely accepted and effectively employed by participants.
It may be argued from these observations that a multiworld structure is a more generally useful and appropriate virtual design style. So it may be anticipated that group world transitions will occur in many applications involving formal or informal co-operation or interaction, e.g. as common interest groups form and dissolve, or as timelinked activities such as performances and meetings begin and end. Returning to worlds The final aspect of participant movement to be considered in this analysis concerns the incidence and character of return visits to virtual worlds, i.e. when a participant visits the same virtual world on more than one occasion in the same meeting. Figure 14 shows the cumulative distribution of time elapsed between consecutive visits by individual participants to any world. There are a total of 353 return visits in the data analysed compared with 231 first visits. The average time lapse between leaving and re-entering the same world is just over 7 minutes, while half of these return visits occur within 3 minutes. 400 350 300
occurrence
250 200 150 100 50 0 0
Fig 14
500
1000
1500 2000 2500 time, seconds
3000
3500
Distribution of time elapsed between consecutive visits to the same world.
possibility and utility of world state caching in (or near) participant’s applications. For example, for the data analysed, if each user client maintained a cache of world state for at least 6 minutes after visiting a world and if the worlds did not change on this time-scale then approximately 40% of new world state transfers could be satisfied from the cache. The demonstration in the above example of the potential utility of world state caching must be qualified in two areas — the extent to which return rates can be generalised from the specific meetings analysed, and the extent to which worlds can be expected to remain static over the time periods in question and how this can be established by the applications. Dealing with these issues in turn, it is clear that, if return visits were more common or sooner, caching would become increasingly effective, and conversely, if return visits were rarer or more delayed, caching would become less effective. As with group world transitions, it may be argued that most world return visits in the meetings considered were peculiar to the style and organisation of these meetings and not generalisable. However, there is again a (admittedly limited) counter-argument that these worlds and meetings were not established to demonstrate these effects, but that these effects emerge from natural choices of world and meeting structure which may also occur in other systems and applications. For example, the worlds for the ITW meetings were structured (for the most part) in a hierarchy, which is a very common method for organising related objects. A natural consequence of this is that the worlds closer to the root of the hierarchy were visited more frequently and were returned to more often, e.g. by participants in the process of moving from one task-oriented world to another. So it might be expected that revisiting of worlds will be a general effect. Secondly, the potential validity of cached data — and establishing its validity or otherwise — is more clearly a general issue. In MASSIVE-1 worlds, the background content is static while the participants are highly dynamic. In other systems and applications the differences may be less clear cut. In any case, for caching to be effective there must be (significant) elements of world state which do not change between visits, and there must be some well-defined method of establishing what has not changed, and of efficiently combining cached and new information. This is left as an exercise to the reader. 4.2
The occurrence of revisiting worlds is important for the same fundamental reason as group world transitions were considered — because changing worlds is a significant event which implies an exchange of information with corresponding requirements for network and computing resources. In particular, world return visits are important because of the implications which they have for the
Analysis of audio data
In addition to the analysis of movement and world transitions presented above, there has also been an analysis of audio-related activity in the same six MASSIVE-1 meetings. The figures that were available relating to participants’ audio activity were records of audio data packets captured in the network traffic log, and events in the BT Technol J Vol 15 No 4 October 1997
111
NETWORK AND USABILITY CHARACTERISTICS OF VR CONFERENCING
Each of these sources of data corresponds to a simple threshold test of audio volume. The visual mouth appears when the sound captured by the participant’s microphone exceeds an experimentally chosen level, while the audio service sends audio packets (which are recorded in the network traffic log) when the sound captured by the microphone exceeds a lower experimentally chosen level. The aim here is to be generous in transmission (i.e. to transmit anything that might possibly be speech), but to only provide visual feedback via the ‘mouth’ when there is a high volume level so as to encourage people to speak up. These sources of data will each be considered in turn before joint conclusions are drawn. The data for logged network audio traffic from ‘tcpdump’ should include all audio in the same world as the principle meeting organiser. It extends to 33 198 personseconds of audio from 125 571 person-seconds of apparent presence, i.e. the average speaking proportion is 26.44%. Apparent presence of audio participants is deduced from periodic audio timing packets which are sent by the audio service even when full audio data is not being transmitted. Figure 15 shows the number of simultaneous speakers for the data set (solid line) and the expectation if speaking was an independent event, with no correlation between virtually collocated participants (dotted line). The dashed line shows world population; if all the participants spoke continuously then this curve would result. The observed distribution differs from the uncorrelated case at the 99% significance level, but the difference at each data point is small — the difference is only significant because of the very large sample size. actual
8000
random
occurrence, seconds
7000
population
6000 5000 4000 3000 2000 1000 0 1
2
Fig 15
112
3 4 5 6 number of participants
7
8
9
Correlation of network audio packets.
The data concerning the visual representation of a ‘mouth’ (actually more of an abstract speech balloon) is available where participants have correctly enabled MASSIVE-1’s own logging facilities and have returned the event log files. The total participant time covered, 129 550 BT Technol J Vol 15 No 4 October 1997
person-seconds, is similar to the network audio data. However, the amount of time for which the mouth is shown is much less — 9355 person seconds, or 7.22%. Figure 16 shows the number of simultaneous ‘speakers’ (actual and uncorrelated expectation) and world population for this data set. 9000 8000 7000 occurrence, seconds
MASSIVE-1 user client log files indicating when the visual ‘mouth’ was visible.
6000 5000 4000 actual 3000 random 2000
population
1000 0
1
2
Fig 16
3 4 5 number of participants
6
7
8
Correlation of visual ‘mouth’ data.
As for the network audio data the deviation of the observed number of simultaneous speakers from an uncorrelated distribution is significant at the 99% level, but small in percentage terms. Complete event logs for all participants are not generally available, and this is reflected in the shift of the world population distribution towards the left (fewer simultaneous participants) when compared to the network audio data. The distributions for speaking drop off much more steeply than for the network audio data partly because of this, but primarily because of the much smaller amount of speaking recorded. Before the analysis, it was anticipated that the data for speaking might exhibit significant anti-correlation, reflecting the assumption that one participant would be less likely to speak when another participant was already speaking. In fact this was seen to a limited extent in the visual ‘mouth’ data, but not at all in the network audio data. At first sight this might suggest that the participants are ignoring one another, or that the network delays might cause a break-down in normal conversational turn-taking. However, a subsequent comparison between segments of the logged data and the video recordings revealed a more mundane reason — the majority of the apparent ‘speaking’ was actually due to background noise (e.g. typing, other activities in the office, breathing noise) and feedback from open speakers. This was especially true for the more sensitive network audio data. A number of observations and reflections can be made:
•
use of open speakers (at least without sophisticated echo-cancellation techniques) can increase the apparent number of speakers and the resulting network load by replaying sounds back into the system,
NETWORK AND USABILITY CHARACTERISTICS OF VR CONFERENCING
•
•
using more aggressive silence detection algorithms could reduce network traffic (moving the 26% speaking rate for network data towards the 7% speaking rate for the ‘mouth’), but at the risk of missing significant quiet utterances and non-speech noises (e.g. hmms, grunts and ahs), whatever the participant’s ‘real’ behaviour in terms of speaking (as determined by a human expert, for example), it is the behaviour that may be deduced automatically (as here) that is significant for assessing network and computational requirements.
Elements of the above analysis will be used in the next section which develops a network traffic model for MASSIVE-1. 5.
A predictive model of network traffic
T
his section describes the development of a model of the network traffic required to support a MASSIVE-1 teleconference. A key element of this analysis is consideration for the way in which requirements change with the number of users. MASSIVE-1 has not been used for very large numbers of simultaneous users — the largest meeting to date involved ten participants. However, this traffic model allows us to consider the effects of much larger scale usage. Firstly, there is a description of the key elements of the user model employed and the additional assumptions required, and then briefly the main factors contributing to expected network traffic; these are combined with the user model to give a simple approximation of expected total network traffic. The section concludes by reflecting on the resulting traffic characteristics. The key elements of the model and additional assumptions required are listed below:
• •
• •
•
all users have a full complement of text, graphical and audio clients and use standard embodiments, the most significant user events are moving and speaking (text messages and gestures are ignored) — for these, users move 20% of the time (section 4.1) and speak (or rather send network audio data) 25% of the time (section 4.2), the average frame rate is 6 Hz (observed in use on a Sun 10ZX, and adequate for normal use), users move between worlds or groups of users such that they change the peers with which they interact once per minute (this value is somewhat higher than might be the case in the experiment meetings, but it will be seen that the related traffic component remains a relatively insignificant part of the total), all users interact with (on average) M other users, e.g. users might organise themselves into variable and changing groups of average size M+1 participants,
•
the contribution of background objects is much less than that of users, and can be ignored (in MASSIVE-1 a background object generates approximately one tenth the traffic of a participant).
In MASSIVE-1 the main causes of network traffic are co-ordinating multiple user clients, updating the aura collision manager (due to movement, world transition or aura adaptation), establishing new associations with other users and objects upon aura collision, and interacting with other users and objects while in aura range. Of these four items, the first two are independent of the number of other participants using the system; the third — establishing new associations — depends on the rate at which groups or associates change; the fourth — interaction — depends on the number of other users and objects within aura range at any time (denoted by M). The three key events considered are user movement, speech, and the arrival of a new interaction partner (i.e. an aura collision and subsequent data exchange). Table 1 shows the basic traffic generated by each of these events independent of any particular assumptions about user behaviour; each has a component which is per user only (the upper row), and a component which is also dependent on the number of peers which each participant has (the lower row). This is combined with the user model (average movement rate of 1.2 Hz, speaking rate of 25%, peer change rate of once in 60 seconds) to give the average resulting network traffic bandwidths in Table 2. Table 1
Network traffic resulting from key events. Movement (kbyte/step)
Audio (kbyte/sec)
New peer (kbyte/peer)
Per user
1.2
0
2.1
Per peer per user
2.1
8.3
13.2
Table 2
Average network bandwidths.
Movement (kbyte/sec)
Audio (kbyte/sec)
New peer (kbyte/sec)
Total (kbyte/sec)
Per user
1.4
0