May 26, 2011 - environment to increase walk trips and reduce auto- mobile trips. ... High density; proximity to park, school, and commercial district. 19. 19th & ...
Evaluating the Performance of Pedestrian-Oriented Developments Summary of Site Visits and Research Design Options
C R E C The Center for Resource Efficient Communities
Evaluating the Performance of Pedestrian-Oriented Developments
Written by Eliot Rose, Nicola Szibbo and Ayrin Zahner. Editorial review and other input by Prof. Louise Mozingo (CREC Director) and William Eisenstein (CREC Executive Director). Graphic design by Crystal M. Ward. This paper was prepared by the Center for Resource Efficient Communities at UC-Berkeley’s College of Environmental Design. Funding for the study was provided by the Public Interest Energy Research (PIER) program at the California Energy Commission. Center for Resource Efficient Communities 390 Wurster Hall Berkeley, CA 94720
C R E C www.crec.berkeley.edu
Contents copyright of the Regents of the University of California, 2010. All rights reserved. November 1, 2010
The Center for Resource Efficient Communities
Contents 1. Introduction
3
2. Preliminary research design
3
3. Data collection
7
4. Findings
9
5. Next steps
10
6. Conclusion
13
Appendix A: Census Data for CREC Study and Comparison Sites Census Data
14
Appendix B: Observational Data for CREC Study and Comparison Sites Administrative Data and Site Overview Transportation and Street Type Data Overview Vegetation, Urban Design and Land Use Data Overview Site visit description notes
16 18 20 22
Tables and Figures Table 2.1 List of Study Sites
4
Figure 2.1 Map of Study Sites
5
Table 3.1: Census data collected for study and comparison sites
6
Table 3.2: Observational data collected for study and comparison sites
8
2
Evaluating the Performance of Pedestrian-Oriented Developments
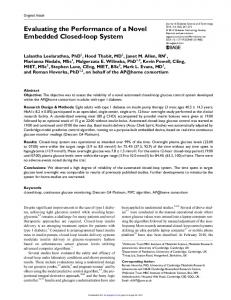
Source: National Association of Housing and Redevelopment Officials
Victoria Gardens in Racncho Cucamonga is a commercial development featuring unique pedestrian furniture, diverse architecture, and public art.
The Center for Resource Efficient Communities
3
Evaluating the Performance of Pedestrian-Oriented Developments Preliminary Research Summary
1. Introduction
Pedestrian-oriented developments are those that
environment to increase walk trips and reduce auto-
include a mixture of land uses, shorter distances
mobile trips. CREC identified a group of 21 pedes-
between likely origins and destinations, and de-
trian-oriented developments across California and
sign improvements to the pedestrian environment.
collected data about each site, both through site visits
Though several such developments have been con-
and sources such as the U.S. Census. The number of
structed within California in the last twenty years and
sites available for study and the large amount of data
planners commonly promote them, there has been
available on each site indicated promising trends to-
little post-occupancy evaluation of their performance
ward both increasing build-out of pedestrian-friendly
in actually increasing pedestrian activity in order to
developments and increasing focus on understanding
reduce energy use and greenhouse gas emissions.
non-automobile travel. The sites studied varied widely
Between September 2009 and June 2010, funded by
in terms of scale, type, mix of land uses, pedestrian
the California Energy Commission (BOA 246), the
design features, and location within the greater met-
Center for Resource-Efficient Communities (CREC)
ropolitan area, suggesting that alternative research
undertook a preliminary study to determine how to
designs will be more fruitful in determining which
best proceed with research that will help planners
design factors most strongly contribute to pedestrian
assess the potential of improvements to the pedestrian
activity and trip substitution.
2. Preliminary research design
Site selection
CREC selected study sites that were examples of
and Southern California, which contain California’s
pedestrian-oriented development by speaking with
most rapidly growing urban areas. Since research has
experts in the field and reviewing articles on planning
shown that weather plays a large part in pedestrian
and development, promotional literature from the
behavior, CREC chose sites located in several differ-
developers of each site, and images of each develop-
ent climate zones, including inland areas that expe-
ment. The study sites covered a wide spectrum of
rience the hottest summer temperatures. For each
development types, including both infill and green-
study site, researchers also selected a comparison site
field sites; new developments as well as streetscape
that was adjacent and similar in character to the study
improvement projects in historic downtowns; pedes-
site, but lacked the improvements to the pedestrian
trian-oriented and transit-oriented development; and
environment that the study site had received. Figure
commercial, residential, and mixed use areas. Study
2.1 and Table 2.1 summarize the location and key
sites were concentrated in the San Joaquin Valley
characteristics of the study sites.
4
Evaluating the Performance of Pedestrian-Oriented Developments
Table 2.1: List of study sites
Site Name
City
Climate Zone
Type
Design Features
1
Theater Way
Redwood City
3
Commercial streetscape
Bicycle lanes and racks, street furniture, street trees, public art
2
Evelyn Corridor TOD
Mountain View
4
Residential streetscape
Bicycle lanes, parallel parking, planting strips
3
The Crossings
Mountain View
4
Residential streetscape
Common green space, trees, all parking on-street, bicycle lanes and racks
4
Castro Street
Mountain View
4
Commercial streetscape
Street trees, bike facilities, transit stops, outdoor dining, diverse architecture
5
Santana Row
San Jose
4
Mixed-use streetscape
Active retail, street art, performance art, diverse architecture, mixed uses
6
Victoria Gardens
Rancho Cucamonga
10
Commercial development
Pedestrian furniture, diverse architecture, public art
7
San Elijo Hills
San Marcos
10
Residential development
Pedestrian connections to trail network, bicycle lanes, traffic calming devices
8
The Esplanade
Chico
11
Mixed-use development
Street trees, pedestrian facilities, traffic calming, historic buildings, mixed uses
9
Fremont Medical Center
Yuba City
12
Medical development
Raised crosswalks, traffic-calming devices, pedestrianactivated beacons, pocket park
10
Aggie Village
Davis
12
Residential infill
High density; proximity to parks, bicycle facilities, and the train station
11
Village Homes
Davis
12
Suburban residential
Homes fronting on common greenspaces, bike/ped paths, narrow streets
12
Fremont Mews
Sacramento
12
Residential infill
Community garden, street art, high density, proximity to parks and historic districts
13
Project Good
West Sacramento
12
Residential infill
High density, community garden, proximity to transit and bicycle routes
14
Laguna West
Elk Grove
12
Residential greenfield
Community center, common greenspace
15
Downtown/Old Lodi
Lodi
12
Commercial streetscape
Mixed uses, historic buildings, pedestrian furniture, traffic calming, landscaping, proximity to train station
16
1st Street
Livermore
12
Commercial streetscape
Pedestrian furniture, pocket parks, street trees, bicycle racks
17
East Main Street
Visalia
13
Commercial streetscape
Street trees and awnings
18
Parkview Cottages
Bakersfield
14
Residential streetscape
High density; proximity to park, school, and commercial district
19
19th & Eyhe Streets
Bakersfield
14
Commercial streetscape
Traffic calming, pedestrian furniture
20
Depot Walk
Orange
8
Infill residential
High density, landscaping, proximity to rail
21
Palm Canyon Drive
Cathedral City
15
Commercial streetscape
Street trees, misters, public art, historical buildings, outdoor dining
The Center for Resource Efficient Communities
Figure 2.1: Map of study sites
8 9 10 11
13
1 2
12 14
4 3
15 5
16 17
18
19
6 20 21 7
5
6
Evaluating the Performance of Pedestrian-Oriented Developments
Table 3.1: Census data collected for study and comparison sites
Age (% of total population)
Race/ethnicity (% of total population)
Families Housing characteristics (% of total housing units) Housing costs ($)
Population 65+ years old White Black Native American Asian Pacific Islander Other Two or more Hispanic or Latino Families with own children (% of total households) Average household size Average family size Vacant Renter-occupied Median owner-occupied housing unit value Median gross rent Median vacant housing price
Educational attainment (% of population 25+ years old)
High school Some college Associate’s degree Bachelor’s degree Graduate degree
Employment status (% of population 16+ years old)
Employed Unemployed
Employment by sector (% of workers 16+ years old) Income ($)
Journey to work (% of workers 16+ years old)
Vehicle ownership (number of vehicles per household)
Mgmt. and professional Service Sales and office Farming Construction Production Median household income Private automobile Carpool Public transportation Walk Bicycle Other Worked from home Mean travel time to work (min) None 1 2 3+
The Center for Resource Efficient Communities
7
3. Data collection
Through site visits and research, CREC collected
to travel within a given site and how direct routes
ample data on all study and comparison sites. This
are to destinations both within and outside of the
data came from several different sources.
site. The automotive environment affects both
Census data
The U.S. Census collects data related to transportation, including journey and travel time to work, as well as demographic data on race and ethnicity, family size, housing, income, education, and employment.. Table 3.1 lists the census data collected by CREC for both study and comparison sites.
real and perceived pedestrian safety. Pedestrians are much more aware of the visual quality of their surroundings, and both architecture and vegetation can have a positive aesthetic impact. Furthermore, mature vegetation can provide much-needed shading in the hotter inland areas of California. If a site is surrounded by diverse destinations within walking distance it will be much easier for residents to
The demographic and economic characteristics listed
accomplish a variety of trip purposes by foot. (Walk
in Table 3.1 can play an important role in shaping
Score is an algorithm that rates a neighborhood based
travel patterns. Elderly residents are less likely to
largely on the distance to several different types of
drive, while families with children are more likely
destinations.) Finally, mild weather makes walking
to require an automobile than households without
more pleasant. Since CREC conducted site visits
children. Rental households may be more flexible
during May and June, the weather was generally mild
and able to locate closer to jobs than homeowners,
in most sites, with the exception of some inland areas
and affluent households may be better able to afford
where temperatures exceeded 90 degrees.
private automobiles. Meanwhile, the transportation data collected by the census should reflect successful
The starred factors in Table 3.3 are all used in various
design in pedestrian-oriented developments.
measures of walkability and pedestrian level of service
Appendix A contains the census data collected by
that are increasingly common in transportation
CREC for all study and comparison sites.
!"#$$%$&'#$(')*#+,-'.$&%$..*%$&/''0)'1#2'3.'45*)6'
Site visits
CREC researchers visited all study and comparison sites and collected data on several factors that affect the quality of the pedestrian environment. Table 3.2 summarizes the characteristics on which researchers
including these factors in any study of the pedestrian environment in order to build on previous research and existing best practices. However, it’s worth noting that such analyses focus almost entirely on safety, and little on accessibility to destinations, comfort,
collected data.
or aesthetic qualities. It should also be noted that
Though only a small portion of these factors directly
any sites and simply made qualitative assessments of
describe the pedestrian environment, they all affect
pedestrian, bicycle, and vehicle volumes. Appendix B
the pedestrian experience. The scale and layout of
contains the observational data collected by CREC for
a development affects how far pedestrians are able
all study and comparison sites.
7897'(%('$5)'-5$(:-)';)#$(#*(%