Indian Journal of Radio & Space Physics Vol. 39, June 2010, pp. 121-131
Evaluating the performance of some predictive models for estimating global solar radiation across varying climatic conditions in Nigeria E O Ogolo Department of Physics, The Federal University of Technology, Akure, Nigeria E-mail:
[email protected] Received 5 October 2009; revised received and accepted 15 February 2010 The performance of both temperature and sunshine dependent models were evaluated for different selected tropical sites, which are situated across four different climatic zones, viz. Sahelian, Guinea Savannah, Midland and Coastal area in Nigeria. The regression constants were obtained for the first, second and third order Angstrom type [Garcia J V, Principios F’isicos de la Climatolog’ia. Ediciones UNALM (Universidad Nacional Agraria La Molina: Lima, Peru), 1994; Hargreaves G & Samani Z, Estimating potential evapotranspiration, J Irrigat Drainage Eng (USA), 108 (1982) pp 225-230] models for all the stations using the method of regression analysis. Model evaluation performance analyses were carried out to determine which model is more suitable for a given climatic condition. The results indicated that the third order Angstrom type correlations do not improve the accuracy of estimation of global radiation. In addition, the results also revealed that temperature and sunshine hour dependent models are more suitable for the simulation of global radiation in the Sahelian and Guinea Savannah climatic condition, respectively. All the models exhibited the tendency to perform suitably well in the Midland and Coastal areas. On the seasonal consideration, the sunshine hour dependent models were found more suitable for the estimation of solar global radiation across all the varying climatic conditions during the dry season. However, all the models were found suitable during the wet season except for the Sahelian where only the temperature dependent models have been found exclusively suitable. Keywords: Performance indicators, Solar radiation, Regression analysis, Sunshine hour dependent model, Temperature dependent model, Angstrom type model PACS Nos.: 92.60.Vb; 94.20.wq
1 Introduction Solar radiation is the ultimate control of weather and climate because it is the only source of the earth’s energy. The sun through the emission of solar radiation provides about 99.97 percent of the heat energy required for physical processes. The availability of solar radiation data and the relevant meteorological variables are crucial to solar engineers and architects in order to predict accurately the available solar energy resource. Solar radiation data is necessary for determining cooling load for buildings, prediction of local air temperature and for estimating power that can be generated from photovoltaic cells. Solar radiation data is always important for the design of any solar energy conversion device energy3. Several methods have been developed around the world to estimate incoming solar radiation using irradiative transfer models and satellites4-8. Most of the models were developed over a complex topography around mountainous areas where there was no radiation data for validation and calibration.
Hence, there was the need for more complex algorithms to explain the irradiative flux. In view of these shortcomings, it became necessary to generate and calibrate empirical relationships that estimate incoming solar radiation as a function of other known meteorological variables such as relative sunshine hours, cloudiness and temperature. Such empirical models based on the measured weather parameters were developed1,2,9-14. In the present study, both linear and polynomial regression techniques were used to develop some predictive models classified as sunshine hours and temperature dependent for the estimation of global solar radiation for four tropical stations covering four different climatic zones in Nigeria. This study is encouraged by the widespread application of solar radiation as an alternative source of power generation in Nigeria. Nigeria is divided into four climatic zones15 according to the moisture distribution including topography which consequently affect the solar energy receipts at different solar stations. The
122
INDIAN J RADIO & SPACE PHYS, JUNE 2010
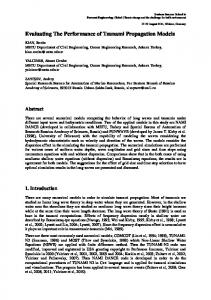
performance of the models for each climatic zone was tested as to determine which of them would be suitable for particular climatic condition. 2 Study region Nigeria is situated between latitudes 4o and 14o North of the equator and between longitudes 3o and 15o East of the Meridian15. Nigeria’s climate is characterized by strong latitudinal zones, becoming progressively drier as one moves north from the coast. Rainfall is the key climatic variable and there is a marked alternation of wet and dry seasons in most areas. The country can be classified into four climatic zones14, namely the Coastal zone, the Guinea Savannah zone, the Midland zone and the Sahelian zone (Fig. 1). The Coastal zone is dominated by tropical maritime (mT) air for most years. This is found along the coast up to 100 - 150 km inland. The annual temperature here ranges between 27oC and 30oC. Relative humidity in the region is as high as 80% and characterized with over 300 cm of annual rainfall having double peaks of rainfall. There is also long wet season typically 7-10 months15. Port Harcourt is located within the Coastal zone. The Guinea Savannah zone, where Lokoja has been selected, experiences the dominance of mT air for about seven months and tropical continental (cT) air for the remaining five months annually. The stations within this zone are found further inland after the Coastal zone. The zone experiences longer temperature ranges; lower annual rainfall; shorter wet season of about 6–8 months than the Coastal region;
and well marked dry season of 4-6 months16. The region has a widespread vegetation belt and an annual rainfall of 100-200 cm having an annual relative humidity of 60%. The Midland zone Jos is dominated by tropical continental air mass and has predominantly highlands. The topography effectively is usually responsible for usual long period of the humid condition due to localized convection. Kano is situated in the Sahelian Zone, a region where cT air mass predominates and the mT air mass invades for 2-3 months at most because of its distance from the coastal environment. This zone embraces all stations in the north-eastern extremity of Nigeria. This type of climatic environment has a highly accentuated continentally with a wide annual and diurnal range of 15 - 20oC. Dry season is excessively long up to 8 - 10 months and desert-like conditions prevail15. 3 Methodology 3.1 Model description
In this study, two major models whose basic requirement utilizes temperatures and sunshine duration have been used. The basic characteristic of the models is the correlation of global solar radiation with atmospheric variables of the environments where the study is being carried out. A foremost correlation model, popularly and widely used for estimating the monthly average daily global solar radiation on a horizontal surface, Rs (MJ/m2 day) was originally developed by Angstrom9 while Prescott17 put the correlation, in a convenient way, defined and described as: Rs / Ro = a + b(n/N)
Fig. 1 — Map of Nigeria showing data collection stations and geographical region
… (1)
where, Ro, is the monthly average daily extraterrestrial radiation (MJ/m2 day); n, the monthly average daily bright sunshine hours; N, maximum possible monthly average daily sunshine hour otherwise called the day length; and a and b, regression constants. The physical significance of the regression constants is that ‘a’ represent the case of overall atmospheric transmission for an overcast sky condition (i.e. n/N=0); while ‘b’ is the rate of increase of Rs / Ro with n / N . The sum of a and b (a+b) significantly represents the overall transmission under clear sky condition or clear sky index. The extra-terrestrial solar radiation otherwise known as Angot radiation receipt on a horizontal
OGOLO: PERFORMANCE OF PREDICTIVE MODELS FOR GLOBAL SOLAR RADIATION ESTIMATION
surface in MJ/m2 day was obtained using the expression: Ro =
πω Isc(Eo) cosϕ cosδ sinω + sin ϕ sin δ 180 π
24
… (2) where, Eo, is the factor chosen for the correction of the Earth’s orbit; φ, the latitude of the location; ω, the sunrise/sunset hour both, respectively given by: 2πdn Eo = 1 + 0.33 cos 265
… (3)
ω = arc cos(− tan φ tan δ)
… (4)
123
Hargreaves & Samani2 proposed an empirical equation expressed in the form of a linear regression between the clearness index and the square root of ∆T given as: Rs = a + b∆T 0.5 Ro
… (10)
where, ∆T, is the difference between maximum and minimum temperature values; and a, and b, regression constants. Garcia1 is an adaptation of Angstrom-Prescott with a slight modification: Rs ∆T = a+b Ro N
(11)
3.2 Acquisition and treatment of observational data
The declination angle of the sun δ is given according to Spencer (1975) in degree as: δ = (0.006918-0.399912cosГ + 0.070257sinГ – 0.006758cos2Г + 0.0000907sin2Г 180 – 0.002697cos3Г + 0.00148sin3Г)
π
… (5)
where, Г, is the day angle radiance which is expressed as: Γ=
2π (dn − 1) 365
… (6)
The maximum possible sunshine durations, N, otherwise called the day length is obtained using: N=
2 180 ω 1S π
Data for all the parameters used in the study were extracted from the monthly meteorological observation at the Nigerian Meteorological Agency (NIMET), Oshodi, Lagos, Nigeria. The parameters include sunshine hours, global solar radiation, minimum and maximum temperature. The data were collected for four tropical stations which spread across the four main geographical zones in Nigeria. These include Port Harcourt - a coastal station; Lokoja - a Guinea savannah station; Jos – a Midland station; and Kano - a Sahelian station (Table 1). Table 2 represents the years of the dataset used for both modeling and validation of the predictive models for each of the station. It is obvious from the table that there is a dearth of data on sunshine hours in most stations in Nigeria except for two stations. The
… (7)
In addition to the above model (Eq. 1) otherwise known as the first order Angstrom, the following second and third order Angstrom type correlations, proposed by researchers10,18-20, had also been used: Rs/Ro = a + b(n/N) + c(n/N)2 2
Rs/Ro = a + b(n/N) + c(n/N) + d(n/N)
Table 1 — Geographical locations and duration of data on parameters Name of Stations
Location
Duration of observation of data
Kano
12.07oN, 8.43oE
1995-2000 for sunshine Sahelian hours 1970-1989 for maximum and minimum temperature
Jos
9.12oN, 5.95oE
1994-2002 for sunshine Midland hour 1981-2000 for maximum and minimum temperature
Lokoja
7.23oN, 5.17oE
1983-1995
Grassland Savannah
Port Harcourt
4.55oN, 7.00oE
1976-1992
Coastal
… (8) 3
… (9)
where a, b, c, and d are the regression constants which are functions of the location of investigation. Other models, besides the Angstrom-Prescott models, that were used in this study were based on temperature data. This is relevant in a location where sunshine hour data is not available. In particular, other models1,2 have been successfully used to simulate global solar radiation.
Type of climatic zone
INDIAN J RADIO & SPACE PHYS, JUNE 2010
124
number of year used for modeling varies from a few years less than a half of a decade for sunshine hour to a decade and a half for temperature. While the number of years used for the validation of the predicted models varies from two to five years. The observation of total global radiation in all the tropical stations was carried out by pyranometer with linearity ±5% from 0 to 2800 W m-2 having accuracy better than 0.5% and a resolution of 1 watt m-2. The daily sunshine hours (n) was measured by Campbell stokes sunshine. The maximum and minimum thermometer was used to determine the lowest and the highest temperature of air for each day. These are positioned at a height of 1.5 m above the ground in a white louvered shelter called Stevenson screen at each station.
All the data used in this study were subjected to a quality control and relevant statistical test before applying them to the models. This is done by plotting time variation graph to determine the spurious values and all omissions in the data were appropriately determined. The processed data were substituted appropriately into Eqs (8-11).
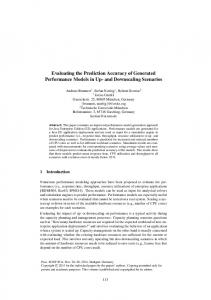
As shown in Table 2, more than a decade data was used in modeling global solar radiation for all the locations except Kano and Jos where there is a dearth of sunshine hour data. Hence, for Kano and Jos, limited data on daily sunshine hours was measured for half a decade (1995-2000) while a decade and two decades data on both maximum and minimum temperature were used respectively to build the temperature biased model. The daily extraterrestrial radiation, Ro, and the maximum possible sunshine, N, durations needed for modeling were determined for each of the stations according to Duffie & Beckman21 and Igbal22 using the standard procedure [Eqs (2) and (7)]. The daily obtained values of Ro and N were further averaged into monthly values R and N , respectively (Fig. 2). Table 2 — Years of Dataset used for both modeling and Validation of the Predictive Models for each of the station Stations
Years of dataset used for modeling
Years of dataset used for model validation
Kano
1995-1997 (Sunshine data) 1970-1984 (Temperature data)
1998-1999 (Sunshine data) 1985-1989 (Temperature data)
Jos
1994-2000 (Sunshine data)
2001-2002 (Sunshine data) 1996-2000 (Temperature data)
1981-1995 (Temperature data) Lokoja
1976-1990
1991-1995 (Temperature and sunshine data)
PortHarcourt 1976-1985
1986-1992 (Temperature and sunshine data)
Fig. 2 — Distribution of mean monthly values of (a) Solar radiation (Watt m-2 per day); (b) Temperature (0C); (c) Sunshine hours (h) for all the tropical stations
OGOLO: PERFORMANCE OF PREDICTIVE MODELS FOR GLOBAL SOLAR RADIATION ESTIMATION
3.3 Validation of results
However, for a long term performance of the examined regression equations. MPE is preferred. Just like MBE, a positive value of MPE provides the average amount of over-estimation in the estimated values, while the negative value indicates underestimation. Other statistical indicators used in the analysis include standard error of estimate (SEE), index of agreement (ID) and average model error (AR).
The developed multiple regression equations are used to calculate global radiation for all the locations spread across the four climatic zones. The calculated values of global radiation are then compared with the measured data for the locations. The performance of each of the models was tested statistically by calculating the mean bias error (MBE), root mean square (RMSE) and the mean percentage (MPE) errors and other statistical concepts. These indicators are defined as: Σ(i.Rest − i.Robs) MBE = … (12) n Σ(i.Rest − i.Robs) 2 RMSE = n
4 Results and discussion Using the technique of least square regression, linear and polynomial regression equations were developed based on Eqs [(1), (8-11)]. Regression coefficients were determined for all the stations in all the four climatic zones in Nigeria. The regression coefficients for all the models and the corresponding values of the performance indicators are shown in Table 3. The table shows all the models generated for all the stations including the first and the second order of the Angstrom-Prescott type correlations. It may be observed that there was no third order of the Angstrom model for all the stations except Kano. For most stations and seasons, the results of the regression for the third order exhibits co-linearity with the second order indicating that the third order does not significantly improve the accuracy of the
1/ 2
… (13)
Σ(i.Rest − i.Robs) MPE = × 100 / n i Robs
125
… (14)
where, i.Rest, and i.Robs, are the respective ith estimated and the observed mean values of global solar radiation; and n, the total number of observations. In general, a low RSME and MBE are desirable while positive MBE shows over-estimation while a negative MBE indicates under-estimation.
Table 3 — Regression coefficients of model equations for the selected locations and corresponding values of performance indicators Location
Models a
Kano
Lokoja
Jos
PH
Regression coefficients b c d
MBE
RSME
SEE
AR
MPE (%)
ID
CR
-
-0.02
2.43
16.13
1.00
-0.40
1.00
0.58
1st order Angstrom
0.441
0.292
-
2nd order Angstrom
1.111
-1.828
1.66
-
0.24
2.20
15.68
1.00
0.70
1.00
0.69
3rd order Angstrom
0.838
-0.653
-
0.76
0.02
14.80
39.29
1.01
-2.50
0.99
0.16
HS
0.175
0.126
-0.08
1.72
9.44
1.00
-0.29
1.00
0.76
G
0.417
0.194
-0.09
1.77
8.83
1.00
-0.33
1.00
0.76
1st order Angstrom
0.248
0.509
-
-
-0.07
1.28
9.77
0.99
-0.37
1.00
0.78
0.32
-
2nd order Angstrom
0.168
0.835
-0.09
1.25
9.48
0.99
-0.43
1.00
0.79
HS
0.211
0.0917
-0.57
3.10
9.61
0.97
-3.10
1.00
0.39
G
0.381
0.142
-0.55
3.24
8.71
0.97
-3.00
1.00
0.32
-1.53
3.72
7.91
0.94
-6.95
1.00
0.93
-1.45
3.75
8.57
0.94
-6.55
1.00
0.92
1st order Angstrom
0.278
0.485
-
2nd order Angstrom
0.154
0.933
0.37
-
HS
0.129
0.166
4.51
22.38
12.38
1.14
17.58
0.98
0.87
G
0.359
0.333
4.43
20.89
12.29
1.13
17.19
0.98
0.93
1st order Angstrom
0.222
0.58
-
-
-0.65
1.56
11.24
0.96
-4.96
1.00
0.84
1.07
-
2nd order Angstrom
0.153
1.149
-1.05
2.28
46.1
0.93
-8.09
1.00
0.83
HS
0.191
0.282
0.32
1.12
43.2
1.03
2.42
1.00
0.90
G
0.183
0.293
-0.23
0.79
42.45
0.99
-1.36
0.99
0.89
126
INDIAN J RADIO & SPACE PHYS, JUNE 2010
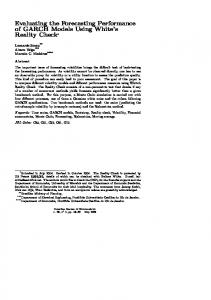
estimation of global radiation for almost all the stations. Figure 3 shows the comparison between the monthly mean of the estimated and the observed global radiation for all the models developed for the tropical stations. It can be seen from the figures that the predictive values by the entire models exhibit a good variation trend along with the observed global radiation for all the stations except for Lokoja where
all the temperature dependent models appear to behave differently between August and October. During this period, it was observed that while other models defined a trough in August; G and HS respectively delayed till October. Another case of irregular variation observed is found with the third order of Angstrom for Kano where the model exhibits a mirror-like variation with the measured values. For each of these cases, the correlation coefficients
Fig. 3 — Comparison between the observed and predicted monthly average global solar radiation, for: (a,b) Kano - Sahelian; (c) Lokoja – Midland; (d,e) Jos - Guinea Savannah; and (f) Port Harcourt - Coastal region (Rb-Observed /measured values of Global Solar Radiation; 1st Order-, 2nd Order-, and 3rd Order –Angstrom type correlation; HS - Hargreaves and Samani and the G - Garci).
OGOLO: PERFORMANCE OF PREDICTIVE MODELS FOR GLOBAL SOLAR RADIATION ESTIMATION
(Table 3) indicate a poor agreement between the simulated and the observed values. The performance of each of the above developed models was tested statistically by validating the simulated radiation values as compared with the observed values. Table 3 presents a summary of the results of the statistical indicators used for determining the performance level of each of the models for the different stations under consideration. From Tables 3-5, it can be seen that neither ‘a’ nor ‘b’ vary with latitude or altitude in any systematic mode. However, the values of the sum of the regression constants (a + b) (for the first order Angstrom correlation types) averaged over the period of recording vary according to the location of each of the station. The constant ‘a’ and ‘b’ had been determined for different climatic conditions in Nigeria (Table 3). The sum (a+b) exhibits an increasing trend from the arid environment with high latitude to the coastal stations with low latitude. The values of the sum (a +b) obtained are 0.733, 0.757, 0.787 and 0.802 for Kano, Lokoja, Akure and Port Harcourt, respectively (Table 3). Though ‘a’ and ‘b’ are empirical constants and as earlier pointed out, their values depend on latitude, relative sunshine hours, elevation above sea level, relative humidity, maximum air temperature and so on. The physical significance of the sum of the two constants (a+b), is a measure of the overall atmospheric transmission for totally cloudy condition and is a function of the type of thickness of the cloud. The results confirm more cloud cover for the stations close to the ocean (coastal stations) than for stations in the Sahelian region. Four different models were developed for four tropical stations situated in different climatic conditions in Nigeria. For each of the model, some performance indicators (namely MBE, RSME, Standard Error of Estimate (SEE), MPE%, index of agreement (ID) were determined for the locations under consideration. For better performance, lowest MBE RSME, SEE, MPE% values are desired. For Kano, the first and the third order of the Angstrom have the lowest MBE of 0.02 each, this is followed by 0.08 and 0.09 for Hargreaves & Samani2 (HS) and Garci1 (G) models but the RSME for the temperature dependent models (1.72 and 1.77, respectively) are lower as compared to the first and the second order Angstrom (2.43 and 2.20, respectively). Larger values of SEE is undesirable, however, in this study, the lowest values of SEE (8.83 and 9.44, respectively)
127
were found for HS and G models (temperature dependent models), while the SEE for the first and second order of Angstrom were 16.13 and 15.68, respectively. The index of agreement between the simulated radiation values when compared with the observed is found to be unity which indicates good agreement between them. The lowest mean percentage error (MPE%) of 0.058 and 0.028 were found for HS and G models, respectively followed by -0.031 for the first order of the Angstrom correlation type. Both HS and G models have the highest correlation coefficient of 0.76 each followed by 0.75 for the second order of Angstrom. From the foregoing, the temperature dependent model is strongly recommended for simulating global solar radiation for the stations in the Sahelian zone in Nigeria. Among all the models tested, both HS and G models scored lowest MBE, RSME and SEE and MPE (%) and both have the highest correlation coefficient as shown on Table 3 and confirmed in Fig. 2. Both the first and the second order of the Angstrom correlation type may be considered as a second class model for this environment in questions in view of the overall results of the performance indicator shown in the present analysis. Lokoja is situated in the mainland climatic zone in Nigeria. There were four models developed for this station namely the first and the second order of Angstrom, Hargreaves & Samani (HS) and the Garci (G) models. The regression coefficients for the regression equations were developed for this environment (Table 3). The MBE values for the models, respectively are -0.07, -0.09,-0.57 and -0.57 while their RSME values are 1.28, 1.25, 3.10 and 3.24, respectively. The highest correlation coefficient between the simulated and the observed include 0.780 and 0.790 was found for the first and second order of Angstrom, respectively followed by 0.390 and 0.320 for HS and G model, respectively. This shows that there is a stronger fitting between the predicted and the observed values. From the foregoing, it is crystal clear that the best performing and suitable model in this climatic condition is the first and the second order of Angstrom correlation type which was found to have the lowest values of MBE, RSME, SEE and high correlation coefficient (Table 3). In addition, the Angstrom models have the lowest MPE% values (Table 3) as compared to temperature dependent models which have the tendency of overestimating the solar radiation for the Midland zones. Here, the
128
INDIAN J RADIO & SPACE PHYS, JUNE 2010
results of the statistical indicators show that .the sunshine hour dependent models are more suitable than the temperature dependent models for simulations of global solar radiation for this climatic environment. The performances of the four prediction models developed for Jos (a tropical station located in the grassland/forest zone) were found to be quite satisfactory. The correlation coefficients as shown in Table 3 lie in the range 0.870 - 0.930. The MPE% for the sunshine hour dependent is negative (-6.95 and -6.55%) and positive (17.58 and 17.19) for the temperature dependent models. The observation shows that Angstrom model has the tendency for underestimation while the temperature dependent models have the propensity for overestimation of global solar radiation for this region. This is further confirmed by the average ratio (AR) computed for the models (less than unity indicates underestimation and greater than unity implies overestimation) and the variation trend curves [Table 3 and Figs 2 (d-e)]. The SEE and RSME values for the sunshine hour models are lower as compared to temperature dependent model (Table 3). The results of the performance indicators show that the Angstrom models perform suitably well in this region than temperature dependent models. However, proper calibration of all the models may improve their performance level for this region. The level of performance of the prediction model for Port Harcourt, a coastal station is not different from the grassland/forest zone which has just been discussed above. The correlation coefficient is generally high for all the models, having the highest value of 0.900 for G model to 0.830 for the second order of Angstrom correlation type. Also from Table 3, it was observed that the MPE% and AR values indicate that all the models except G model underestimate the global solar radiation for the coastal stations. The absolute values of MBE and RSME are lower for the temperature dependent models when compared with the Angstrom model. The general performance of all the models for the coastal stations is good but the temperature dependent models are more suitable in view of the results of the performance indicators for all the models. 4.1 Seasonal model performance
Nigeria has the climatic characteristic of the evident dry and wet seasons that correspond to the months of November to March and April to October,
respectively. The alternation of wet and dry season is in association with north-south movement of intertropical convergent zone (ICTZ) following the position of the Sun relative to the earth. In view of this seasonal effect and considering the fact that the amount of solar radiation receipt at the earth surface for different prevailing weather conditions during each of the seasons vary, a different set of predictive models were developed. Tables 4 and 5 contain the results of the validation tests carried out on all the various predictive models developed respectively for the two different seasons using the performance. The seasonal performances of the models as given by their performance indicators for Kano are shown in Tables 4 and 5. During the dry season, the first and the second order Angstrom Prescott (the sunshine dependent models) have the lowest MBE, RSME and SEE for Kano (Table 4). These two models have the highest coefficient correlation of 0.85 and 8.40, respectively which are significantly higher than HS and G models which have 0.56 and 0.210, respectively. Furthermore, it was observed from the results that the sunshine dependent model has the lowest MPE values compared with the temperature dependent. However, during the wet season, the values for MBE, RSME and SEE are low for the temperature dependent predictive models when compared with the Angstrom Prescott predictive models. The correlation coefficients of Hargreaves & Sammani and Garci are 0.990 and 0.980, respectively, unlike the first and the second Angstrom Prescott predictive model which have an extremely low correlation of 0.040 and 0.08 (Table 4). From the above, this study shows that the sunshine hour dependent predictive model is recommended as being suitable for the simulation of solar radiation during the dry season while the temperature dependent predictive models are better than the sunshine model for wet season in this climatic condition. The performance of the models for the Midland condition (Lokoja) is also investigated for both dry and wet seasons and the results are also shown in Tables 4 and 5. For dry season, it is observed that the first order of Angstrom has the highest correlation coefficients and the lowest RSME and SEE values while the MPE and AR values indicate a perfect agreement between the observed and the predicted solar radiation values (Table 4). The correlation coefficient of the temperature dependent models is in
OGOLO: PERFORMANCE OF PREDICTIVE MODELS FOR GLOBAL SOLAR RADIATION ESTIMATION
129
Table 4 — Regression coefficients of model equations for the selected locations and the corresponding values of the statistical indicators during the dry season Dry Season Locations Models
Kano
Lokoja
Jos
PH
Regression coefficients a b c
1st order Angstrom
0.611
0.090
2nd order Angstrom
0.334
0.984
HS
1.195
-0.130
0.708
MBE
RSME
SEE
AR
MPE (%)
ID
CR
-0.04
0.75
1.79
1.00
-0.08
1.00
0.850
-0.10
0.91
1.61
1.01
-0.39
1.00
0.840
1.39
2.73
2.77
1.00
5.77
1.00
0.560
G
1.670
-0.734
3.12
13.59
7.23
1.00
11.71
1.00
0.210
1st order Angstrom
0.398
0.263
-0.22
0.69
0.96
0.99
-1.01
1.00
0.930
2nd order Angstrom
1.901
-5.008
0.07
1.82
5.29
1.01
0.19
1.00
0.490
HS
0.935
-0.104
-0.34
1.29
4.14
0.99
-1.81
1.00
0.650
4.567
G
0.710
-0.135
-0.31
1.24
4.1
0.99
-1.65
1.00
0.660
1st order Angstrom
0.392
0.368
-1.75
3.40
2.65
0.93
-7.25
0.99
0.615
2nd order Angstrom
1.140
-1.561
-1.77
3.37
1.29
0.93
-7.34
0.99
0.739
1.232
HS
0.436
0.081
1.30
1.940
1.24
1.00
5.03
0.99
0.297
G
0.595
0.120
1.32
1.990
1.25
1.00
5.09
0.99
0.292
1st order Angstrom
0.462
-0.088
-0.13
1.34
0.33
0.96
-7.48
1.00
0.998
3rd order Angstrom
0.806
-1.691
-1.03
1.1
0.26
0.95
-6.79
1.00
0.987
4.985
HS
0.414
0.006
-0.23
0.323
1.92
1.05
-1.71
1.00
0.323
G
0.443
0.013
-0.42
0.61
2.55
0.99
-2.82
1.00
0.415
Table 5 — Regression coefficients of model equations for the selected locations and the corresponding values of the statistical indicators during the wet season Wet Season Locations
Kano
Lokoja
Jos
PH
Models
Regression coefficients a b c
MBE
RSME
SEE
AR
MPE (%)
ID
CR
1st order Angstrom
0.394
0.329
-0.12
3.33
0.35
1.00
-0.98
1.00
0.040
2nd order Angstrom
1.719
6.944
0.40
2.18
0.18
1.02
1.50
1.00
0.080
5.136
HS
0.028
0.17
0.04
0.13
1.14
1.00
0.10
1.00
0.990
G
0.326
0.292
0.07
0.12
1.39
1.00
0.21
1.00
0.980
1st order Angstrom
0.235
0.524
-0.17
0.08
1.12
0.99
-0.94
1.00
0.990
2nd order Angstrom
0.220
0.588
-0.20
0.09
1.14
0.99
-1.11
1.00
0.990
0.070
HS
-065
0.321
-1.33
3.47
7.56
0.93
-8.03
1.00
0.760
G
0.034
0.627
-1.33
3.40
7.53
0.93
-7.94
1.00
0.740
1st order Angstrom
0.351
0.295
-1.65
3.78
6.72
0.96
-8.57
1.00
0.750
2nd order Angstrom
0.600
0.671
1.65
4.00
31.96
0.95
8.57
0.98
0.690
HS
0.127
0.136
0.909
1.66
3.85
17.74
1.00
7.82
1.00
0.740
G
0.345
0.257
1.67
3.63
33.57
1.00
7.94
0.96
0.800
1st order Angstrom
0.260
0.487
-0.62
2.00
7.15
0.96
-510
1.00
0.840
2nd order Angstrom
0.236
0.695
-0.75
2.16
7.30
0.95
-6.34
1.00
0.850
HS
0.358
0.28
0.43
2.11
1.59
1.05
3.45
1.00
0.960
G
0.031
0.599
-0.40
1.74
1.45
0.99
-2.36
1.00
0.970
0.408
130
INDIAN J RADIO & SPACE PHYS, JUNE 2010
the range 0.65 - 0.66 and RSME and SEE values are higher (Table 4) as compared to the first order of Angstroms. The correlation coefficient of the second order of Angstroms is 0.49 and higher RSME and SEE values when compared with the rest of predictive models. From this, it is evident that the first order Angstrom model is more suitable than the temperature dependent model for the simulation of solar radiation for the Midland during the dry season. Table 4 shows the results of the performance indicators for all the predictive models during the wet season for the Midland region. The correlation coefficients lie in the range 0.76 - 0.99 with the first and the second order of Angstrom Prescott having a highest of 0.99, respectively. In addition, the MBE, RSME and the SEE values for the sunshine dependent predictive models are extremely low compared with the temperature dependent models besides all the model exhibit the tendency for underestimations as indicated by the negative values of MBE, MPE and the values of AR which are less than unity for all. In general, results of the performance indicator for all the models for both the dry and wet season shows that Angstrom models are better than the temperature dependent models for the simulation of solar radiation for the midland environments. The performance level of all the predictive models for Jos (situated in the forest/Savannah) both for dry and wet seasons are shown in Tables 4 and 5. For dry season, the correlation coefficient ranges from 0.29 to 0.74 with the temperature dependent models having the least values ranging from 0.29 to 0.30. However, RSME, SEE and MPE values are much higher for the sunshine hour dependent models than the temperature dependent models. Further analysis confirms that the Angstrom model underestimates solar radiation by ±7.0% while the temperature model overestimates by 5.0%. The inconsistency observed in this result is not unconnected with the irregularities involved in the collection of the observed data which is associated with the handling of the instruments or process of transfer of data. For instance, the data simulated by the temperature dependent model shows an increasing trend between November and December while the observed values exhibit a decreasing trend during this period. The variance in the behaviour of the model in relation to the reference data is responsible for the poor correlation coefficient. For the present situation the first and the second order of Angstrom models are
considered to be more suitable if both are properly calibrated for the simulation of global solar radiation for this climatic environment. However, the behaviour of the models for the wet season is quite satisfactory. The correlation coefficients for all the models range between 0.69 and 0.800. It is also observed from Table 5 that all the models exhibit the tendency for overestimation except the first order of Angstrom which has negative MPE value (-8.57%) while the rest models have MPE ranging from 7.82% (for HS) to 8.57% (for the second order of Angstrom type of correlation). Both the temperature dependent models and the sunshine hour dependent model is suitable for the prediction of global solar radiation for the Midland, if they are well calibrated with processed observed data with high integrity. Port Harcourt is an industrial city in the Niger Delta situated very close to the Atlantic Ocean in Nigeria. The performances of the four models were examined seasonally for Port Harcourt. The first order of Angstrom Prescott has the highest correlation coefficient of 0.81 followed by G predictive model with 0.690 but the second order of Angstrom Prescott (1924) has the least value of 0.290 while HS has correlation coefficient of 0.480. However, the MPE values (Table 4) for the first order Angstrom, HS including G predictive model exhibits the tendency for underestimation with the present data while the second order of Angstrom has a very high tendency for overestimation because it has the highest MPE value of 10.64% (Table 4). Hence, from the results of the performance indicators for the dry season, this study has found three models suitable for the simulation of solar radiation, they are: first order of Angstrom-Prescott, HS and G models in view of their low MBE and RSME values and high coefficient correlations. For the wet season, all the models were found suitable. The correlation coefficients for all the models range between 0.84 and 0.97 but higher for the temperature dependent models (Table 5) which are also found to have the lowest SEE, MBE values as compared to the Angstrom models. However, all other predictive models manifest a strong tendency for overestimation of solar radiation during the wet season for the coastal condition as indicated by their high values of MPE but this appear more stronger for the sunshine hour dependent the temperature dependent models.
OGOLO: PERFORMANCE OF PREDICTIVE MODELS FOR GLOBAL SOLAR RADIATION ESTIMATION
Conclusions Model calculations were carried out using a few models (sunshine hour and temperature dependent) for the estimation of monthly mean global solar radiation for the various geographical stations in Nigeria ranging from the coastal region to the Sahelian environment. The results of the study show clearly the importance of developing empirical approaches for formulating the global solar radiation field reaching the earth at different stations and seasons in the varying climatic regions in Nigeria. Different predictive models categorized as temperature and sunshine hour dependent were developed in this study based on some empirical equations [Eqs (1), (8-11)] for four stations (Kano, Lokoja, Jos and Port Harcourt) characterized by diverse climatic conditions. The regression coefficients were determined for each of the stations according to the empirical equations defined for each station. It was observed that the sum of the coefficients ‘a’ and ‘b’ increases from the Sahelian region towards the coastal station. This may be because the coefficients are quite related to geographical and meteorological condition of any given place. The dearth of data on sunshine hours in most of the meteorological stations in Nigeria had in so small dimension and has limited the scope of this study. This is only available for few stations across Nigeria. Generally, it was observed that for most of the stations except for Kano, the third order of Angstrom type model exhibits co-linearity with the second order. The implication of this observation is that the third order of Angstrom type does not have any significant improvement on the accuracy of estimation of global radiation in most of the stations, hence, the first and the second order correlations between the monthly mean daily clearness index and the relative possible sunshine duration for the selected stations were proposed even for both dry and wet seasons. Further work is being carried out in this area with a view to enlarge the scope by increasing the number of the atmospheric variables. Acknowledgements The author wishes to thank the Nigerian Meteorological Agency, Oshodi, Lagos, Nigeria for releasing all the data used for the study. References 1 Garcia J V, Principios F’isicos de la Climatolog’ia. Ediciones UNALM (Universidad Nacional Agraria La Molina: Lima, Peru), 1994.
131
2 Hargreaves G & Samani Z, Estimating potential evapotranspiration, J Irrigat Drainage Eng (USA), 108 (1982) pp 225-230. 3 Gopinathau K K, Solar sky radiation estimation techniques, Sol Energy (USA), 49 (1) (1992) pp 9-11. 4 Atwater M A & Ball J T, A numerical solar radiation model based on standard meteorological observations, Sol Energy (USA), 21 (1978), pp 163-170. 5 Weymouth G & Marshall J L, An Operational System to Estimate over the Australian Region, Proceedings of Pacific Ocean Remote Sensing Conference Australia (Bureau of Meteorology Research Centre, Australia), 1994, pp 443-419. 6 Ceballos J C & Moura G B A, Solar Radiation Assessment using Metesat4-vis imagery, Sol Energy (USA), 60 (1997) pp 209-219. 7 Dissing D & Wenller G, Solar radiation climatology of Alaska, J Theor Appl Climatol (USA), 61 (1998) pp 161-175. 8 Gultepe I, Isaac G A & Strawbrigde K B, Solar radiation and daylight models for the energy efficient design of building, Sol Energy (USA), 33 (2001) 619. 9 Angstrom A, Solar and terrestrial radiation, Q J R Meteorol Soc (UK), 50 (1924) pp 121-125. 10 Fagbenle R O, Estimation of total solar radiation in Nigeria using meteorological data, Nigerian J Renew Energy, 14 (1990) pp 1-10. 11 Udo S O, Contribution to the relationship between solar radiation and sunshine duration in the tropics: A case study of experimental data at Ilorin, Nigeria, Turkish J Phys, 26 (2002) pp 229-236. 12 Akpabio, Modeling global radiation for tropical stations: Onne, Nigeria, Turkish J Phys, 29 (2004) pp 63-68. 13 Mahmood R & Hubbard G, Effect of time of temperature observation and estimation of daily solar radiation for the Northern Great Plains, USA, Agronomy J (USA), 94 (2002) pp 723-733. 14 Khalil S A & Fathy A M, An empirical method for estimating global radiation over Egypt, Acta Polytech J (Egypt), 48 (5) (2008) pp 48-53. 15 Olaniran O J, The monsoon factor and the seasonality of rainfall distribution in Nigeria, Malaysian J Trop Geog, 7 (1983) pp 38-45. 16 Iloeje N P, A new Geography of Nigeria, Fifth Edition, (Longman Nigeria Plc, Lagos, Nigeria), 1965, pp 234-240. 17 Prescott J A, Evaporation from a water surface in relation to solar radiation, Trans R Soc South Aust (Australia), 64 (1940) pp 114-125. 18 Singh O P, Srivastava S K & Gaur A, Empirical relationship to estimate global radiation from hours of sunshine journal, Energy Convers Manage (UK), 37 (4) (1996) pp 501-504. 19 Mosalam Shaltout M A, Atmospheric transmission and diffuse fraction of solar energy over Egypt, International Symposium on Applications of Solar and Renewable Energy: Proceedings (Cairo, Egypt), 1986, pp 35-44. 20 Ulgen K, Hepbasli A, Comparison of solar radiation correlations for Izmir, Turkey, Int J Energy Res (UK), 26 (5) (2002) pp 413-430. 21 Duffie J A & Beckman W A, Solar engineering of thermal processes (John Wiley, New York), 1980. 22 Igbal M, An Introduction to Solar Radiation (Academic Press, New York), 1983, pp 59-67.