Evaluating the Reliability and Validity of the Questionnaire for Situational Information: Test-Retest Reliability
Final Report
Submitted By: Susan M. Havercamp, PhD Florida Center for Inclusive Communities, UCEDD University of South Florida 13301 Bruce B. Downs Blvd. MHC 2113A Tampa, FL 33612-3807 (813) 974-7076
[email protected]
With help from: Steven J. Mason Public Health doctoral student University of South Florida Prepared in collaboration with: Agency for Persons with Disabilities 4030 Esplanade Way, Suite 380 S Tallahassee, Florida 32399 (850) 488-1552
January 26, 2009
Introduction The Agency for Persons with Disabilities (APD) is the Florida program tasked with serving the needs of Floridians with developmental disabilities. Prior to 2004, APD existed as the Developmental Disabilities Program within the Department of Children and Families. APD works in partnership with local communities and private providers to assist people who have developmental disabilities and their families. APD also provides assistance in identifying the needs of people with developmental disabilities for supports and services. An instrument, the Questionnaire for Situational Information (QSI), was developed for use in the needs assessment process. The QSI collects information on need across multiple domains as well as demographic and situational information such as where the person lives. The intent of the QSI is to gather information to be used to plan supports. APD is also exploring the use of the QSI among other pieces of data to develop individual budgets for people receiving developmental disability services. Like Florida, states across the nation have developed needs assessment procedures to help allocate resources to better meet the needs of individuals and make costs more predictable. As recommended by the Standards for Educational and Psychological Testing (Joint Committee on Standards for Educational and Psychological Testing, 1999), APD commissioned a series of studies to evaluate the psychometric properties of this new instrument before using the QSI to make important decisions about individual services and budgets. The series includes the following reports: item analyses, inter-interviewer reliability, test-retest reliability, content validity, and concurrent validity. This paper evaluates the test-rest reliability of the new tool, which measures consistency of an instrument across time. It is important to establish the consistency of scores obtained by the same persons when reexamined with the same test on different occasions. This test-retest reliability coefficient gives an estimate of the error of measurement, or the range of fluctuation likely to occur in a
-2-
single individual’s score as a result of irrelevant, chance factors (Anastasi, 1988). To test this, the same test is administered to the same sample on two different occasions.
Methods Measures The Questionnaire for Situational Information (QSI) was developed by Florida’s Agency for Persons with Disabilities (APD), with the assistance of a private contractor, Human Systems and Outcomes, Inc. The assessment instrument was the combination of several instruments used and revised by APD over the course of the past 10 years. In every administration of the Questionnaire for Situational Information, personal information is gathered by an observation of and a face-to-face interview with the individual with a developmental disability, the individual’s guardian, and the individual’s family (if the individual is a child or has given permission). In addition, interviews are conducted with the individual’s caregivers, health care personnel, behavior analyst, counselors, and other persons as appropriate. Finally, individual records are reviewed including recent assessments and progress notes from medical records, school records, previous support plans, and relevant information from other collateral sources, as appropriate. The QSI focuses on the support needs in 3 domains: functional status, behavioral status, and physical status. The intent, then, is that the individual’s support plan would be based on information from the QSI, the person’s preferences, and the extent to which certain personal outcomes and basic assurances are being met. The Recent Life Experiences survey was used to exclude individuals from the sample who experienced crises or major life changes between the time of the first test and the second test. The instrument is made up of 5 questions that asks about changes in a number of life areas (e.g., residential, vocational, caregiver, health, other).
-3-
Participants The findings reported herein are based on a sample of 125 individuals. Although 136 individuals were recruited for this study, 11 were excluded from the sample due to invalid or incomplete data. Because we were concerned about the impact of major life changes on the stability of scores, a subsample of 111 individuals were identified that had experienced no major life changes in the period of time between the time 1 and time 2 assessments. We report test retest reliability findings for the total sample and for the subsample of individuals experiencing no major life changes. The characteristics of the individuals in the total sample of 125 are reported below. The demographic characteristics of the no life change subsample are not reported because they did not differ from the total sample. The sample was predominately male (58.4%) and race was listed as white (72.0%), black (30%), and unknown (4%). Most of the sample was identified as having a nationality of USA (95.2%), with the remainder identified as Cuban (.8%), Puerto Rican (.8%), other foreign country (.8%), or unknown (2.4%). The primary diagnosis was listed as mental retardation for the majority of individuals (84.0%), with 13.6 listing cerebral palsy and 2.4% listing autism. Ages ranged from 12-80 years with an average of 42.7 (SD=15.0). The majority of participants lived with family members (37.6%) or supported living (36.8%); fewer reported to be living in small group homes (4-6 residents; 13.6%) or large group homes (7-16 residents, 7.2%); the remaining lived in independent living (3.2%), foster care settings (1.6%), or in ICF/DD settings (1.6%).
Procedure The results of the QSI were collected and scored using a web-based application. The sample was selected by sending QSI assessors a list of individuals who had been assessed in the preceding week (July 14-18, 2008) who met the criteria for the study. Each of the assessors were asked to select 3 individuals that met the following criteria: 1) the individual was willing and available to participate in a second QSI assessment, 2) the respondent used in the first test was willing and available and 3) the -4-
instrument where the Recent Life Experiences survey revealed no significant changes in the participant’s life since the first QSI assessment. This survey was completed by telephone before scheduling the second assessment. Because it was noticed that respondents denied life changes on the Recent Life Experiences survey and then contradicted themselves by reporting such major changes in the time 2 QSI interview, the following procedure was used to select the no life changes sample. Item 8a on the QSI provides life change and adjustment information including loss of along-term primary caregiver, survivor or major assault, major injury or illness, change of residency, etc. If a major life change was documented at time 2 and not at time 1, the individual was excluded from the no life changes subsample. A total of 14 individuals were identified as having major life changes in the time between time 1 and time 2 assessments. For comparison, we present data on the entire sample (n= 125) and on the sample experiencing no major life changes (n=111). The length of time between the two assessments ranged from 2 to 23 weeks with an average of 5.1 weeks (SD = 1.8). This interval was determined to be sufficiently long to avoid memory effects where assessors and/or respondents remember and repeat the answers they had given on the first assessment at time 2. yet the interval is not so long that the support needs were likely to change (Urbina, 2004). Furr and Bacharach (2008) recommended a test-retest interval of 2-8 weeks. In this study, only one record fell outside this time interval at 23 weeks.
Data analysis The results were analyzed using SPSS version 17.0 software. Pearson’s product moment correlations were calculated between time 1 and time 2 QSI assessments on the three QSI subscales (functional status, behavioral status and physical status) and on the estimated level. Results are reported for the total sample (n=125) and the subsample that experienced no life changes between time 1 and time 2 assessments (n=111). -5-
These data were compared to the accepted industry standard for reliability coefficients developed by Cicchetti and Sparrow (1981): 0-.4 Poor, .4-.59 Fair, .60-.74 Good, .75-1.00 excellent. Similarly, Anastasi and Urbina (1997) suggested that reliability should generally be .80 or above for psychometric instruments.
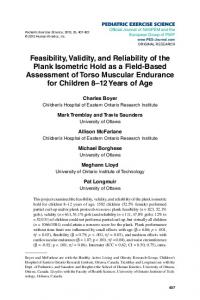
Results and Conclusions Pearson product moment correlations were calculated between the raw scale score at Time 1 and Time 2 for each of the 3 QSI subscales: functional, behavioral, and physical, and the estimated level score.. Participants who were identified during the second QSI assessment (item 8a) as having experienced a major life change during the time between assessments were separated from the rest of the sample to create the no life changes subsample. Correlations are reported in Table 1 for the entire sample and for the 111 participants who experienced no major life change. As shown in Table 1, scores were highly stable over the interval of several weeks. Pearson product moment correlation coefficients ranged from .86 to .94 for the entire sample and from .88 to .94 for the no life change subsample. As predicted, test-retest correlations were somewhat improved when individuals were excluded who had experienced a major life change during the ensuing weeks.
Table 1. Pearson Product Moment Correlations between QSI Time 1 and Time 2 for the Entire Sample and for no Life Changes Subsample.
Functional Behavioral Physical Level Estimate
Total Sample N=125 .94 .87 .90 .86
No Life Changes N=111 .94 .90 .90 .88
-6-
These results are comparable to those reported for three other support needs instruments. The Supports Intensity Scale was developed in conjunction with the Association for Intellectual and Developmental Disabilities. The SIS is widely used for support planning and budget allocation and has well-established reliability and validity. (Thompson, 2004). Morin and Cobigo (2008) reported 3 week test retest coefficients ranging from .68 to .85 across the SIS subscales and total score. The Service Need Assessment Profile (SNAP) was developed in Australia to measure the quantity of support (number of hours) needed to support individuals with disabilities in community settings (Gould, 1998). The 2 week test retest reliability was reported to range from .86 to .97 across subscales (Guscia, 2005). A third instrument was developed in North Carolina and called the Support Needs Assessment Profile, or the NC-SNAP (Hennike, 2006). The NC-SNAP was described by the state of North Carolina as a “needs assessment tool that, when administered properly, measures an individual's level of intensity of need for developmental disabilities (DD) supports and services”. It was adopted for use for all individuals getting services in North Carolina in 1999. The instrument was designed for several different disability groups, and includes supports across all domains, including medical needs and behavioral needs. The instrument uses information across a wide variety of needs to place individuals in one of five service levels. Hennike, Myers, Realon, and Thompson (2006) reported on the psychometric properties of the NC-SNAP and the Revised NC-SNAP. They reported test-retest reliability coefficients ranging from .82 to .93 across subscales for the Revised NC-SNAP over a period of 1 to 4 weeks. In conclusion, these results suggest that the QSI is quite stable over time. The test-retest reliability coefficients met or exceeded industry standards and were comparable to those reported for similar needs assessment instruments.
-7-
References Anastasi, A. (1988) Pyschological Testing. MacMillan Publishing: New York. Anastasi, A., Urbina, S. (1997). Psychological testing. Michigan: Prentice Hall. Cicchetti, D.V. & Sparrow, S.S. (1981). Development of criteria for establishing the interrater reliability of specific items in a given inventory: applications to assessment of adaptive behavior. American Journal of Mental Deficiency, 86, 127-137. Furr, R. M., & Bacharach, V. R. (2008). Psychometrics: An Introduction. Thousand Oaks, CA: Sage Publications. Gould, A. (1998). The Service Need Assessment Profile, version 1.0. Sydney: ATG & Associates Pty Ltd. Guscia, R. (2005). Reliability of the service need assessment profile (SNAP): A measure of support for people with disabilities. Journal of Intellectual Developmental Disability, 30(1), 24. Hennike, J.M. (2006). Development and validation of a needs-assessment instrument for persons with developmental disabilities. Journal of Developmental and Physical Disabilities, 18(2), 201. Joint Committee on Standards for Educational and Psychological Testing (1999). Standards for educational and psychological testing. Washington, DC: American Educational Research Association. Morin, D, Cobigo, V. (2008). AAIDD White Paper Psychometric Properties of the Supports Intensity Scale. The French Version of the Supports Intensity Scale. www.aaidd.org. Thompson, J.R., Bryant, B.R., Campbell, E.M., Craig, E.M., Hughes, C.M., Rotholz, D.A., Schalock, R.L., Silverman, W.P., Tassé, M.J., Wehmeyer, M.L. (2004). Supports intensity scale user manual. Washington, DC: AAMR. Urbina, S., (2004) Essentials of Psychological Testing. John Wiley and Sons, Inc. Hoboken, NJ.
-8-