671
Evaluating the science behind the management advice for North Sea cod Stuart A. Reeves and Martin A. Pastoors Reeves, S. A. and Pastoors, M. A. 2007. Evaluating the science behind the management advice for North Sea cod. – ICES Journal of Marine Science, 64: 671 – 678.
Since 1974, annual assessments have constituted the core of the scientific advice underpinning management of the North Sea cod stock. Here, we base our evaluation of the assessments’ performance on the quality of the advice and on the wider issue of how science is used to produce management advice. At the same time, we consider catch-at-age analyses and catch forecasts in the context of the amount of person-time and expertise available at the relevant working group meetings. The results indicate that, generally, the catch forecasts have been positively biased and that the bias has been driven by three main factors: (i) substantial overestimates of terminal stock size since the late 1990s, (ii) overestimates of incoming recruitment, and (iii) overestimates of growth. Information for other North Sea stocks (haddock, plaice, and sole) suggests that bias is a problem generally, not one unique to cod. Our results include a discussion of ways to use science more effectively in supplying management advice. Keywords: cod, North Sea, scientific advice, stock assessment Received 30 June 2006; accepted 28 November 2006; advance access publication 9 February 2007. S. A. Reeves: Cefas, Lowestoft Laboratory, Pakefield Road, Lowestoft, Suffolk NR33 0HT, UK. M. A. Pastoors: ICES, H. C. Andersens Boulevard 44 –46, DK –1553 Copenhagen V, Denmark, and Wageningen IMARES, PO Box 68, 1970 AB IJmuiden, The Netherlands. Correspondence to S. A. Reeves: tel: þ44 1502 524510; fax: þ44 1502 513865; e-mail:
[email protected].
Introduction Cod (Gadus morhua) in the North Sea have been an important target of fisheries for at least 100 y (Daan, 1978; Hislop, 1996; Pope and Macer, 1996; Bannister, 2004). Scientific advice on the state of the stock has been provided annually since 1974. In recent years, the cod stocks and fisheries in the North Atlantic have been subjected to particularly close scrutiny, a reflection of their historical importance (Kurlansky, 1997), the collapse of Canada’s northern cod stock (Finlayson, 1994), and the general deterioration of stocks in EU waters. Given the long history of North Sea cod assessments and associated advice, an evaluation of the effectiveness of the science behind management advice is appropriate. The assessment/advice process follows an annual cycle that reflects the needs of the primary customer, the Commission of the European Communities, for annual total allowable catch (TAC)-based advice (Holden, 1994). Data from commercial catches and research-vessel surveys are compiled each year and added to the historical time-series for use by an ICES stock assessment working group (hereafter WG). At the WG meeting, the state of the stock is evaluated relative to earlier years and to specified reference points. The stock estimates are then projected forward for different exploitation rates, to provide a range of catch options for the next year. Subsequently, the assessment and catch forecast are peer-reviewed by the ICES Advisory Committee for Fisheries Management, which is also responsible for drafting the management advice. Stock assessment is clearly the heart of the advisory process, but an evaluation of the science must also consider the data collection
programmes, as well as the inputs to the catch forecasts. Although less directly a scientific consideration, the expertise and time available at WG meetings could also affect the performance of the assessment and the resulting advice.
Evaluation criteria The advice is typically presented in the form of a catch-option table that expresses the results of a forecast through the catch and spawning-stock biomass (SSB) that would result from applying a specific fishing mortality (F) during the TAC year. In practice, F cannot be controlled directly; the intention of a TAC is to control removals from the stock and thus to achieve a specific F. On a technical level, therefore, the key aspect to evaluate is the link between forecast catch and implied F. The forecast catches are based on the estimated population numbers projected forward into the TAC year, combined with estimates of recruitment and growth for the same period. If the TAC advice were followed exactly and implemented strictly, the obvious evaluation criterion would be the match between the implied and the realized F. If there is a close correspondence between the two, the science (and the advice) can be said to have performed well. In practice, the evaluation is less straightforward, primarily because the agreed TAC may deviate from the advice and catches may deviate from the agreed TAC. Therefore, we compare initial and subsequent estimates of the same parameters (F, SSB), i.e. the evaluation is based on internal assessment consistency.
Crown Copyright # 2007. Published by Oxford Journals on behalf of the International Council for the Exploration of the Sea. All rights reserved.
672
Assessment inputs The assessment process relies on a variety of inputs, and their quality must be considered. The material covered here refers to all assessments up to and including 2002.
Catch-at-age data All assessments used some form of catch-at-age analysis, which requires total catches disaggregated by age. These data are obtained by raising age compositions from sampled catches to the estimated total catch. O’Brien et al. (2001) estimated coefficients of variation for the total international landings-at-age data for North Sea cod and investigated the effect of sampling error on the parameters estimated by the stock assessment. They concluded that current levels of market sampling cause negligible variability in assessment outputs when compared with how the output is affected by the quality of landings statistics. Because collection of the latter is explicitly the responsibility of regulatory authorities rather than scientists, their quality is not considered here. Estimates of discards have not been included in the catch data. Although a time-series of cod discard estimates is available for the Scottish fleet, these have not been used in routine assessments, partly because the estimates are relatively low when compared with Scottish cod landings (Stratoudakis et al., 1999) and partly because Scottish discarding practices are unlikely to be representative of those of other fleets (ICES, 2003). The lack of discard information in the inputs represents an obvious weakness in the assessment.
Catch-per-unit-effort data In recent years, the cod assessment has been tuned using indices from three independent research-vessel surveys. Evaluation of these surveys indicated that the indices were relatively precise and consistent, both within and among surveys (Beare et al., 2003).
Biological parameters The (fixed) values for natural mortality currently used are averages by age over the years 1980– 1982, derived from multispecies virtual population analysis (MSVPA; Sparre, 1991), and so allow for differences in predation mortality-at-age, but not of possible temporal changes. These values have been reviewed subsequently in the light of updated MSVPA runs, but at least until 1998, the values from the updated runs have been sufficiently similar to the values in use that no change was considered necessary (ICES, 1999). Estimates of weight-at-age in the catch and in the sea are taken from the market sampling programme. Maturity-at-age is a constant vector, with no variation by year. Using more realistic estimates of growth and maturity, the scale of the SSB values altered, but the trajectory over time did not change substantially (Cook et al., 1999).
WG effort, expertise, and workload The amount of scientific expertise and person-time available to do a proper assessment can be summarized in terms of meeting duration and number of participants (Table 1). The name of the WG has changed over the years, as has the number of stocks assessed. This must be taken into account when considering the expertise available specifically for cod. Also, the stock definition (originally Subarea IV) changed over the years, such that the current definition includes cod in the adjacent areas of the Skagerrak
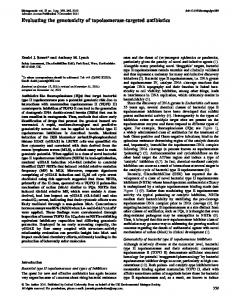
S. A. Reeves and M. A. Pastoors (ICES Division IIIa) and the Eastern Channel (ICES Division VIId). For convenience, however, we use the term “North Sea cod stock” throughout. The duration of WG meetings was initially fixed at 5 d and is currently fixed at 10 d. In between, especially from 1981 to 1992, duration was more variable, perhaps indicating an attempt to adjust the length of the meeting to the expected workload. The number of participants showed a gradual decrease before about 1985 and a general increase thereafter. These two measures may be combined to provide total effort in person-days for each meeting (Figure 1a). The overall quantity of scientific effort expended has increased in a rather linear manner, from around 50 person-days in the mid-1970s to nearly 200 person-days 25 years later. Whether the expertise of the participants has changed over the years is difficult to quantify, but as a proxy, we use the experience of each participant in terms of the number of WG meetings attended previously. Of course, this measure does not take into account whether a member has attended other WG or has had any formal training. During the 29 WGs meetings (1974–2002) considered here, 105 scientists participated in at least one meeting, and one “veteran” attended 22 meetings (Figure 1b). The distribution is clearly skewed, with many people having attended only a single meeting. It may be more informative to look at the average assessment experience represented by all participants present at each meeting (Figure 1c). Following an initial “burn-in” period, the experience available has been remarkably consistent, participants having on average four to five meetings of experience. The dip in 1992 and 1993 reflects integration of the Roundfish and Flatfish WGs, rather than a true dip in assessment experience. An approximate index of the total workload can be obtained from the number of stocks for which standard assessments have been requested (Table 1; full stocks, assessed by some form of model). We neglect to consider here that incidental requests for additional advice may absorb considerable time of WG members. The number of stocks considered by the WG has varied because of a regular restructuring process. The important conclusion is that the number of available man-days per full stock has fluctuated without obvious trend (Figure 1d). The output of a WG meeting is its report. Hence, the number of pages in each report makes a useful metric of the amount of work actually done (Table 1). The number of pages produced showed a steady increase until about 1987, when the increase accelerated to peak in 1997. In recent years, there has been a slight decline. The productivity of the attendees in terms of pages produced per person-day remained more or less constant at about one page until about 1988, after which it increased to a peak in 1996 and since then has remained at around three pages per person-day (Figure 1e). At least part of the increase may be attributed to developments in portable computer technology. However, the key software in use has changed little since 1992, so this trend does seem to reflect a real increase in the workload and/or productivity of the WG. The number of pages dedicated to North Sea cod can only be calculated from 1979 (Table 1). The section has increased in line with the size of the overall report. After some larger variations in the earlier years, the proportion of the report taken up by the section devoted to cod has remained largely stable at close to 10%. Over the 29-y period, the WG has demonstrated considerable scientific ability in developing new analytical tools. Although
673
Evaluating the science behind management advice for North Sea cod Table 1. Characteristics of the meetings and reports of the ICES WGs that have assessed the North Sea cod stock, 1974 –2002. Meeting
Report a
ICES CM reference #p #codb Year Name Start date #d #P #FS 1974 NSRWG 4 March 1974 5 15 3 1974/F: 5 37 – . . . . . . . . . . . . . . . . . . . . . . . . .. . . . . . . . . . . . . . . . . . . . . . . . . . . . . . . . .. . . . . . . . . . . . . . . . . . . . . . . . . . . . . . . . . . . . . . . . . . . . . .. . . . . . . . . . . . . . . . . . . . .. . . . . . . . . . . . . . . . . . . . .. . . . . . . . . . . . . . . . . . . . . . . . .. . . . . . . . . . . . . . . . . . . . . . . . . . . . . . . . . . . . . . . . . . . . . . . . . . .. . . . . . . . . . . . . . . . . . . . . . .. . . . . . . . . . . 1975 NSRWG 10 March 1975 5 10 3 1975/F: 5 42 – . . . . . . . . . . . . . . . . . . . . . . . . .. . . . . . . . . . . . . . . . . . . . . . . . . . . . . . . . .. . . . . . . . . . . . . . . . . . . . . . . . . . . . . . . . . . . . . . . . . . . . . .. . . . . . . . . . . . . . . . . . . . .. . . . . . . . . . . . . . . . . . . . .. . . . . . . . . . . . . . . . . . . . . . . . .. . . . . . . . . . . . . . . . . . . . . . . . . . . . . . . . . . . . . . . . . . . . . . . . . . .. . . . . . . . . . . . . . . . . . . . . . .. . . . . . . . . . . 1976 NSRWG 15 March 1976 5 14 7 1976/F: 9 52 – . . . . . . . . . . . . . . . . . . . . . . . . .. . . . . . . . . . . . . . . . . . . . . . . . . . . . . . . . .. . . . . . . . . . . . . . . . . . . . . . . . . . . . . . . . . . . . . . . . . . . . . .. . . . . . . . . . . . . . . . . . . . .. . . . . . . . . . . . . . . . . . . . .. . . . . . . . . . . . . . . . . . . . . . . . .. . . . . . . . . . . . . . . . . . . . . . . . . . . . . . . . . . . . . . . . . . . . . . . . . . .. . . . . . . . . . . . . . . . . . . . . . .. . . . . . . . . . . 1977 NSRWG 21 March 1977 5 17 6 1977/F: 8 61 – . . . . . . . . . . . . . . . . . . . . . . . . .. . . . . . . . . . . . . . . . . . . . . . . . . . . . . . . . .. . . . . . . . . . . . . . . . . . . . . . . . . . . . . . . . . . . . . . . . . . . . . .. . . . . . . . . . . . . . . . . . . . .. . . . . . . . . . . . . . . . . . . . .. . . . . . . . . . . . . . . . . . . . . . . . .. . . . . . . . . . . . . . . . . . . . . . . . . . . . . . . . . . . . . . . . . . . . . . . . . . .. . . . . . . . . . . . . . . . . . . . . . .. . . . . . . . . . . 1978 NSRWG 3 April 1978 5 15 6 1978/G: 7 89 – . . . . . . . . . . . . . . . . . . . . . . . . .. . . . . . . . . . . . . . . . . . . . . . . . . . . . . . . . .. . . . . . . . . . . . . . . . . . . . . . . . . . . . . . . . . . . . . . . . . . . . . .. . . . . . . . . . . . . . . . . . . . .. . . . . . . . . . . . . . . . . . . . .. . . . . . . . . . . . . . . . . . . . . . . . .. . . . . . . . . . . . . . . . . . . . . . . . . . . . . . . . . . . . . . . . . . . . . . . . . . .. . . . . . . . . . . . . . . . . . . . . . .. . . . . . . . . . . 1979 NSRWG 7 May 1979 5 14 6 1979/G: 7 92 13 . . . . . . . . . . . . . . . . . . . . . . . . .. . . . . . . . . . . . . . . . . . . . . . . . . . . . . . . . .. . . . . . . . . . . . . . . . . . . . . . . . . . . . . . . . . . . . . . . . . . . . . .. . . . . . . . . . . . . . . . . . . . .. . . . . . . . . . . . . . . . . . . . .. . . . . . . . . . . . . . . . . . . . . . . . .. . . . . . . . . . . . . . . . . . . . . . . . . . . . . . . . . . . . . . . . . . . . . . . . . . .. . . . . . . . . . . . . . . . . . . . . . .. . . . . . . . . . . 1980 NSRWG 14 April 1980 5 15 6 1980/G: 8 98 14 . . . . . . . . . . . . . . . . . . . . . . . . .. . . . . . . . . . . . . . . . . . . . . . . . . . . . . . . . .. . . . . . . . . . . . . . . . . . . . . . . . . . . . . . . . . . . . . . . . . . . . . .. . . . . . . . . . . . . . . . . . . . .. . . . . . . . . . . . . . . . . . . . .. . . . . . . . . . . . . . . . . . . . . . . . .. . . . . . . . . . . . . . . . . . . . . . . . . . . . . . . . . . . . . . . . . . . . . . . . . . .. . . . . . . . . . . . . . . . . . . . . . .. . . . . . . . . . . 1981 NSRWG 24 March 1981 10 14 6 1981/G: 8 132 18 . . . . . . . . . . . . . . . . . . . . . . . . .. . . . . . . . . . . . . . . . . . . . . . . . . . . . . . . . .. . . . . . . . . . . . . . . . . . . . . . . . . . . . . . . . . . . . . . . . . . . . . .. . . . . . . . . . . . . . . . . . . . .. . . . . . . . . . . . . . . . . . . . .. . . . . . . . . . . . . . . . . . . . . . . . .. . . . . . . . . . . . . . . . . . . . . . . . . . . . . . . . . . . . . . . . . . . . . . . . . . .. . . . . . . . . . . . . . . . . . . . . . .. . . . . . . . . . . 1982 NSRWG 23 March 1982 10 12 6 1982/Assess: 8 145 13 . . . . . . . . . . . . . . . . . . . . . . . . .. . . . . . . . . . . . . . . . . . . . . . . . . . . . . . . . .. . . . . . . . . . . . . . . . . . . . . . . . . . . . . . . . . . . . . . . . . . . . . .. . . . . . . . . . . . . . . . . . . . .. . . . . . . . . . . . . . . . . . . . .. . . . . . . . . . . . . . . . . . . . . . . . .. . . . . . . . . . . . . . . . . . . . . . . . . . . . . . . . . . . . . . . . . . . . . . . . . . .. . . . . . . . . . . . . . . . . . . . . . .. . . . . . . . . . . 1983 NSRWG 7 June 1983 10 13 6 1983/Assess: 18 125 12 . . . . . . . . . . . . . . . . . . . . . . . . .. . . . . . . . . . . . . . . . . . . . . . . . . . . . . . . . .. . . . . . . . . . . . . . . . . . . . . . . . . . . . . . . . . . . . . . . . . . . . . .. . . . . . . . . . . . . . . . . . . . .. . . . . . . . . . . . . . . . . . . . .. . . . . . . . . . . . . . . . . . . . . . . . .. . . . . . . . . . . . . . . . . . . . . . . . . . . . . . . . . . . . . . . . . . . . . . . . . . .. . . . . . . . . . . . . . . . . . . . . . .. . . . . . . . . . . 1984 NSRWG 12 March 1984 13 12 6 1984/Assess: 10 138 11 . . . . . . . . . . . . . . . . . . . . . . . . .. . . . . . . . . . . . . . . . . . . . . . . . . . . . . . . . .. . . . . . . . . . . . . . . . . . . . . . . . . . . . . . . . . . . . . . . . . . . . . .. . . . . . . . . . . . . . . . . . . . .. . . . . . . . . . . . . . . . . . . . .. . . . . . . . . . . . . . . . . . . . . . . . .. . . . . . . . . . . . . . . . . . . . . . . . . . . . . . . . . . . . . . . . . . . . . . . . . . .. . . . . . . . . . . . . . . . . . . . . . .. . . . . . . . . . . 1985 NSRWG 12 March 1985 10 11 6 1985/Assess: 9 157 14 . . . . . . . . . . . . . . . . . . . . . . . . .. . . . . . . . . . . . . . . . . . . . . . . . . . . . . . . . .. . . . . . . . . . . . . . . . . . . . . . . . . . . . . . . . . . . . . . . . . . . . . .. . . . . . . . . . . . . . . . . . . . .. . . . . . . . . . . . . . . . . . . . .. . . . . . . . . . . . . . . . . . . . . . . . .. . . . . . . . . . . . . . . . . . . . . . . . . . . . . . . . . . . . . . . . . . . . . . . . . . .. . . . . . . . . . . . . . . . . . . . . . .. . . . . . . . . . . 1986 NSRWG 13 March 1986 13 13 9 1986/Assess: 16 163 23 . . . . . . . . . . . . . . . . . . . . . . . . .. . . . . . . . . . . . . . . . . . . . . . . . . . . . . . . . .. . . . . . . . . . . . . . . . . . . . . . . . . . . . . . . . . . . . . . . . . . . . . .. . . . . . . . . . . . . . . . . . . . .. . . . . . . . . . . . . . . . . . . . .. . . . . . . . . . . . . . . . . . . . . . . . .. . . . . . . . . . . . . . . . . . . . . . . . . . . . . . . . . . . . . . . . . . . . . . . . . . .. . . . . . . . . . . . . . . . . . . . . . .. . . . . . . . . . . 1987 NSRWG 9 March 1987 12 14 11 1987/Assess: 15 171 22 . . . . . . . . . . . . . . . . . . . . . . . . .. . . . . . . . . . . . . . . . . . . . . . . . . . . . . . . . .. . . . . . . . . . . . . . . . . . . . . . . . . . . . . . . . . . . . . . . . . . . . . .. . . . . . . . . . . . . . . . . . . . .. . . . . . . . . . . . . . . . . . . . .. . . . . . . . . . . . . . . . . . . . . . . . .. . . . . . . . . . . . . . . . . . . . . . . . . . . . . . . . . . . . . . . . . . . . . . . . . . .. . . . . . . . . . . . . . . . . . . . . . .. . . . . . . . . . . 1988 NSRWG 18 April 1988 12 17 11 1988/Assess: 21 248 27 . . . . . . . . . . . . . . . . . . . . . . . . .. . . . . . . . . . . . . . . . . . . . . . . . . . . . . . . . .. . . . . . . . . . . . . . . . . . . . . . . . . . . . . . . . . . . . . . . . . . . . . .. . . . . . . . . . . . . . . . . . . . .. . . . . . . . . . . . . . . . . . . . .. . . . . . . . . . . . . . . . . . . . . . . . .. . . . . . . . . . . . . . . . . . . . . . . . . . . . . . . . . . . . . . . . . . . . . . . . . . .. . . . . . . . . . . . . . . . . . . . . . .. . . . . . . . . . . 1989 RWG 20 October 1989 7 15 11 1990/Assess: 7 190 17 . . . . . . . . . . . . . . . . . . . . . . . . .. . . . . . . . . . . . . . . . . . . . . . . . . . . . . . . . .. . . . . . . . . . . . . . . . . . . . . . . . . . . . . . . . . . . . . . . . . . . . . .. . . . . . . . . . . . . . . . . . . . .. . . . . . . . . . . . . . . . . . . . .. . . . . . . . . . . . . . . . . . . . . . . . .. . . . . . . . . . . . . . . . . . . . . . . . . . . . . . . . . . . . . . . . . . . . . . . . . . .. . . . . . . . . . . . . . . . . . . . . . .. . . . . . . . . . . 1990 RWG 11 October 1990 13 13 11 1991/Assess: 4 267 20 . . . . . . . . . . . . . . . . . . . . . . . . .. . . . . . . . . . . . . . . . . . . . . . . . . . . . . . . . .. . . . . . . . . . . . . . . . . . . . . . . . . . . . . . . . . . . . . . . . . . . . . .. . . . . . . . . . . . . . . . . . . . .. . . . . . . . . . . . . . . . . . . . .. . . . . . . . . . . . . . . . . . . . . . . . .. . . . . . . . . . . . . . . . . . . . . . . . . . . . . . . . . . . . . . . . . . . . . . . . . . .. . . . . . . . . . . . . . . . . . . . . . .. . . . . . . . . . . 1991 RWG 8 October 1991 11 12 11 1992/Assess: 4 247 24 . . . . . . . . . . . . . . . . . . . . . . . . .. . . . . . . . . . . . . . . . . . . . . . . . . . . . . . . . .. . . . . . . . . . . . . . . . . . . . . . . . . . . . . . . . . . . . . . . . . . . . . .. . . . . . . . . . . . . . . . . . . . .. . . . . . . . . . . . . . . . . . . . .. . . . . . . . . . . . . . . . . . . . . . . . .. . . . . . . . . . . . . . . . . . . . . . . . . . . . . . . . . . . . . . . . . . . . . . . . . . .. . . . . . . . . . . . . . . . . . . . . . .. . . . . . . . . . . 1992 WGNSSK 6 October 1992 9 18 13 1993/Assess: 5 343 30 . . . . . . . . . . . . . . . . . . . . . . . . .. . . . . . . . . . . . . . . . . . . . . . . . . . . . . . . . .. . . . . . . . . . . . . . . . . . . . . . . . . . . . . . . . . . . . . . . . . . . . . .. . . . . . . . . . . . . . . . . . . . .. . . . . . . . . . . . . . . . . . . . .. . . . . . . . . . . . . . . . . . . . . . . . .. . . . . . . . . . . . . . . . . . . . . . . . . . . . . . . . . . . . . . . . . . . . . . . . . . .. . . . . . . . . . . . . . . . . . . . . . .. . . . . . . . . . . 1993 WGNSSK 7 October 1993 9 19 13 1994/Assess: 6 397 41 . . . . . . . . . . . . . . . . . . . . . . . . .. . . . . . . . . . . . . . . . . . . . . . . . . . . . . . . . .. . . . . . . . . . . . . . . . . . . . . . . . . . . . . . . . . . . . . . . . . . . . . .. . . . . . . . . . . . . . . . . . . . .. . . . . . . . . . . . . . . . . . . . .. . . . . . . . . . . . . . . . . . . . . . . . .. . . . . . . . . . . . . . . . . . . . . . . . . . . . . . . . . . . . . . . . . . . . . . . . . . .. . . . . . . . . . . . . . . . . . . . . . .. . . . . . . . . . . 1994 WGNSSK 6 October 1994 9 18 13 1995/Assess: 6 462 51 . . . . . . . . . . . . . . . . . . . . . . . . .. . . . . . . . . . . . . . . . . . . . . . . . . . . . . . . . .. . . . . . . . . . . . . . . . . . . . . . . . . . . . . . . . . . . . . . . . . . . . . .. . . . . . . . . . . . . . . . . . . . .. . . . . . . . . . . . . . . . . . . . .. . . . . . . . . . . . . . . . . . . . . . . . .. . . . . . . . . . . . . . . . . . . . . . . . . . . . . . . . . . . . . . . . . . . . . . . . . . .. . . . . . . . . . . . . . . . . . . . . . .. . . . . . . . . . . 1995 WGNSSK 2 October 1995 9 21 18 1996/Assess: 6 586 57 . . . . . . . . . . . . . . . . . . . . . . . . .. . . . . . . . . . . . . . . . . . . . . . . . . . . . . . . . .. . . . . . . . . . . . . . . . . . . . . . . . . . . . . . . . . . . . . . . . . . . . . .. . . . . . . . . . . . . . . . . . . . .. . . . . . . . . . . . . . . . . . . . .. . . . . . . . . . . . . . . . . . . . . . . . .. . . . . . . . . . . . . . . . . . . . . . . . . . . . . . . . . . . . . . . . . . . . . . . . . . .. . . . . . . . . . . . . . . . . . . . . . .. . . . . . . . . . . 1996 WGNSSK 7 October 1996 9 18 12 1997/Assess: 6 633 63 . . . . . . . . . . . . . . . . . . . . . . . . .. . . . . . . . . . . . . . . . . . . . . . . . . . . . . . . . .. . . . . . . . . . . . . . . . . . . . . . . . . . . . . . . . . . . . . . . . . . . . . .. . . . . . . . . . . . . . . . . . . . .. . . . . . . . . . . . . . . . . . . . .. . . . . . . . . . . . . . . . . . . . . . . . .. . . . . . . . . . . . . . . . . . . . . . . . . . . . . . . . . . . . . . . . . . . . . . . . . . .. . . . . . . . . . . . . . . . . . . . . . .. . . . . . . . . . . 1997 WGNSSK 6 October 1997 10 22 11 1998/Assess: 7 702 67 . . . . . . . . . . . . . . . . . . . . . . . . .. . . . . . . . . . . . . . . . . . . . . . . . . . . . . . . . .. . . . . . . . . . . . . . . . . . . . . . . . . . . . . . . . . . . . . . . . . . . . . .. . . . . . . . . . . . . . . . . . . . .. . . . . . . . . . . . . . . . . . . . .. . . . . . . . . . . . . . . . . . . . . . . . .. . . . . . . . . . . . . . . . . . . . . . . . . . . . . . . . . . . . . . . . . . . . . . . . . . .. . . . . . . . . . . . . . . . . . . . . . .. . . . . . . . . . . 1998 WGNSSK 5 October 1998 10 19 11 1999/ACFM: 08 675 76 . . . . . . . . . . . . . . . . . . . . . . . . .. . . . . . . . . . . . . . . . . . . . . . . . . . . . . . . . .. . . . . . . . . . . . . . . . . . . . . . . . . . . . . . . . . . . . . . . . . . . . . .. . . . . . . . . . . . . . . . . . . . .. . . . . . . . . . . . . . . . . . . . .. . . . . . . . . . . . . . . . . . . . . . . . .. . . . . . . . . . . . . . . . . . . . . . . . . . . . . . . . . . . . . . . . . . . . . . . . . . .. . . . . . . . . . . . . . . . . . . . . . .. . . . . . . . . . . 1999 WGNSSK 11 October 1999 10 20 13 2000/ACFM: 07 598 55 . . . . . . . . . . . . . . . . . . . . . . . . .. . . . . . . . . . . . . . . . . . . . . . . . . . . . . . . . .. . . . . . . . . . . . . . . . . . . . . . . . . . . . . . . . . . . . . . . . . . . . . .. . . . . . . . . . . . . . . . . . . . .. . . . . . . . . . . . . . . . . . . . .. . . . . . . . . . . . . . . . . . . . . . . . .. . . . . . . . . . . . . . . . . . . . . . . . . . . . . . . . . . . . . . . . . . . . . . . . . . .. . . . . . . . . . . . . . . . . . . . . . .. . . . . . . . . . . 2000 WGNSSK 3 October 2000 10 21 11 2001/ACFM: 07 520 44 . . . . . . . . . . . . . . . . . . . . . . . . .. . . . . . . . . . . . . . . . . . . . . . . . . . . . . . . . .. . . . . . . . . . . . . . . . . . . . . . . . . . . . . . . . . . . . . . . . . . . . . .. . . . . . . . . . . . . . . . . . . . .. . . . . . . . . . . . . . . . . . . . .. . . . . . . . . . . . . . . . . . . . . . . . .. . . . . . . . . . . . . . . . . . . . . . . . . . . . . . . . . . . . . . . . . . . . . . . . . . .. . . . . . . . . . . . . . . . . . . . . . .. . . . . . . . . . . 2001 WGNSSK 19 June 2001 10 20 11 2002/ACFM: 01 565 63 . . . . . . . . . . . . . . . . . . . . . . . . .. . . . . . . . . . . . . . . . . . . . . . . . . . . . . . . . .. . . . . . . . . . . . . . . . . . . . . . . . . . . . . . . . . . . . . . . . . . . . . .. . . . . . . . . . . . . . . . . . . . .. . . . . . . . . . . . . . . . . . . . .. . . . . . . . . . . . . . . . . . . . . . . . .. . . . . . . . . . . . . . . . . . . . . . . . . . . . . . . . . . . . . . . . . . . . . . . . . . .. . . . . . . . . . . . . . . . . . . . . . .. . . . . . . . . . . 2002 WGNSSK 11 June 2002 10 21 11 2003/ACFM: 02 624 45 NSRWG, North Sea Roundfish Working Group; RWG, Roundfish Working Group; WGNSSK, Working Group on the Assessment of Demersal Stocks in the North Sea and Skagerrak; #d, duration; #P, participants; #FS, full stocks; #p, pages; and #cod, pages in the cod section. a A “full stock” is defined as a stock assessed by some form of model. b Reports before 1979 did not contain a separate cod section.
innovative developments have been fewer in recent years, there is no evidence of any decline in the expertise represented at meetings. Also, the work accomplished by the WG over the years implies that problems in the assessment or forecast cannot be linked readily to a lack of scientific effort or expertise.
Assessments and forecasts Performance of tuning methods The assessments for North Sea cod have always used some form of VPA (Skagen and Hauge, 2002). These methods estimate past population sizes and F from the accumulated commercial catches of each cohort (year class) over the years, with a correction applied for losses through natural mortality. Once a cohort is no longer present in the catch, the estimated size of that cohort at previous points in time no longer changes. In practice, the population estimates become stable (independent of the addition of another year’s catch data) once a relatively large proportion of the cohort has been caught (the VPA has “converged”; Pope, 1972). A corollary of this property is that estimates of cohort
size and F for the most recent years are less certain and change from one assessment to the other. As the current state of the population serves as the basis for the forecast, methodological development has focused on ways of tuning the VPA, i.e. using additional information to reduce the uncertainty associated with the most recent population estimates. The goal of tuning is to provide the statistically best-fitting estimates of F, and hence stock size, for the most recent years. In practice, this means that the estimates should correspond to those obtained some years later when the VPA has converged. As a result, an appropriate performance measure for the evaluation of tuning methodology is the percentage difference between the initial and converged estimates of mean F (historical analysis; Cadrin and Vaughan, 1997). Alternatively, other population parameters (SSB and recruitment) might be used, but these are affected by additional factors (e.g. mean weight-at-age and survey estimates), so are less suitable for evaluating performance of tuning methods per se.
674
S. A. Reeves and M. A. Pastoors
Figure 2. Trends in mean fishing mortality for North Sea cod from assessments, 1977– 2002. recently, F has been consistently underestimated by .20% and, in fact, the difference may even be greater, because the values from the last assessment are not yet converged completely. On the basis of these results, the time-series may be split into three periods: a period of methodological development up to and including 1987, with large interannual variations in performance; a period of routine usage of a technologically mature methodology and relatively high performance until 1995; and a period of systematic underestimation of F from 1996. Similar tendencies are present in the estimates of SSB, but because estimates of F and stock numbers are inversely related, population size has been overestimated in recent years.
Performance of short-term forecasts
Figure 1. Summary of effort, expertise, and workload of the ICES working groups that have assessed the North Sea cod stock, 1974– 2002. (a) Number of person-days of effort available; (b) frequency distribution of individual participation in meetings; (c) average number of years of previous experience as a member of the WG represented by participants in meetings; (d) number of person-days of effort expended per full stock; and (e) number of report pages produced per person-day.
Until 2002, the mean F on North Sea cod was calculated over ages 2 –8, so this parameter has been derived for as many years as possible from each assessment (Figure 2). The percentage difference between initial and converged estimates is indicated in Figure 3, together with an indication of the tuning methods used (documented by Pope and Shepherd, 1985; Darby and Flatman, 1994; Shepherd, 1999), because these may be expected to have influenced past performance. In earlier years, new tuning methods were introduced every year or two, and the period shows relatively high interannual variation in assessment performance. However, with the introduction of Laurec– Shepherd tuning in 1988, the difference between initial and converged assessments was consistently within 10% until 1995. More
Short-term catch forecasts are methodologically straightforward (Shepherd and Pope, 2002), but they do require additional inputs. In assessment year y, the WG has complete catch data only up to and including the previous year (y 2 1), so can only estimate the population surviving at the start of year y. The TAC advice is required for year y þ 1, so an assumption has to be made about the catch in numbers that may be taken (or the likely F) during year y to generate an estimate of the population numbers at the beginning of year y þ 1. Additionally, estimates of the numbers of fish in year classes recruiting to the exploited population are required from research-vessel surveys. To transform
Figure 3. Time-series of an assessment performance measure for North Sea cod assessments, 1977– 2002: the deviation between terminal mean F as estimated in the assessment year (x-axis) and the converged estimate of mean F for the same year available from the reference assessment, expressed as a percentage of the reference value. The tuning method used is indicated by the shading.
675
Evaluating the science behind management advice for North Sea cod catch and population numbers to corresponding weights, assumptions have to be made about potential changes in weight-at-age. There is uncertainty associated with all (assumed) inputs to a short-term forecast, but again, final estimates of F and recruitment become available as converged estimates from later assessments and final estimates of weight-at-age become available from subsequent sampling during years y and y þ 1. Therefore, we can compare the original WG forecasts during each year with “reference” forecasts using the same algorithm, but replacing the original inputs by the values obtained subsequently. The difference between the two provides an effective performance measure of the original forecast. For F in year y, the normal practice is to use a recent mean value by age to estimate the current exploitation pattern and then to scale this pattern using an overall F-multiplier to reflect presumed changes in exploitation. The F-multiplier is usually equal to one (the assumption of status quo F). The same exploitation pattern is used for the TAC year. The reference forecasts followed the same approach, with F for years y and y þ 1 taken from the corresponding years of the last assessment (2002). The performance of the catch forecasts since 1988 has been evaluated, based on the assumption of status quo F in years y and y þ 1 in Figure 4. This approach allows the relative contributions of the various inputs to be evaluated by running test forecasts that substitute consecutively one type of input in the reference forecast
(Figure 4a: numbers-at-age, F-at-age, and weight-at-age; Figure 4b: numbers of cod aged 1 and 2, numbers aged 3þ, and recruitment) with the values used in the WG forecast, then calculating the resultant deviations from the reference forecast. WG catch forecasts have been consistently higher than the reference forecasts, by some 10– 70% (average 37%). Consequently, advice-based TACs have always been less restrictive than intended. When only stock numbers from the most recent assessment are included in the reference forecasts, the bias is still positive (18 –45%), but the temporal trends are largely removed. The WG weights-at-age have also contributed substantially to the forecast performance, particularly during the period 1991– 1998, when they led to a linear trend in the deviation from 216% to þ24%. In contrast, WG F values contribute little (average just 1%). Therefore, the performance of the short-term forecasts appears affected primarily by a constant positive bias attributable to overestimated stock numbers-at-age and secondarily by unforeseen trends in weights-at-age. The stock numbers used in a forecast may be separated into the population numbers at all ages present at the start of each forecast period and the numbers of recruits entering during the two subsequent years. It is useful to consider the youngest ages in the initial populations (ages 1 and 2) separately from older fish (3þ), because their numbers are often adjusted after running a VPA. Most of the bias associated with stock numbers appears to result from the estimates of the age 1 and age 2 fish, especially during the earlier years, whereas the recruitment estimates contribute very little. Only after 1996 do the 3þ cod numbers contribute substantially to the bias, reflecting the general problems with the VPA in this period, as discussed earlier.
Impact of the bias Two main problems have been identified: the bias observed in VPA since 1996 and the bias in the forecasts through inappropriate estimates of weight-at-age and stock numbers.
VPA bias
Figure 4. Catch forecast performance measures (percentage difference between status quo catch from a test forecast and the value from the corresponding reference forecast using relevant information from the latest assessment) for North Sea cod. The forecasts evaluated are the original WG forecast (thick lines) and test forecasts retaining the values from the reference forecast for all but one type of input: (a) stock numbers, F, and weights-at-age; and (b) stock numbers at age 1 and age 2, stock numbers at age 3þ, and estimates of recruitment in the TAC year. The x-axis is the year when the forecast was run.
The main problem with the recent assessments of North Sea cod has been the strong tendency to underestimate F (and to overestimate stock numbers) in the terminal year. This retrospective problem first made its entry in the 1997 assessment. In contrast, the 1996 assessment overestimated mean F by 12%, and between 1991 and 1995, the estimates of terminal F were within 4% of the converged values. Similar retrospective patterns have been noted for other stocks (ICES, 1991), and Mohn (1999) showed that these can arise from changes in catch data, abundance indices, or model assumptions. Evans (1996) concluded that such a retrospective problem “probably involves a change over time of a quantity that has been assumed constant”. Extended survivors analysis (XSA; Shepherd, 1999) has been used as the standard assessment approach for this stock since 1993, so it included part of the period when the assessment performed well. Other approaches explored by the WG over the same period tended to give similar results to XSA, and changes in XSA settings introduced in the 2000 assessment did not solve the problem. Therefore, the retrospective problem does not appear to be a function of model choice. The absence of discard data, and concerns about misreporting and under-reporting of landings noted at least as far back as 1989, indicates that there is uncertainty associated with the estimates of total catch used in the assessment. However, these problems
676 preceded the onset of the bias problem and by themselves do not explain why the performance shows such a stepwise change. Hence, although unreliable landings statistics and changes in discard rates may represent contributory factors to the VPA bias, it seems likely that other factors are also involved. Analyses of the three survey series used to tune the cod assessment (Beare et al., 2003) indicate that they yield mutually consistent results, which makes it less likely that the problem can be attributed to a change in survey catchability. In earlier years, up to nine commercial catch per unit effort series were used in tuning the assessment. Although there were problems with some of these (Bannister et al., 2000), their subsequent exclusion did not solve the problem. The analysis of assessment inputs and their potential impact does not provide an obvious explanation for the sudden deterioration in performance beginning in 1997. Although the uncertainty in estimates of total catch is the main weakness of the data, bias could also arise from a change in another aspect in the system. During the 1980s and 1990s, a number of changes were noted in the cod stock, including climate-linked changes in recruitment (O’Brien et al., 2000), larval food supply (Beaugrand et al., 2003), and distribution (Blanchard et al., 2005). Given this background, perhaps, the retrospective problem resulted from the interaction among changes in many different factors, rather than from a single large factor.
Bias in forecasts The analysis of forecast performance identified problems in the estimation of stock numbers and weights-at-age as the most important components of forecast bias. The weights-at-age used were derived from a recent average (1988 –1996, 5-y average; thereafter 3-y average). Although this averaging smoothes out observed annual variations, this approach can lead to substantial deviations between the assumed and actual values, if there are multi-year trends (Figure 5). The estimates of numbers of age 1 and age 2 cod used in the forecasts and the reference values for the same year classes (Figure 6) follow the same trend, but abundance has been systematically overestimated in the original forecasts. On average, numbers-at-age-1 and -age-2 were overestimated by 34% and 29%, respectively. The estimates of age 1 fish at the start of the forecast period are derived from a regression procedure that estimates recruitment, based on indices of year-class strength from research-vessel surveys and converged VPA estimates (RCT3; Shepherd, 1997),
Figure 5. Percentage difference between weights-at-age used in WG catch forecasts and the values for the same year observed later for four age groups of North Sea cod (x-axis is the year of the forecast).
S. A. Reeves and M. A. Pastoors
Figure 6. Stock numbers at the start of the forecast period as used by the WG for North Sea cod compared with corresponding values from the reference assessment (open symbols: VPA estimates; closed symbols: RCT3 estimates; and x-axis is the year when the forecast was run). because this age group is hardly represented in the commercial catches. Most estimates of age 2 fish were also RCT3 estimates to replace unreliable VPA estimates. Hence, the problem of systematic overestimation of recruitment is related to the use of RCT3. ICES (2000) identified this problem in relation to North Sea cod, haddock (Melanogrammus aeglefinus), and plaice (Pleuronectes platessa). Shepherd (1997) notes that “the final estimate is always deliberately biased towards the mean”. Therefore, if there is a decreasing trend in recruitment, this inherent bias will result in systematic overestimation of recruitment. This provides an explanation for the bias observed here, because cod recruitment has followed a marked downward trend since the early 1970s. The assumption of status quo F for the intermediate year made only a minor contribution to the overall forecast bias. Implicit in this status quo assumption is that the TAC over the intermediate year does not affect F. Our analysis suggests that this has been a reasonable assumption. The methodologies used to estimate weights-at-age and recruitment have in common their reliance on an average over some past period as an indicator of a future condition. Clearly, this assumption has been inappropriate for both parameters, owing to prolonged trends during specific periods.
Discussion The bias problem in assessment and forecast is not unique to North Sea cod. Pastoors (2005) summarizes less detailed analyses of four North Sea stocks assessed by the same WG (cod, haddock, plaice, and sole Solea vulgaris) over a similar period. Using metrics developed by Jo´nsson and Hjo¨rleifsson (2000), he identified bias in the assessments of all four. Bias was greatest for cod and plaice, but all stocks tended to show periods of negative and positive bias. They showed little relationship between F implied by landings taken in a given year and F for the same year estimated from a recent assessment. These results suggest that the problems noted here are general rather than stock-specific. Jo´nsson and Hjo¨rleifsson (2000) provide a broader context by summarizing the performance of the assessments of 57 ICES stocks in terms of their variability and bias. On the basis of an overall “composite metric of assessment quality”, the North Sea cod assessment showed the best performance of all stocks considered. Although this results from the timing of their study (the bias only became apparent in the 2000 assessment), it does highlight the fact that the North Sea cod assessment has been one of
677
Evaluating the science behind management advice for North Sea cod the most consistent. The other North Sea stocks considered by Pastoors (2005) also performed well against Jo´nsson and Hjo¨rleifsson’s (2000) criteria, with the rank numbers of the haddock, plaice, and sole assessments being 2, 11, and 23, respectively. This suggests that, despite their relatively high quality, the precision is still insufficient to provide the type of advice required. In common with other historical analyses (Sinclair et al., 1985; Cadrin and Vaughan, 1997), we have assumed that there is no error in the converged population estimates with which the initial estimates are compared. This assumption may not be valid because unreported catches in former years will continue to affect converged population estimates. Under these circumstances, any discrepancies observed in initial assessments remain indicative of problems in the assessment, but it may not be straightforward to determine their causes. The performance of the assessment/advice system cannot be viewed in isolation from the type of advice required. As for most European fish stocks, advice is requested on the cod TAC to be decided by the EU for the next year. The approach of providing deterministic catch options based on short-term catch forecasts requires precise estimates of recent stock size, as well as of recruitment and expected growth over the forecast period. It is the type of advice requested that makes errors in these quantities critical. One of the key problems has been the systematic overestimation of the incoming year classes, which represent a major component of the catch forecasts, owing to the depleted state of the population. This bias is linked to a series of below-average year classes, which in itself may be caused partly by the reduced spawning stock and the high exploitation rate. Illegal landings attributable to non-compliance may also have contributed. Therefore, the assessment/advice system becomes least effective when the stock is in greatest trouble. The VPA bias problem was first detected in a provisional assessment made in 2000 (Bannister et al., 2000), and substantial changes have since been made to the tuning. Although the bias in RCT3 estimates of recruitment used in the forecast was detected by the WG, the problem was not addressed. The contrast then is between the VPA bias, caused by external factors, which the WG attempted to resolve, and the internal forecast problem, which the WG did not attempt to resolve. As the latter is clearly a more serious issue, it is the main focus of our discussion. Because the time-series of membership available at WG meetings does not indicate any shortage of effort or expertise in recent years, the failure to address this specific problem must be related more to how the effort has been focused. Before 1992, the frequent changes in adopted VPA tuning methods indicate that the meetings represented a rather dynamic scientific environment in which the WG focused on methodological developments. In later years, the emphasis shifted to exploring the model settings and data included in the model. Methodological development still continued, but was focused on medium-term projections (ICES, 2002) and on precautionary reference points (ICES, 1997; Cook, 1998). These approaches are associated more with longer term management of the stocks than with short-term TAC advice. Several factors may have contributed to the neglect of the shortterm forecast problem. First, the forecast algorithm used follows directly from the exponential decay equations used within the VPA, so there appeared no scope for methodological development in this area. Second, the focus on medium-term modelling approaches may have been at the expense of focus on biological processes such as growth and recruitment, particularly because the increasing workload of the WG did not encourage
investigation of established routine procedures. Finally, the refusal of ICES to give catch-based advice for North Sea cod over the period 1990–1994 may be indicative of a broader lack of scientific support for TAC management as an effective tool to control exploitation rate, which again discouraged focus on the forecast aspect. Bannister (2004) identified the international dimension and the mixed-species nature of the fishery as the two main factors contributing to the recent poor state of the North Sea cod stock, despite all advice having been consistently intended to reduce F. Notwithstanding the change in perception in 2000 regarding retrospective bias, all assessments yielded a consistent picture of a major decline in the stock during the 1980s. In reviewing recent attempts to permit recovery of the stock, Horwood et al. (2006) concluded that although some reduction in fishing effort has been achieved, the cut is not yet enough to ensure recovery of the stock. The performance of catch forecasts has been a long-standing issue. Brander (1987) concluded that year-ahead forecasts were subject to relatively high prediction errors, and Rivard and Foy (1987) found that the forecasts evaluated tended to be overly optimistic. These results are qualitatively similar to ours, despite all the developments in assessment methodology since these earlier studies. Our analyses indicate that the WG has been capable of implementing innovative scientific analyses and is still a repository of substantial scientific expertise. Although some of the problems encountered can be attributed to the specific form of TAC advice required, we suggest that the scientific resources could have been deployed more effectively if the WG had allowed itself more time for reflection. In particular, more routine monitoring of the performance of the annual assessments and forecasts should have helped to detect problems and to respond to these as they occurred. Perhaps, there has also been a tendency to focus on the mathematical aspects, whereas more biological input might have been useful. Indications that other scientific inputs, such as from catch-sampling procedures or research-vessel surveys, have contributed to the bias are largely absent. Since 2002 (the last assessment used in this evaluation), the cod assessments and advice have undergone substantial changes. Changes include the development of a new method for estimating unaccounted removals (Darby, 2005) and the inclusion of discard data. In addition, attempts to address the mixed-species nature of North Sea demersal fisheries (Vinther et al., 2004) and the wider context of the ecosystem approach to fisheries management influence the way in which advice is formulated. Perhaps, equally influential has been the increased involvement of stakeholders in the process through the establishment of a North Sea Regional Advisory Committee. It remains to be seen how this changing context will influence the effectiveness of the WG as a scientific environment.
Acknowledgements The study was funded by the European Community under the 5th Framework Programme, Contract No. Q5RS–2002–01782: “Policy and knowledge in fisheries management – the North Sea cod case (PKFM)”. We are grateful for the comments of Niels Daan, Jan Horbowy, Marine Pomarede, and Denis Rivard that led to substantial improvements in the original manuscript.
678
References Bannister, R. C. A. 2004. The rise and fall of cod (Gadus morhua, L.) in the North Sea. In Management of Shared Fish Stocks, pp. 316 – 338. Ed. by A. I. L. Payne, C. M. O’Brien, and S. I. Rogers. Blackwell, Oxford. 384 pp. Bannister, R. C. A., Casey, J., Cook, R., Darby, C., Horwood, J., O’Brien, C., Reeves, S. et al. 2000. North Sea Cod Meeting, Lowestoft, 22 – 23 August 2000. Working Document to WGNSSK 2000. Beare, D., Castro, J., Cotter, J., van Keeken, O., Kell, L. T., Laurec, A., Mahe´, J-C. et al. 2003. Evaluation of Research Surveys in Relation to Management Advice (EVARES – FISH/2001/02 – Lot 1). Final Report to European Commission Director-General Fisheries. Beaugrand, G., Brander, K. M., Lindley, A. J., Souissi, S., and Reid, P. C. 2003. Plankton effect on cod recruitment in the North Sea. Nature, 226: 661 – 664. Blanchard, J. L., Mills, C., Jennings, S., Fox, C. J., Rackham, B. D., Eastwood, P. D., and O’Brien, C. M. 2005. Distributionabundance relationships for North Sea Atlantic cod (Gadus morhua): observation versus theory. Canadian Journal of Fisheries and Aquatic Sciences, 62: 2001– 2009. Brander, K. 1987. How well do working groups predict catches? Journal du Conseil International pour l’Exploration de la Mer, 43: 245– 252. Cadrin, S. X., and Vaughan, D. S. 1997. Retrospective analysis of virtual population estimates for Atlantic menhaden stock assessments. Fishery Bulletin US, 95: 445– 455. Cook, R. M. 1998. A sustainability criterion for the exploitation of North Sea cod. ICES Journal of Marine Science, 55: 1061– 1070. Cook, R. M., Kunzlik, P. A., Hislop, J. R. G., and Poulding, D. 1999. Models of growth and maturity for North Sea cod. Journal of Northwest Atlantic Fisheries Science, 25: 91– 99. Daan, N. 1978. Changes in cod stocks and cod fisheries in the North Sea. Rapports et Proce`s-Verbaux des Re´unions du Conseil International pour l’Exploration de la Mer, 172: 39 – 57. Darby, C. D. 2005. Estimating systematic bias in the North Sea cod landings data. Report of the Working Group on the Assessment of Demersal Stocks in the North Sea and Skagerrak, Appendix 4. ICES Document CM 2005/ACFM: 7. Darby, C. D., and Flatman, S. 1994. Virtual population analysis: version 3.1 (Windows/Dos) user guide. MAFF Information Technology Series, 1, Directorate of Fisheries, Lowestoft. Evans, G. T. 1996. Using the elementary operations of sequential population analysis to display problems in catch or survey data. Canadian Journal of Fisheries and Aquatic Sciences, 53: 239 – 243. Finlayson, A. C. 1994. Fishing for truth; a sociological analysis of northern cod stock assessments from 1977– 1990. Social and Economic Studies, 52, Institute of Social and Economic Research, Memorial University, Newfoundland. 176 pp. Hislop, J. R. G. 1996. Changes in North Sea gadoid stocks. ICES Journal of Marine Science, 53: 1146 – 1156. Holden, M. 1994. The Common Fisheries Policy, Origin, Evaluation and Future. Fishing News Books, Oxford. 288 pp. Horwood, J., O’Brien, C., and Darby, C. 2006. North Sea cod recovery? ICES Journal of Marine Science, 63: 961 – 968. ICES. 1991. Report of the Working Group on Methods of Fish Stock Assessment. ICES Document CM 1991/Assess: 25. 147 pp. ICES. 1997. Report of the Study Group on the Precautionary Approach to Fisheries Management, February 1997. ICES Document CM 1997/Assess: 7. ICES. 1999. Report of the Working Group on the Assessment of Demersal Stocks in the North Sea and Skagerrak. ICES Document CM 1999/ACFM: 8. ICES. 2000. Report of the Working Group on the Assessment of Demersal Stocks in the North Sea and Skagerrak. ICES Document CM 2000/ACFM: 7.
S. A. Reeves and M. A. Pastoors ICES. 2002. Report of the Working Group on Methods of Fish Stock Assessment. ICES Document CM 2002/D: 1. ICES. 2003. Report of the Working Group on the Assessment of Demersal Stocks in the North Sea and Skagerrak. ICES Document CM 2003/ACFM: 2. Jo´nsson, S. T., and Hjo¨rleifsson, E. 2000. Stock assessment bias and variation, analysed retrospectively from ICES control sheets, and introducing the PA-residual. ICES Document CM 2000/X: 9 Kurlansky, M. 1997. Cod: a biography of the fish that changed the world. Jonathan Cape, London. 294 pp. Mohn, R. 1999. The retrospective problem in sequential population analysis: an investigation using cod fishery and simulated data. ICES Journal of Marine Science, 56: 473 – 488. O’Brien, C. M., Darby, C. D., Rackham, B. D., Maxwell, D. L., Degel, H., Flatman, S., Mathewson, M. A. et al. 2001. The precision of international market sampling for North Sea cod (Gadus morhua L.) and its influence on stock assessment. ICES Document CM 2001/P: 14. O’Brien, C. M., Fox, C. J., Planque, B., and Casey, J. 2000. Climate variability and North Sea cod. Nature, 404: 142. Pastoors, M. 2005. Evaluating fisheries management advice for some North Sea stocks: is bias inversely related to stock size? ICES Document CM 2005/V: 20. Pope, J. G. 1972. An investigation of the accuracy of virtual population analysis using cohort analysis. ICNAF Research Bulletin, 9: 65– 72. Pope, J. G., and Macer, C. T. 1996. An evaluation of the stock structure of North Sea cod, haddock, and whiting since 1920, together with a consideration of the impacts of fisheries and predation on their biomass and recruitment. ICES Journal of Marine Science, 53: 1157– 1169. Pope, J. G., and Shepherd, J. G. 1985. A comparison of the performance of various methods for tuning VPAs using effort data. Journal du Conseil International pour l’Exploration de la Mer, 42: 129– 151. Rivard, D., and Foy, M. G. 1987. An analysis of errors in catch projections for Canadian Atlantic fish stocks. Canadian Journal of Fisheries and Aquatic Sciences, 44: 967– 981. Shepherd, J. G. 1997. Prediction of year-class strength by calibration regression analysis of multiple recruit index series. ICES Journal of Marine Science, 54: 741 – 752. Shepherd, J. G. 1999. Extended survivors analysis: an improved method for the analysis of catch-at-age data and abundance indices. ICES Journal of Marine Science, 56: 584– 591. Shepherd, J. G., and Pope, J. G. 2002. Dynamic pool models II: shortterm and long-term forecasts of catch and biomass. In Handbook of Fish Biology and Fisheries. 2. Fisheries, pp. 164 – 188. Ed. by P. J. B. Hart, and J. D. Reynolds. Blackwell, Oxford. 410 pp. Sinclair, M., Anthony, V. C., Iles, T. D., and O’Boyle, R. N. 1985. Stock assessment problems in Atlantic herring (Clupea harengus) in the Northwest Atlantic. Canadian Journal of Fisheries and Aquatic Sciences, 42: 888– 898. Skagen, D. W., and Hauge, K. H. 2002 Recent development of methods for analytical fish stock assessment within ICES. ICES Marine Science Symposia, 215: 523– 531. Sparre, P. 1991. Introduction to multispecies virtual population analysis. ICES Marine Science Symposia, 193: 12 – 21. Stratoudakis, Y., Fryer, R. J., Cook, R. M., and Pierce, G. J. 1999. Fish discarded from Scottish demersal vessels: estimators of total discards and annual estimates for targeted gadoids. ICES Journal of Marine Science, 56: 592 – 605. Vinther, M., Reeves, S. A., and Patterson, K. R. 2004. From singlespecies advice to mixed-species management: taking the next step. ICES Journal of Marine Science, 61: 1398– 1409. doi:10.1093/icesjms/fsl048