John Robinson and Liz Bennett provided insightful comments on the manuscript. I am grateful to the ...... Paper prepared for the Liz Claiborne Art Ortenberg.
EVALUATING THE SUSTAINABILITY OF SUBSISTENCE HUNTING IN TROPICAL FORESTS by Carlos A. Peres
CSERGE Working Paper GEC 97-22
EVALUATING THE SUSTAINABILITY OF SUBSISTENCE HUNTING IN TROPICAL FORESTS by Carlos A. Peres Centre for Social and Economic Research on the Global Environment University of East Anglia and University College London and School of Environmental Sciences University and East Anglia
Acknowledgments The Centre for Social and Economic Research on the Global Environment (CSERGE) is a designated research council of the Economic and Social Research Council (ESRC). Data presented here were obtained during a long-term series of line-transect censuses funded by the Bay Foundation (1996-1997), Wildlife Conservation Society (1991–1995), the National Geographic Society (1991–1992), and the World Wildlife Fund–US (1987–1989). I am grateful to the Brazilian Oil Company (Petrobrás, S.A.) for providing critical logistical support and helicopter transportation to some of the survey sites. João Pompilho, Raimundo Nonato, Luís Lopes, Paul Honess, “Toshiba”, Josimar Pereira, Edvar Corrêa, Pedro Develey, and Hilton Nascimento helped in conducting censuses. I wish to thank Jay Malcolm, Jim Patton, Maria N.F. da Silva, and Claude Gascon for sharing the pains and joys of the Projeto Juruá with me. John Robinson and Liz Bennett provided insightful comments on the manuscript. I am grateful to the Brazilian Science and Research Council (CNPq) for funding a post-doctoral fellowship which made part of the fieldwork possible. ISSN 0967-8875
Abstract
Large-bodied vertebrates are perhaps the most ecologically sensitive extracts of tropical forests, and their sustained management will become increasingly critical to the long-term integrity of these ecosystems. This paper presents the results of a long-term programme (1986-1996) of wildlife surveys, based on a standard linetransect censusing technique, which was designed to quantify the impact of different levels of hunting pressure across a wide range of Amazonian forest habitats. This is the most comprehensive set of quantitative biodiversity inventories of large-bodied birds and mammals for a given region of tropical forest. Population density and biomass estimates obtained at 25 terra firme and floodplain forest sites are used to determine which game species are most susceptible to population declines and local extinctions resulting from subsistence hunting practices. These estimates are then applied to a demographic model to determine the potential production and sustainable harvest of different game species within two broad classes of forest types. Data presented here indicate that estimates of forest productivity and baseline population density are essential components of sampling protocols designed to evaluate to what extent a game harvest regime can be considered to be sustainable.
1.
Introduction
Large-bodied vertebrates are perhaps the most ecologically sensitive extracts of tropical forests and their sustained management will become increasingly critical to the long-term integrity of these ecosystems. Throughout human history, however, the relentless harvest of game meat by subsistence hunters around the tropics has resulted in conspicuous population declines and extinctions ranging from local to global scales for many species of birds and mammals (e.g. Diamond, 1984; Milberg & Tyrberg, 1993). Growing concerns for this widely acknowledged faunal conservation problem is reflected in a flurry of research on the impact of game hunting by both conservation ecologists and applied anthropologists (see Redford & Robinson, 1987; Robinson & Redford, 1991a and references therein). Large vertebrates often account for a greater direct-use market value of any category of forest products extracted by tropical forest dwellers (e.g. Anstey, 1991; Melnik & Bell, 1996). As a consequence, game species continue to be eliminated from otherwise undisturbed tropical forests which may be left strangely quiet, reminiscent of silent cathedrals, once their most prominent megafauna has been seriously reduced in numbers if not extirpated (e.g. Emmons, 1989; Peres, 1991; Redford, 1992; Terborgh et al., 1986). In areas containing relatively high densities of humans relying on non-aquatic sources of animal protein, subsistence hunters have been forced to become increasingly unselective to the point of targeting even small-sized prey items of low return value per unit of hunting effort. From the semi-arid deciduous caatinga of northeastern Brazil to the West African rain forests of Mali, Burkina Faso, Ghana and Cote d’Ivoire, to mention but a few examples, many a dinner plate is now supplemented by even small morsels (Johansson, 1995; Peres, personal observations). In sharp contrast, relatively abundant stocks of animal protein mainly from highly productive aquatic sources - are often available in western Amazonia, allowing for relatively selective subsistence hunting practices which largely ignores small-bodied forest vertebrates (Peres, 1990; Bodmer, 1995a). Despite the importance of subsistence game hunting in the tropics for both human welfare and wildlife conservation, the methodology and field data required to form sound game management policy are still in their infancy. Ideally, evaluation of the sustainability of a harvest system should consider its effect on age- or sizedependent fecundity, growth and survival rates of individuals, and the growth rate and age structure of populations (Lefkovitch, 1967; Usher, 1976). Conservation biology texts may even assume that long-term monitoring programs should be in place before a population decline caused by overharvesting can be properly diagnosed (e.g. Caughley & Gunn, 1996). Yet the effects of different 1
cull regimes on population dynamics cannot be explored because detailed demographic information is not available for any large-bodied tropical forest vertebrate. Unlike classic studies in the temperate zone on game hunting (e.g. McCullough, 1979; Milner-Gulland, 1994) and other resource harvest systems (Getz & Haight, 1989), most studies on tropical subsistence hunting are based on harvest data obtained from household interviews (e.g. Ayres et al., 1991), counts of animal carcasses consumed at forest dwellings (e.g. Valenzuela et al., this volume), and surveys of wildlife meat sold at urban markets (e.g. Fa et al., 1995). These data, however, cannot be easily translated into actual cull rates because the collateral mortality caused by hunters (e.g. non-retrieval of fatally wounded animals; deaths of unweaned infants) can be very significant. Although some of these studies derive average figures for game offtake per unit area using an estimated hunting range, they fail to consider the enormous variability in habitat productivity which result in natural differences in large vertebrate abundance independent of hunting (e.g. Arita et al., 1990; Robinson & Redford, 1994). This severely limits the predictive power of sustainable yield models as applied to a given forest site. In a recent attempt to model sustainable harvest rates for several neotropical mammal species, Robinson & Redford (1991b) acknowledge this problem in stating that the “population density estimate is usually the largest numerical contributor to the model, so an error in this estimate will generate the largest error in the final harvest value”. Yet mammal population densities can vary widely across different spatial scales, as documented for entire continents (e.g. Chapman & Feldhamer, 1982 and references therein), large tropical macrohabitats (August, 1983; Emmons, 1984; Oates et al., 1990; Peres, 1997a), and even different parts of relatively small study areas (Peres, 1993; Chapman & Onderdont, unpublished data). This is understandable given that the schedules of births, survival, deaths, and migration can be regulated by features of a given habitat such as rainfall seasonality, soil fertility, availability of food and shelter, and vegetation structure and composition, which then define its species-specific carrying capacity (K). Yet data on population responses to varying degrees of hunting pressure under different environmental conditions remain scarce or nonexistent for most tropical game species. From this perspective, comparing faunal densities at different sampling sites to examine the effects of hunting pressure on game abundance (e.g. Bodmer, 1995a; Glanz, 1991; Peres, 1990, 1996, 1997b; Silva & Strahl, 1991) would seem pointless. However, in the absence of long-term studies in one area using data on both cull rates and stock recovery, cross-site comparisons using control sites can be a powerful tool to assess the impact of subsistence hunting. In this paper, I consider a long-term series of line-transect censuses of tropical forest vertebrates conducted at multiple sites under varying degrees of subsistence hunting pressure, to examine the effects of hunting on vertebrate community structure. I 2
begin by describing the overall impact of subsistence hunting on vertebrate densities and biomass at the population and community level. I then demonstrate the importance of considering habitat type, and its effects on game productivity, in quantifying whether a given harvest program is sustainable. In addition I use a literature review and my own field data to assess the variability in population density of two of the most ubiquitous neotropical primates across different harvest regimes. Finally, I apply the results of these line-transect censuses to Robinson & Redford’s (1991b) model of sustainable game yield to evaluate its predictive power under the scenario, usually faced by researchers, in which local densities of game populations are not known.
3
2.
Methods
This study is primarily based on a long-term series of standardized line-transect censuses of diurnal forest reptiles, birds and mammals, undertaken over 10 years (1987-1996) at 24 Amazonian forest sites (Table 1). This is the most comprehensive set of quantitative inventories of medium to large-bodied tropical forest vertebrates based on this technique. These surveys have focused on a limited number of diurnal primary consumers - including primates, ungulates, squirrels, caviomorph rodents, cracids, tinamous, trumpeters, wood-quails, and tortoises - which comprise the bulk of the total vertebrate community biomass in neotropical forests (Eisenberg & Thorington, 1973; Terborgh, 1983; Terborgh et al., 1990, Peres (in press)). Surveyed species are placed into 32 discrete functional groups corresponding to a single species, or a few ecologically similar taxa (see Appendix for species names and groupings), and are collectively referred to in this paper as ‘vertebrates’. Because of their size and abundance, these taxa are also the most amenable to direct obser-vations, allowing relatively accurate estimates of population density using census data. The diurnal linetransect censuses conducted here thus capture the vast majority of game species consumed by subsistence hunters in Amazonian forests. The main exceptions are a few species of nocturnal mammals, such as pacas (Agouti paca), armadillos (e.g. Dasypus spp., Priodontes maximus) and night monkeys (Aotus spp.), and large-bodied canopy birds, such as macaws (Ara spp.) and large toucans (Ramphastos spp.), which tend to be highly mobile and notoriously difficult to census, but are less frequently killed.
4
5
6
3.
Sampling Sites
Sampling sites comprised 17 unflooded (hereafter, terra firme) forests, five seasonally flooded (hereafter, várzea) forests, one alluvial forest inundated at irregular supra-annual intervals, and one transitional terra firme/palm forest punctuated by small enclaves of edaphic savannas (cerrados). These are located within the watersheds of several major rivers of eastern (upper Xingú river basin: 1 site) and western Brazilian Amazonia (Juruá, upper Tarauacá, Jutaí, upper Purús, upper Tefé, and upper Urucu rivers: 23 sites; see Figure 1 and Table 1). Forest type and level of hunting pressure were the main criteria used in selecting sampling sites within a river basin. Wildlife populations sampled at these sites are assumed to be spatially independent of one another because any two sites within the same forest type were at least 45 km from one another or separated by a major river. Data from one additional alluvial Amazonian forest site, Cocha Cashu, southern Peru, for which reliable density estimates are available for all large-bodied bird (Terborgh et al., 1990) and mammal species (Janson & Emmons, 1990), were also incorporated into the analysis. Unhunted sites are defined as those entirely uninhabited by Amerindians, nontribal extractivists (known in Brazil as caboclos), or rubber-tappers of European origin (seringueiros), and which offered no enduring evidence of any hunting activity this century (e.g. core heartwoods severed by axes along perennial forest streams navigable by dugout canoes; bark scars on Couma, Brosimum and Hevea tree boles). These sites could not be economically reached on foot by hunters, and access to them was largely restricted to helicopters made available to us by the Brazilian Oil Company (Petrobrás, S.A.). The term “unhunted” as used in this paper is thus reserved for truly pristine forests of remote interfluvial basins and headwaters regions of Amazonia, rather than to areas only rarely visited by hunters. With one exception, hunting in all hunted sites was purely for subsistence. At Igarapé Curimatá (site 5 in Figure 1) game meat was harvested for both local consumption and sale, but the commercial motivation behind the latter was unimportant. At hunted sites, reliable data on game offtake were rarely available, and it was difficult to accurately quantify their hunting history over the last several decades. I therefore assigned them to one of three broad categories of game harvest: light, moderate, or heavy hunting pressure. This was based on (i) semi-structured interviews with hunters who either lived or had lived at a given site for at least two years, (ii) present and past human population densities quantified on the basis of the number of active households in each area, as determined from high-resolution maps (1:250,000) of each survey area (RADAM 1973− 1981), and (iii) the number of gun shots heard during each line-transect 7
census. Interviews with hunters were unbiased with respect to fear of disclosing any illegal hunting activity, since interviewees in such remote parts of Amazonia did not seem aware of any hunting restrictions or laws on protected species. The abundance of species most susceptible to hunting was not used to infer on the previous history of hunting at a given site, for this relationship can be confounded by environmental heterogeneity. I therefore assume that the crude scale of hunting pressure used here was the most refined this methodology could afford in the absence of more accurate hunting records.
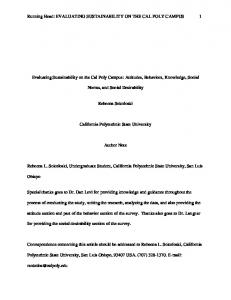
Figure 1:
Note:
Location of forest sites in Brazilian Amazonia (sites 1-24) censused during this study.
Data for Cocha Cashu, Peru (site 25) are from Terborgh et al., (1990) and Janson and Emmons, (1990). Site numbers correspond to those listed in Table 1.
8
Forest sites were also assigned to one of three broad levels of topsoil fertility according to differences in seasonal influx of alluvial sediments. In lowland Amazonia, these are almost the only sources of key soil macronutrients including carbon, nitrogen, potassium, calcium, magnesium, and phosphorus (M. Riley in litt., C. Peres, unpublished data). Hence, I classified all sites into terra firme, alluvial, or várzea according to their positions within a watershed, and to concentrations of macronutrients found in 20 soil samples collected along census transects at each site (C. Peres, unpublished data). The only outlier is represented by Pinkaiti, Kayapó Reserve (site 18 in Figure 1), an eastern Amazonian forest sustained by exceptionally rich soil nutrients compared to terra firme forests of western Amazonia.
3.1
Population censuses
Each survey comprised a cumulative census distance of 113.5 ± 78.0 km (range = 44 − 359 km), giving a total of 2724 km of census walks at the 24 sites. Censuses were conducted from early morning to mid-day (0600 − 1130 h) by at least two independent observers walking separately on up to four forest transects of 4-5 km in length per site. Transects were cut and marked every 50 m, and then left to ‘rest’ for one or two days which were immediately followed by 10 to 15 days of census walks. At previously hunted sites, we avoided using established hunting paths because this may introduce a bias resulting in density underestimates. This is because game animals could (i) shy away from such areas, (ii) be excessively shy of observers using them, or (iii) present more elusive escape responses less likely to be detected by observers. No censuses were conducted on rainy days since that could also introduce bias. Censuses were conducted by one observer per transect (CAP and other observers with at least 5 years of previous experience) with walking velocities of approximately 1250 m h− 1, and were usually completed within a 30-day period. An index of the numbers of animals (or groups in the case of social species) encountered per 10 km walked (hereafter, sighting rates) was calculated to control for overall differences in sampling effort. Density estimates were derived from either the Hazard rate or Uniform models with a cosine adjust-ment (Buckland et al., 1993) using ungrouped perpendicular distances from the sampling transect to the first animal sighted. Data truncation was used for a few highly vocal species (e.g. Alouatta spp., Callicebus spp.) by excluding vocallymediated outlier records at extreme distances from the transect because those appeared to be detrimental to the performance of model estimators. For social species in which group size can bias detection probabilities towards species in large, uncohesive groups, a correction factor based on the group spread of a 9
given species was also incorporated into the model (Peres, 1997a). These models provided a better fit for species-specific data sets than did the Fourier series and Half-normal models, as determined by the minimum Akaike Information Criterion (see Buckland et al., 1993). In order to avoid unrealistic distortions of detection curves due to small sample sizes in the case of relatively rare species, a pooled analysis was done for all surveys yielding fewer than 40 independent sightings - the minimum recommended by Burnham et al., (1980). This was justified since between-site variances in perpendicular distances were no greater than those within sites (ANOVAs, p>0.05 in all cases). Population densities (D) were then calculated using mean group sizes at each site from the fraction of total group counts obtained during censuses and considered to be accurate. To calculate crude population biomass, I used the mean body mass of an individual of a given species, defined as 80% of the average body mass of adults in Amazonian populations. Body mass data were compiled from Terborgh et al., 1990; Bodmer, 1993; Peres, 1993b; and C. Peres and H. Nascimento (unpublished data). Densities were assumed to be greater than zero if a species had been recorded within a site, either during or outside our census routine. A species was assumed to be locally extinct at a given site if local hunters interviewed during surveys agreed unanimously that it had once been common, but had not been sighted for at least five years prior to surveys. Further details on sampling sites, census methodology and data analysis can be found elsewhere (Peres, 1993a, 1997a, 1997b; Peres et al., 1997).
3.2
Data from other sources
To examine further the variation in game population density, density estimates were compiled from a comprehensive literature review of two widely distrib-uted mammal taxa of neotropical forests - brown capuchin monkeys (Cebus apella) and howler monkeys (Alouatta spp.). These represent some of the most extensively censused neotropical mammals. Including my own census data from Amazonia, I obtained density estimates for 72 South American populations of brown capuchins (unpublished report), and 113 howler monkey populations (Peres, 1997b) spanning from southern Mexico to northern Argentina and covering a wide range of neotropical forest types. In compiling data sets for mammalian species, density estimates were also incorporated from five additional hunted sites of western Amazonia obtained from comparable line-transect censuses (Martins, 1992; Bodmer, 1993; Calouro, 1995). These studies, however, were not used to derive estimates of total vertebrate biomass because they did not include game birds in their censuses. 10
3.3
Statistical analysis
Factorial ANOVAs were used to test for the effects of independent environmental variables on community-wide parameters. An indirect gradient analysis (CANOCO: ter Braak 1988) was also used to examine the overall siteby-species abundance matrix. Detrended correspondence analysis (DCA), which reduces the multiple dimensions of n species across m forest sites to a few ordination axes, proved to be the most appropriate ordination technique for this matrix. The performance of other techniques applied to the same matrix was consistently poor and showed systematic distortions of the first axis (arch effect). Species occurrences were weighed by their untransformed density estimates at each site. Points in the joint plots corresponding to forest sites are thus located at the center of gravity of the species occurring there, particularly those which are most abundant and widespread. Species were entered in the ordination according to discrete functional groups (see Appendix for species groupings) thus allowing for geographic replacements of ecologically equivalent congeners across different interfluvial regions of Amazonia. Two species - Piping guans (Aburria pipile) and beared saki monkeys (Chiropotes satanas) - were excluded from this analysis because they only occurred at a few censused sites.
11
4.
Results
4.1
Vertebrate densities at unhunted and hunted sites
Considering all sampling sites, density and biomass estimates were calculated for 2 species of reptiles (1 genus), 17 birds (8 genera), and 32 mammals (18 genera). These comprised assemblages of diurnal vertebrates dominated by small (