EVALUATING THE USABILITY OF GEO-LOCATED TWITTER AS A TOOL FOR HUMAN ACTIVITY AND MOBILITY PATTERNS: A CASE STUDY FOR NYC Abdullah Kurkcu, M.Eng. (Corresponding Author) Graduate Research Assistant, Department of Civil & Urban Engineering, Polytechnic School of Engineering, Center for Urban Science + Progress (CUSP), New York University (NYU) One MetroTech Center, 19th Floor, Brooklyn, NY 11201, U.S.A. Tel: 1-(646)-997-0538 Email:
[email protected] Kaan Ozbay, Ph.D. Professor, Department of Civil & Urban Engineering, Polytechnic School of Engineering, Center for Urban Science + Progress (CUSP), New York University (NYU) One MetroTech Center, 19th Floor, Brooklyn, NY 11201, U.S.A. Tel: +1 (646) 997 0552 Email:
[email protected] Ender Faruk Morgul, M.Sc. Graduate Research Assistant, Department of Civil & Urban Engineering, Polytechnic School of Engineering, Center for Urban Science + Progress (CUSP), New York University (NYU) One MetroTech Center, 19th Floor, Brooklyn, NY 11201, U.S.A. Tel: 1-(646)-997-0531 Email:
[email protected]
Word count: 4,463 Text + 2 Tables + 9 Figures = 7,213 words Abstract: 121 words
Submission Date: August 1, 2015
Paper Submitted for Presentation and Publication at the Transportation Research Board’s 95th Annual Meeting, Washington, D.C., 2016
1 2 3 4 5 6 7 8 9 10
ABSTRACT The increasing use of new mobile devices and location sharing services such as Twitter has provided novel approaches for studying human mobility patterns with satisfactory quantities. The role of location in digital world has changed as expanding numbers of internet users including location information to their posts. These digital footprints allowed researchers to study the spatial and temporal characteristics of human activity and mobility patterns. This paper introduces an approach to collecting and utilizing geo-located Twitter status updates to report a quantitative assessment of human mobility. The results show that Twitter users follow the “Lévy Flight” mobility patterns. Moreover, the estimated mobility flows are found to be similar to the ground-truth data obtained from Regional Household Travel Survey.
Kurkcu, Ozbay, Morgul 1
INTRODUCTION and MOTIVATION
2 3 4 5 6 7 8 9 10
Human mobility have impacted the evolution and sprawl of land use and transportation, which in return results in various configurations of human travel. This mutually dependent relationship embodies urban forms and functions (1). Travel behavior data plays a substantial role in urban planning, transportation studies, and traffic operational applications. Traditionally, this data are collected using trip-diary surveys. The expeditious advancements in communication networks and the introduction of location-based services in smartphone applications have triggered extensive research efforts in the area of location determination. The new data sources have become potential substitutes, supplemental and/or complementary means to traditional trip behavior data to study large-scale human trip behavior patterns (2; 3).
11 12 13 14 15 16 17
Location-based services (LBS) such as Facebook Places, Foursquare, Twitter, Gowalla and real-time social networking sites like Twitter and Facebook provide researchers with rich and more accurate information about human activities. Every day, millions of people share their location information publicly on social networking applications. The data provide valuable source of information for human mobility and activity patterns, and can be spatially and temporally identified using the Application Programming Interfaces (APIs) offered for thirdparty application developers..
18 19 20 21 22 23 24 25 26 27 28 29 30 31 32 33 34
This study aims to discover human mobility and activity patterns and compare trip characteristics of different counties in the New York City (NYC) region. The research presented in this paper is based on data obtained from Twitter, one of the most popular social media networking sites, with over 300 million monthly active users. 80% of Twitter’s active users utilize its mobile application and they send around 500 million, 140 characters long, tweets every day (4). Twitter is a public platform that provides open data. In addition, it creates an environment for researchers to study the collective rather than individual human behavior patterns (5; 6). Interestingly, although Twitter had an incredible growth in the past, it is experiencing higher dropout rates compared to other social media networks (7). The Twitter Streaming API allows users to retrieve at most a 1% sample of all its incoming data. However, in order to use tweets to study travel patterns of people, there is a need to filter out tweets that are not geo-tagged. In other words, we do not need to access all the tweets. Thus, we filtered the general stream by geo-location and tweets enhanced with accurate geographic coordinates provided by either GPS-enabled smart devices or the internet protocol address of a computer are utilized . These spatially located tweets also constitutes approximately 1% of the total Twitter stream. Therefore, the number of geo-located tweets retrieved in this research can be considered satisfactorily close to the total number of tweets containing location information posted by users.
35 36 37 38 39 40
Our main motivation in this paper is to test the validity of geo-located Twitter data as a source for human mobility and activity patterns using the above described data. We will focus on home-to-work trips since these are one of the most common and important trip patterns in human mobility. The contribution of this paper is to propose a novel approach using a density based clustering algorithm to assign users to counties. This allows the identification of likely trip origin points of individuals and making it convenient to define person trips. If we can 3
Kurkcu, Ozbay, Morgul 1 2 3 4 5 6 7
demonstrate the usefulness of Twitter data in identifying these trips then an important, inexpensive and ubiquitous data source will be available to decision-makers in addition to other sources such as surveys and interviews. First, related past work is reviewed in the following section. Then, the study data set, clustering algorithm, and a method to find users’ likely origins are presented. Next, county-to-county travel in NYC and the intra-city mobility patterns are explored. Finally, the results are validated against the NYMTC regional household travel survey and general models of human mobility.
8
RELATED WORK
9 10 11 12 13 14 15 16 17 18
The advances in the sustainable mobility solutions require new travel demand data collection techniques besides the long term static planning data that is mostly collected by transportation planning agencies. Foursquare, Gowalla, and Facebook offer location sharing services that support millions of users who leave digital footprints every time they use these location sharing services. Therefore, it provides an opportunity to research the spatial and temporal characteristics of how people travel and how they use these services in their daily lives. This information have potential to be used to model patterns of human mobility in the future for traffic forecasting, urban planning, as well as epidemiological models of the spread of diseases (8). Analyzing publicly available location based social media resources has contributed to deeper inquiries into questions posed by planners, engineers, and others.
19 20 21 22 23 24 25 26 27 28 29 30 31 32 33 34 35 36 37 38
One of the most common ways to evaluate human activity patterns is to leverage social media networks’ publicly available check-in data (9). Yang et al. (10) proposed a novel method for Origin-Destination (OD) estimation that employs the LBS check-in data provided by Foursquare. Their methodology utilized a combined clustering, regression, and gravity model to estimate OD matrix for non-commuting trips based on data collected in the Chicago urban area. The comparison between traditional OD estimation methods and location based social networking (LBSN) data showed that the latter have real-time feeds and much bigger sample size that comes with lower cost. Liu et al. (11) evaluated nationwide inter-urban movements within 370 cities in China from social media check-in data-set covering half a million individuals. They used the gravity model to fit the observed spatial interactions and attempted to exhibit the underlying effect of the distance in the trips gathered from check-in data-set. The implications of the distance decay effect was also analyzed. They found out that the displacements follow an exponential distribution and movement can be fitted by the gravity model. Carrasco et al. (12) presented a data collection method intended to integrate the social dimension in social activitytravel behavior by analyzing the connection between individuals’ social activities and their social networks. The fundamental goal of data collection is to produce a dataset that can assist to examine the effect of social networks in different aspects of social activities including their generation, spatial distribution, and relationship with information communication technology (ICT). This study points out how aggregated measures of social networks and interaction attributes can shed a light on travel behavior.
39 40
Cho, Myers and Leskovec (13) utilized a combination of large datasets: check-in data from Gowalla and Brightkite, and cell phone location data. They found out that people undergo a 4
Kurkcu, Ozbay, Morgul 1 2 3 4 5 6
mixture of both geographically limited periodic movements and random jumps correlated with their social networks. According to the research, humans’ periodic travel in short ranges is not affected by social network ties. On the other hand, social relationships can influence longdistance travel. The study exhibited that 10% to 30% of all human movement is due to social relationships, while periodic travel constitutes 50% to 70%. They presented a model that predicts the locations and dynamics of future movements.
7 8 9 10 11 12 13 14 15 16 17 18 19
Most research in this area has utilized quantitative measures of census data, check-in data provided by location based social networks, and cell phone data. However, very few studies utilized the long-term collected Twitter data for estimating disaggregate human mobility and activity patterns in metropolitan cities. Researchers often use short-term collected Twitter messages to make investigations on their work. In most cases, these sample sizes have been limited by the availability and storage capacity. To evaluate the representativeness of the sample datasets provided by Twitter, Wang, Callan and Zheng (14) collected 400 million tweets per day and performed comparative analysis. They found out that different sample sizes from Twitter stream API preserve the same scaling behavior and it is possible to capture important tweet contents with smaller sample sizes. In addition, our study only utilizes geo-located tweets, which is usually below the sampling rate limit applied by Twitter. In other words, the dataset used in this current paper represents the actual number of geo-located tweets posted by users, not a sample subset of it.
20 21 22 23 24 25 26 27 28 29 30 31 32 33 34 35 36
Hawelka et al. (5) analyzed geo-referenced tweets to discover global patterns of human mobility. They estimated the volume of international travelers based on their home location. Approximately one billion geo-located Twitter status messages were used. Mobility profiles of different nations, radius of gyration, inflow-outflow balance, and diversity of destinations were examined. The results are validated against global tourism statistics. The authors argued that Twitter is an authentic and beneficial tool for understanding and analyzing mobility patterns at a global scale. Lenormand et al. (15) identified Twitter messages posted from roads and rails in Europe and computed the ratio of tweets that are posted on the road to the total number of tweets in 39 countries. This ratio varies from country to country and they argued that this difference can be explained by the penetration rate of Twitter as well as cultural factors. In addition, they analyzed the relationship between the number of tweets posted on the road and the Average Annual Daily Traffic (AADT) and found a positive correlation between two. Coffey and Pozdnoukhov (16) presented an approach that uses Twitter and CapitalBikeShare data to increase the reliability of semantic annotation of mobility flows. Their research utilized geo-located social media data to understand trip purposes and user activity locations, and historical bike flow data to analyze the mobility patterns. However, their study lacks ground truth data, a dataset containing bike trips with known trip purposes, which might be used to verify their approach.
37 38 39 40 41
Recently, Wang and Taylor (17) introduced an approach to collect mobility data using Twitter Streaming API to develop a process map. They utilized a one-month data for the NYC area to confirm that Twitter is a reliable source for analyzing human mobility at the city level. Results from the study agreed with the previous studies. However, their results were only compared to the findings from previous studies and not to the ground truth data such as travel 5
Kurkcu, Ozbay, Morgul 1 2 3 4 5 6 7 8 9 10 11
surveys. On the other hand, Gao et al. (2) evaluated the credibility of identifying trips from geolocated tweets in comparison with American Community Survey data. They investigated the spatiotemporal flow patterns and whether a month long Twitter data would yield reasonable results compared with large-scale studies. The research concluded that their approach can be used to estimate aggregated mobility flows on weekdays. There are similar studies in the literature that study the use of short-term geo-referenced Twitter messages for extracting aggregated travel patterns (18). On the other hand, Hasan and Ukkusuri (19) analyzed large-scale Twitter data to infer disaggregate travel patterns. They proposed a data driven modeling approach that extracts multi-day patterns of individual activities utilizing the information shared in social media. Their model accounts for missing activities and delivers an activity generation process that can constitute a beneficial part of an activity-travel simulator.
12 13 14 15 16 17 18 19 20 21 22 23
In the absence of geo-location information of the Twitter data, Cheng, Caverlee and Lee (20) suggested a probabilistic framework for estimating users’ location only depending on the semantic analysis of users’ tweets in cities. Their methodology estimated a number of potential locations for each user with respect to confidence level. The study concluded that it can place 51% of Twitter users within 100 miles of their actual locations. Although numerous studies used geo-located Twitter messages to detect events, a comparative study of event detection algorithms is usually avoided. One of the reasons for this lack of comparative evaluation is that evaluating the performance itself is a challenging process. Weiler, Grossniklaus and Scholl (21) applied a series of comparison measures to the state-of-the art event detection techniques. Their study showed that the measures such as run-time performance, duplicate event detection rate, and precision were able to differentiate between different techniques and provide relative comparisons.
24 25 26 27 28 29 30
Lenormand et al. (22) performed the comparison of the results obtained using different data sets including Twitter, census, and cell phones. The research is focused on the urban areas of Barcelona and Madrid. The correlation between the data-sets is investigated in terms of different aspects such as the spatial distribution of human concentration, the temporal evolution of human density, and human mobility patterns. It is found that different these data sources can be used to generate comparable information. Therefore, they concluded that it is possible to use three data sources interchangeably considering respective spatio-temporal scales.
31
DATA
32
Data Collection and Processing
33 34 35 36 37 38 39 40
The Twitter stream using API services is first filtered for tweets that contain geo-location information and then the algorithm checks if the location of a tweet falls in the boundaries of the study. The Twitter data used in this paper is collected using the same approach explained in Kurkcu et al. (23) for geo-located tweets through Twitter Streaming API (24). FIGURE 1 exhibits the study boundaries including 5 counties of NYC and some parts of New Jersey. The dataset contains Twitter status updates posted in the NYC area between the dates of January 22, 2015, and June 30, 2015. It consists of 6,512,665 geo-tagged tweets generated by 306,162 unique users. Prior to the usage of this dataset, another filter is applied to remove Twitter bots, accounts 6
Kurkcu, Ozbay, Morgul 1 2 3 4 5 6 7 8 9 10
reporting news, incidents and advertising etc. from the existing user list to avoid noises when calculating mobility statistics. The public data obtained from twitter is encrypted and user specific information is not accessible. The displacements, distance between consecutive tweet locations, for all users are calculated. If the calculated distance is larger than 30 miles, which will fall out of the study area limits, then the user is excluded from the data set. Finally, 10,979 users are selected based upon detection that they have posted tweets containing geo-location information of at least two distant locations, and they are active Twitter users by posting at least 100 tweets over 6 months. Tweets posted by these users on weekdays are then used to find the most visited locations using a clustering algorithm which is described in detail in the next section.
11 12
FIGURE 1: The Study Area Boundaries
7
Kurkcu, Ozbay, Morgul 1 2 3 4 5 6 7 8 9 10 11 12 13 14 15 16 17 18
METHODOLOGY Majority of the existing Twitter studies did not attempt to discover users’ trip origins. They mostly illustrate a study area by merely focusing on the number of tweets observed in that region and consider that as the origin of users’ trips (5). However, users can send location updates at their work and activity locations as well as when they travel, that may bias human mobility and activity analysis. In order to find the likely origin of a user, a data clustering algorithm called the Density Based Spatial Clustering of Applications with Noise (DBSCAN) is used in this study (25). The algorithm requires two different parameters called: epsilon (Eps), the maximum distance between two samples to be considered as in the same neighborhood and the minimum number of points (MinPts) in a neighborhood for a point to be considered as a core point. This procedure is shown in FIGURE 2. It starts with a random starting point and then its neighborhood defined with a distance of “epsilon” from its current location is discovered. If this neighborhood holds adequately many points, it is defined as a cluster, else, it labels this point as noise. The selection of the value of epsilon is crucial because if it is too large then all points in the data set will have the same density. On the contrary, if “epsilon” is too small, the density of each cluster will be 1. The pseudo-code for this algorithm is shown below. # Main Algorithm DBSCAN(Dataset, ε, MinPts) Cluster_Label = 0 for each point p in Dataset mark p as visited NeighborPts = discoverNeighborhoods(P, ε) if sizeof(NeighborPts) < MinPts mark p as NOISE Cluster_Label = Cluster_Label else Cluster_Label = Cluster_Label+1 expandCluster(p, NeighborPts, Cluster_Label, ε, MinPts) # Function to expand clusters expandCluster(p, NeighborPts, Cluster_Label, ε, MinPts) add p to Cluster_Label for each point p' in NeighborPts if p' is not visited mark p' as visited NeighborPts' = discoverNeighborhoods (p', ε) if sizeof(NeighborPts') >= MinPts NeighborPts = NeighborPts joined with NeighborPts' if p' is not yet member of any cluster add p' to Cluster_Label
8
Kurkcu, Ozbay, Morgul 1 2 3
The value of epsilon is selected as 0.0125, corresponding approximately to 0.5 mile radius and the parameter MinPts is set to 4, as suggested by Ester et al. (25), for all clusters in the spatial database.
4 5
FIGURE 2: DBSCAN Clustering Algorithm
6 7 8
This algorithm is used to find the most visited locations from the dataset and results of previous tests are routinely recorded. The most visited location is assumed to be user’s origin location. To illustrate with an example, FIGURE 3
9 10 11
a shows clusters based on the number of tweets posted by the user at the same location. The clusters without numbers can be considered as noise meaning that the user visited that location only once. FIGURE 3
12 13 14 15
b depicts the results of the DBSCAN algorithm. The colored circles are the discovered density locations and the black dots are the noise. The clustering approach estimated the significant cluster locations and the noise accurately and this test carried out for multiple different users.
9
Kurkcu, Ozbay, Morgul
FIGURE 3 a) The Number of Tweets Posted by a random User
b) DBSCAN Clusters
1 2 3 4 5 6 7 8 9
It is possible to get several most visited locations using the DBSCAN algorithm. Each density has a weight representing the number of points it contains. The times spent at the density location is checked by looking at the number of tweets posted at home between 12:00 AM and 6:00 AM. In addition, to verify it is the origin of the user’s trips, the location of the tweets containing keywords such as “home”, ”TV” and “sleep” are compared to the cluster location. If all these conditions are met, the strongest density is selected as the origin of a home-to-work trip of a user. Twitter allows users to provide their place upon registration. Most users present their home county. The accuracy of the detected home locations is validated against the user stated home location on Twitter and users’ twitter posts giving insight to their likely home locations.
10 11 12 13 14 15 16 17
FIGURE 4 gives an insight to the temporal distribution of people during the day in NYC. It exhibits the total number of initial densities detected per user using the DBSCAN algorithm. Densities are plotted in each census tract for 5 different periods of the day that are defined in the NYMTC regional household survey (26). The data clustering algorithm can estimate more than one density location for each user, however, this figure only shows the strongest densities containing the most number of tweets. It can be clearly seen that from 6:00 AM to 8:00 PM clusters are gathered together mostly in Manhattan. In addition, smaller number of densities are detected and they are more evenly distributed between 12:00 AM and 6:00 AM.
10
Kurkcu, Ozbay, Morgul
06:00 AM – 10:00 AM
10:00 AM – 04:00 PM
08:00 PM – 12:00 AM
12:00 AM – 06:00 AM FIGURE 4: Temporal Distribution of Clusters
11
04:00 PM – 08:00 PM
Kurkcu, Ozbay, Morgul 1
RESULTS
2 3 4 5 6 7 8 9
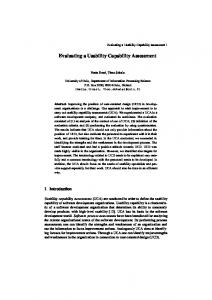
In order to evaluate mobility measures, most studies have focused on the analysis of the user displacement and radius of gyration and attempted to estimate their distribution by a power law. A similar approach has been used in this paper. In addition, estimated human mobility patterns are compared to the regional household travel survey. The spatial distribution of Twitter users is uneven and there is a bias toward users with higher incomes and advanced degrees of education. However, 63% of all New Yorkers use smart phones and according to U.S. Census Bureau the median household income is $58,003 (27; 28). Therefore, NYC serves as an optimal test bed for investigating the usability of Twitter data to gather mobility statistics.
10
User Displacement
11 12 13 14 15 16 17
The distance-based displacement of consecutive Twitter messages is investigated in this section. Analyzing displacements between selected users’ consecutive tweets resulted in 2,911,730 values representing the travel distance between successive tweets. Displacement values larger than 30 miles and lower than 0.1 miles are avoided due to the limits of the study area not to misrepresent travel patterns. The distribution of displacements is plotted on a log-log scale as shown in FIGURE 5, to compare our results with the previous studies’ estimated coefficients. In the literature, this trend is commonly estimated by a power-law:
P(d ) d 18 19 20
21 22
where : The displacement between consecutive tweets d : Estimated exponent
FIGURE 5: Frequency of Displacement
12
(1)
Kurkcu, Ozbay, Morgul 1 2
Equation 1 suggests that human mobility follows a Lévy Flight in which the movements have a heavy tailed probability distribution (29). The estimated value of =1.723 is similar to
4 5 6
the results obtained in the different studies using various datasets. The obtained value of exponent using other mobility datasets such as mobile phone, bank note dispersal, Foursquare check-in and Twitter data falls in the range between 1.09 and 1.88 in the existing studies (5; 8; 17; 29; 30).
7
Radius of Gyration
3
8 9 10 11 12 13 14 15
The radius of gyration is the standard deviation of distances between tweets and the user’s likely home location. It is analyzed for each user in the study. Most studies utilized the user’s center of mass to evaluate the standard deviation of distances. However, the estimated origin location of a home-based work trip is adopted in this approach. Each user’s strongest density location containing the most points is taken as a likely home location and the standard deviation of distances between tweets and the user’s home location is calculated. Usually, a low radius of gyration demonstrates users who travel shorter distances, while a high radius of gyration exhibits users with longer distance trips (8). The radius of gyration can be formulated as:
rg 16 17 18 19
20 21
1 n (ri rh )2 n i1
where: n : the number of tweets ri : the location of the tweet i rh : the home location
FIGURE 6: Frequency of the Radius of Gyration
13
(2)
Kurkcu, Ozbay, Morgul 1 2 3 4 5 6 7 8
A python package called geopy which is an implementation of Vincenty’s solution to the inverse geodetic problem (31) is used to find the distance between a tweet and likely home locations . This library is based on the latest revision of the World Geodetic System (WGS 84) reference ellipsoid (32). The frequency of the radius of gyration can be seen in FIGURE 6. It is also estimated by a power law with =2.559 and R 2 =0.9319. Cheng et al. (8) plotted the mean radius of gyration on a map to show how it can give further information about the dynamics of different cities. FIGURE 7 shows a similar plot that is made for the radius of gyration distances of 100 randomly selected users with minimum 0.9 and maximum 17.01 miles.
9 10
FIGURE 7: Radius of Gyration for 100 Random Users
11 12 13 14
It can be seen that lower radius of gyration values can be observed closer to the NYC area indicating that people prefer to travel shorter distances that mostly start and end within the same county. The next section examines the county-to-county travel more in depth and reviews human activity and mobility patterns at the county level.
15
County to County Travel
16 17 18 19 20 21 22
The structure of the county-to-county travel is analyzed utilizing the consecutive tweets representing user trip behavior and results are compared to the New York Metropolitan Transportation Council (NYMTC) and North Jersey Transportation Planning Authority’s jointly sponsored (NJTPA) 2010/2011 Regional Household Travel Survey (RHTS) (26). The survey area contains five boroughs of NYC: Manhattan, Queens, Bronx, Brooklyn (Kings), and Staten Island (Richmond) (26). The survey response rate was 59.1% with 10,136 Households in the New York State area. This number went down to 5,766 in the NYC region. Every displacement 14
Kurkcu, Ozbay, Morgul 1 2
of users within the same day that is bigger than 0.1 mile is considered as a trip using the collected Twitter dataset.
3 4 5 6 7
Assigning users to likely home locations gave an opportunity to evaluate the travel patterns within the counties. FIGURE 8 exhibits the results from the trip analysis. It can be seen that 70.15% of all users travel within their home counties. The trips that were ended out of the study area are combined under the same label, “To Other County”, which represents 5.45% of all trips. It also showed 14.12% of all trips were destined to Manhattan from other counties.
5.45%
14.12%
Within County To Manhattan
10.28%
To Other NYC 70.15%
To Other County
8 9
FIGURE 8: The Distribution of All Weekday Trips for NYC
10 11 12 13 14 15 16 17 18 19
While calculating trip rates per person, to account for the days when users do not post a tweet and report their locations, the number of estimated trips is divided by the number of days a user is actually tweeted, instead of the length of the Twitter data collection period. It is possible to find intra and inter county travel by aggregating trips by counties. Table 1 shows the comparison of trip rates, average trip distances in Manhattan and other counties between the Twitter data and RHTS findings. The RHTS trip rates are adjusted for under-reporting of trips utilizing the GPS portion of the survey. The results are similar, although, the twitter data shows that people in Manhattan tend to make shorter trips compare with the other counties which is not observed in the RHTS data. The detected trips from the Twitter dataset is spatially aggregated to the county level. FIGURE 9 summarizes the spatial distribution of mobility flows.
20
Table 1: Comparison of Trip Measures between the RHTS and Twitter RHTS 15
Twitter
Kurkcu, Ozbay, Morgul Trip Rate per Person Average Trip Distance – Manhattan (Miles) Average Trip Distance - Other Counties (Miles)
4.0 4 .3 3.5
3.7 3.1 4.2
1 2
FIGURE 9: The Distribution of Mobility Flows
3 4 5 6 7 8
TABLE 2 shows the distribution of detected trips for five counties. Interestingly, intercounty and intra-county flow patterns estimated from the Twitter dataset for Manhattan showed a really good match with the RHTS data related to the mobility flows. However, results for other counties are slightly different than the survey data, especially flows going towards Manhattan. One of the reasons for this difference may be that the survey data collected for a longer period which is between September 2010 and November 2011.
9
TABLE 2: The Comparison of All Weekday Trips in NYC between RHTS and Twitter Data Source
Trip Origin
Manhattan
Within County
To Adjoining County (Not NYC)
To Manhattan
To Other NYC
To Other Counties
74.0%
**
**
17.4%
8.6%
16
Kurkcu, Ozbay, Morgul Other New York City Manhattan Other New York City 1
81.8% 73.8 % 66.6%
2.4% ** 2.6%
8.3% ** 20.4%
4.9% 20.7% 7.6%
2.6% 5.5 % 2.8%
CONCLUSION
2 3 4 5 6 7 8 9 10 11 12 13
The inter-dependence of human mobility and civil infrastructure influence urban development in cities. Consequently, analyzing, quantifying, and predicting human mobility flows in urban areas are extremely valuable requirements for policy making, transportation, evacuation and epidemic control. Twitter is one of the public and easy to collect data sources that reveal spatial and temporal aspects of human activity and mobility patterns. Although, the spatial distribution of Twitter users is uneven and there is a bias toward users with higher incomes and advanced degrees of education, this study demonstrated that, geo-located tweets can be considered as a valuable source of information for human activity and mobility. Identifying users’ strongest density clusters allowed us to understand the recurring travel patterns of individuals which can be studied in a finer spatial level in the future. In conclusion, it was possible to capture and compare mobility profiles of individual counties, travel patterns of individuals, average trip rates and trip distances using the Twitter data.
14 15 16 17 18 19 20 21 22 23 24 25 26 27 28 29
Furthermore, the results are validated against the NYMTC household survey and commonly used evaluation methods of human mobility (5). The displacement between consecutive tweets and the radius of gyration from user’s recurring origin locations are estimated by a power law and the results are found to be similar to the previous studies. In addition, the Twitter data revealed that while New Yorkers tend to travel shorter distances in Manhattan, they choose to travel longer distances in other counties. The average trip rate per person is 3.7 miles with a distance of 3.1 miles in Manhattan and 4.2 miles in other counties. This can be explained by the 20.4% of users traveling from their home county to Manhattan, making longer trips, even though it is different than the results obtained from the RHTS. The flow patterns gathered from the RHTS showed a satisfactory match with the estimated flows using the Twitter data. However, while estimated trips originating from Manhattan to other counties is lower, Twitter data revealed that more users traveled to Manhattan from other counties compare to the RHTS. This difference might be due to the bias in Twitter data, availability of users in Manhattan, data collection period, seasonal mobility patterns, and any other special event driven travel patterns. Additional analyses about identifying these patterns can be carried out using a larger twitter dataset in the future.
30 31 32 33 34 35
It is also shown that the Twitter data show similar statistical properties as other mobility datasets such as cell phone data and check-in data reported in the literature (5; 8; 22; 29). The power law distribution estimations of radius of gyration and displacement exhibited similar results. This study proves that geo-located Twitter can be considered as a potential valuable data source to understand human mobility and activity patterns in metropolitan areas containing higher number of Twitter users compare to the rural areas like NYC.
36
ACKNOWLEDGMENTS AND DISCLAIMER
17
Kurkcu, Ozbay, Morgul 1 2 3
The contents of this paper only reflect views of the authors who are responsible for the facts and accuracy of the data and results presented herein. The contents of the paper do not necessarily reflect the official views or policies of sponsoring agencies.
4
18
Kurkcu, Ozbay, Morgul 1 2 3 4 5 6 7 8 9 10 11 12 13 14 15 16 17 18 19 20 21 22 23 24 25 26 27 28 29 30 31 32 33 34 35 36 37 38 39 40 41 42 43 44 45 46
REFERENCES [1] Guiliano, G. Land Use Impacts of Transportation Investments-Highway and Transit. 2004. [2] Gao, S., J.-A. Yang, B. Yan, Y. Hu, K. Janowicz, and G. McKenzie. Detecting Origin-Destination Mobility Flows From Geotagged Tweets in Greater Los Angeles Area. [3] Morgul, E., H. Yang, A. Kurkcu, K. Ozbay, B. Bartin, C. Kamga, and R. Salloum. Virtual Sensors: WebBased Real-Time Data Collection Methodology for Transportation Operation Performance Analysis. Transportation Research Record: Journal of the Transportation Research Board, No. 2442, 2014, pp. 106116. [4] https://about.twitter.com/company. Accessed June 26, 2015. [5] Hawelka, B., I. Sitko, E. Beinat, S. Sobolevsky, P. Kazakopoulos, and C. Ratti. Geo-located Twitter as Proxy for Global Mobility Patterns. Cartography and Geographic Information Science, Vol. 41, No. 3, 2014, pp. 260-271. [6] Kocatepe, A., J. Lores, E. E. Ozguven, and A. Yazici. The Reach and Influence of DOT Twitter Accounts: A Case Study in Florida. Presented at 18th IEEE International Conference on Intelligent Transportation Systems, Canary Islands/ Spain, 2015. [7] Coursaris, C. K., Y. Yun, and J. Sung. Twitter Users vs. Quitters: A Uses and Gratifications and Diffusion of Innovations approach in understanding the role of mobility in microblogging.In Mobile Business and 2010 Ninth Global Mobility Roundtable (ICMB-GMR), 2010 Ninth International Conference on, IEEE, 2010. pp. 481-486. [8] Cheng, Z., J. Caverlee, K. Lee, and D. Z. Sui. Exploring Millions of Footprints in Location Sharing Services. ICWSM, Vol. 2011, 2011, pp. 81-88. [9] Bawa-Cavia, A. Sensing the Urban: Using Location-based Social Network Data in Urban Analysis.In Pervasive PURBA Workshop, 2011. [10] Yang, F., P. J. Jin, Y. Cheng, J. Zhang, and B. Ran. Origin-Destination Estimation for non-commuting Trips Using Location-based Social Networking Data. International Journal of Sustainable Transportation, Vol. 9, No. 8, 2015, pp. 551-564. [11] Liu, Y., X. Liu, S. Gao, L. Gong, C. Kang, Y. Zhi, G. Chi, and L. Shi. Social Sensing: A New Approach to Understanding Our Socioeconomic Environments. Annals of the Association of American Geographers, No. ahead-of-print, 2015, pp. 1-19. [12] Carrasco, J. A., B. Hogan, B. Wellman, and E. J. Miller. Collecting Social Network Data to Study Social Activity-Travel Behavior: An Egocentric Approach. Environment and planning. B, Planning & design, Vol. 35, No. 6, 2008, p. 961. [13] Cho, E., S. A. Myers, and J. Leskovec. Friendship and Mobility: User Movement in Location-based Social Networks.In Proceedings of the 17th ACM SIGKDD international conference on Knowledge discovery and data mining, ACM, 2011. pp. 1082-1090. [14] Wang, Y., J. Callan, and B. Zheng. Should We Use the Sample? Analyzing Datasets Sampled from Twitter’s Stream API. ACM Transactions on the Web (TWEB), Vol. 9, No. 3, 2015, p. 13. [15] Lenormand, M., A. Tugores, P. Colet, and J. J. Ramasco. Tweets on the Road. 2014. [16] Coffey, C., and A. Pozdnoukhov. Temporal Decomposition and Semantic Enrichment of Mobility Flows.In Proceedings of the 6th ACM SIGSPATIAL International Workshop on Location-Based Social Networks, ACM, 2013. pp. 34-43. [17] Wang, Q., and J. E. Taylor. Process Map for Urban-Human Mobility and Civil Infrastructure Data Collection Using Geosocial Networking Platforms. Journal of Computing in Civil Engineering, 2015, p. 04015004. [18] Hochmair, H., and S. Cvetojevic. Assessing the Usability of Georeferenced Tweets for the Extraction of Travel Patterns: A Case Study for Austria and Florida. GI_Forum, 2014, pp. 30-39.
19
Kurkcu, Ozbay, Morgul 1 2 3 4 5 6 7 8 9 10 11 12 13 14 15 16 17 18 19 20 21 22 23 24 25 26 27 28
[19] Hasan, S., and S. V. Ukkusuri. Urban Activity Pattern Classification using Topic Models from Online Geo-location Data. Transportation Research Part C: Emerging Technologies, Vol. 44, 2014, pp. 363-381. [20] Cheng, Z., J. Caverlee, and K. Lee. You are Where You Tweet: A Content-based Approach to Geolocating Twitter Users.In Proceedings of the 19th ACM international conference on Information and knowledge management, ACM, 2010. pp. 759-768. [21] Weiler, A., M. Grossniklaus, and M. H. Scholl. Evaluation Measures for Event Detection Techniques on Twitter Data Streams.In Data Science, Springer, 2015. pp. 108-119. [22] Lenormand, M., M. Picornell, O. G. Cantú-Ros, A. Tugores, T. Louail, R. Herranz, M. Barthelemy, E. Frías-Martinez, and J. J. Ramasco. Cross-checking Different Sources of Mobility Information. 2014. [23] Kurkcu, A., M. Eng, E. F. Morgul, and K. Ozbay. Extended Implementation Methodology for Virtual Sensors: Web-based Real Time Transportation Data Collection and Analysis for Incident Management.In Transportation Research Board 94th Annual Meeting, 2015. [24] Twitter Streaming API. Twitter. https://dev.twitter.com/streaming/overview. Accessed Jan 22, 2015. [25] Ester, M., H.-P. Kriegel, J. Sander, and X. Xu. A Density-based Algorithm for Discovering Clusters in Large Spatial Databases with Noise.In Kdd, No. 96, 1996. pp. 226-231. [26] 2010/2011 Regional Household Travel Survey Final Report.In, New York Metropolitan Transportation Council and New Jersey Turnpike Administration, 2014. p. 183. [27] Cell Phones Used by 90 Percent of New Yorkers; Smartphones Used by Nearly Two-Thirds.In, Siena Research Institute, 2015. [28] http://quickfacts.census.gov/qfd/states/36000.html. Accessed November 14, 2015. [29] Brockmann, D., L. Hufnagel, and T. Geisel. The Scaling Laws of Human Travel. Nature, Vol. 439, No. 7075, 2006, pp. 462-465. [30] Gonzalez, M. C., C. A. Hidalgo, and A.-L. Barabasi. Understanding Individual Human Mobility Patterns. Nature, Vol. 453, No. 7196, 2008, pp. 779-782. [31] Vincenty, T. Geodetic Inverse Solution between Antipodal Points. Richard Rapp Geodetic Science Ohio State University, 1975. [32] geopy. https://pypi.python.org/pypi/geopy. Accessed Jun 24, 2015.
29
20