we may mention (Steele, 2002). The rest of the .... other prototypes. (Bristow, 2002) proposed two contextually- ... The Guided Tour guides the user through the.
EVALUATING THE USERS’ EXPERIENCE OF A PDA-BASED SOFTWARE APPLIED IN ART MUSEUMS R. Tesoriero, M. Lozano, J. A. Gallud and V. M. R. Penichet Laboratory of User Interaction and Software Engineering Department of Computer Systems. University of Castilla-La Mancha. Albacete, Spain [ricardo, mlozano, jgallud, vpenichet]@dsi.uclm.es
Keywords:
Mobile technology, Art Museums, Usability testing, PDA.
Abstract:
Mobile devices as smartphones or PDAs are common in our daily life. Museums and art galleries provide electronic guides in order to do more pleasant a visit or exhibition. The problem tackled in this paper is to prove the suitableness of using a PDA, instead of the traditional guides. In this case an application was specially developed to provide users that are visiting the museum additional information and help. It is interesting to know how to adapt these devices to guide and improve visitors’ experience. Moreover, we have to take into account that technology should not be the centre of attention in art museums or exhibitions, but it should be unperceivable. Thus, in this paper, we describe an evaluation of a real system deployed in an emblematic museum in Spain, called Cutlery Museum of Albacete. Our approach offers visitors a PDA that employs a wireless network to show additional information about old knives, jack-knives and scissors which are exhibited in the museum. In this way, art and technology are combined with success. The system supports four languages and incorporates special functions for disabled people. This article shows the users’ satisfaction results collected during the last 18 months. These results lead to a detailed analysis suggesting some improvements for future versions of the software.
1
INTRODUCTION
The application of mobile technologies to Museums and exhibition environments in general has been an area of special research interest in the last years. Particularly, the use of wireless networks has improved considerably this new way of accessing information in a ubiquitous way within these environments. Undoubtedly, these emerging technologies can be used to enhance interactivity among museum visitors. Concretely, in the city of Albacete, Spain, there is a museum dedicated to exhibit valuable and very antique cutlery pieces. This is the scenario in which we have implemented these new technologies to improve visitors’ experience when visiting this concrete museum. Interaction improvements in museum exhibits using augmented artefacts are proposed in (Ciolfi and Bannon, 2002). These improvements are usually performed by experts in the area (students volunteers, docents, etc.) We think that these improvements may be provided in some degree by an electronic device.
The system developed (Gallud et al., 2005) and currently running in the Cutlery Museum of Albacete has been designed to provide guidance to visitors, and to show additional information about the exhibited pieces, as well as other stored pieces that are not physically available for the public. The system has been running for 18 months, and during this period several tests to measure the users’ satisfaction and opinion about the new system have been performed. In this paper we show the results of experiments carried out with real users and extract some conclusions from these results to improve the system. As antecedent of HCI electronic guides test we may mention (Steele, 2002). The rest of the paper is structured as follows: Firstly, we present the state of the art in the field of new technologies applied to improve users’ experience in art museums and exhibitions. Then, we describe the software architecture of the system and the evolution stages from the initial to the current specifications. As mentioned before, we are working with a real system running in the Cutlery Museum of Albacete and, at the same time, we are defining a new system
351
WEBIST 2007 - International Conference on Web Information Systems and Technologies
in our HCI laboratory. In this way, the evaluation of the user experience is used to improve the system under development. Next, we describe three system evaluation experiments performed on three different groups of people, using the same evaluation survey. We have followed the CIF (Common Industry Format for Usability Reports) standard defined by the ISO/IEC DTR 9126-4. These groups of people have been defined according to the following parameters: age, technology expertise and general public. After the experiment description we expose the collected data and the results of this analysis. We finish the paper with some conclusions and final remarks as well as future actions. As a conclusion of our work, we show that the use of PDAs in art museums may improve users’ experience and increase the overall satisfaction of different visitors. This research also revels that it is necessary to make an additional effort to turn the software client for PDA into a real good tool rather than an obstacle between the visitor and the exhibition. Some of the conclusions extracted from this work will be applied in the definition of a new system.
2
THE USE OF NEW TECNOLOGIES IN ART MUSEUMS
People related to museums and libraries were focused on using electronic technology for more than 20 years. It started with electronic libraries and was enforced with the introduction of Web technologies. Web technologies offered new opportunities to open up the walls of the museum to the world (Schweibenz, 1999), an opinion shared by several researchers in the field (Dolgos, 1999), (Falk and Dierking, 1992, (Jackson, 1998), (McKenzie, 1998). A pioneer on this line was The Museum Educational Site Licensing Project. This project was from running January 1, 1995 until June 30, 1997. It was jointly launched by the Getty Art History Information Program and MUSE Educational Media. They were supported by the Association of Art Museum Directors, the American Association of Museums, and the Coalition for Networked Information. The goals of the project were the availability of museum images and related information delivered over computer networks for educational use and to show the value of digital media in the study of art and culture.
352
Another important initiative was the Art Museum Image Consortium. (AMICO)1 It was also a not-forprofit organization composed by 23 North American art museums that was founded in October 1997 and dissolved on June 2005. The aim of this consortium enabled the educational use of museum multimedia. Nearer to our days, the Virtual Museum of Canada2, launched in 2001, has an average of 500,000 visits a month to its half-million images (Green, 2004). Latest online examples are the MIA (Minneapolis Institute of Arts)3 and the Online Archive of California, known as OAC4. The last one, brings together historical materials from a variety of California institutions, including museums, historical societies, and archives. Over 120,000 images; 50,000 pages of documents, letters, and oral histories; and 8,000 guides to collections are available. Currently, a new step in communication and mobile technology seem to be leading the future of art galleries and museums applications to mobile applications. Mobile devices are becoming very common among people. Such devices are light and easy to use; these features combined with a decreasing price and a growing processing power turns these devices into a powerful tool to develop m-applications. Indoor and outdoor exhibitions may take advantage of mobile technology giving visitors the experience of new feelings about pieces. Augmented eality applications may be implemented providing multimedia extra information to the user. Information that is really difficult to present otherwise. A study involving a comparative evaluation of different platforms for augmenting museums and art galleries was presented as a part of (Baber, 2001). Prototypes of the application were developed for three different devices: a HMD (Head Mounted Display), a PDA and a Tablet. The results of the experience exposed that: • Effectiveness performance was higher in HMD and PDA than in Tablets. • Best attitude rating was obtained by PDA and HMD. In broad terms, PDA tended to outperform the other prototypes. (Bristow, 2002) proposed two contextuallyaware mobile systems; one suited to the indoor environment; and other one to the outside environment. The first one was based on IR technology; and the second one was implemented applying GPS technologies. An interesting approach was presented in (Ciavarella and Paternò, 2003) where infrared
EVALUATING THE USERS’ EXPERIENCE OF A PDA-BASED SOFTWARE APPLIED IN ART MUSEUMS
emitters were used to locate a user and provide him / her with Location-aware information. Improvements to original system were exposed in (Ciavarella and Paternò, 2004) too. The Cutlery Museum in Albacete (Spain) is an emblematic institution of the city that is currently using an electronic device (PDA) to guide visitors through the museum. (Gallud et al., 2005). A PDA connected to WIFI endpoint installed into the museum is used to retrieve information about pieces exhibited in the showcases. So people are able to get information in different languages, to follow predefined routes based on experts’ experience, and so on. Next section describes in more detail the main features of the system.
3
DESIGNING THE PDA-BASED SYSTEM
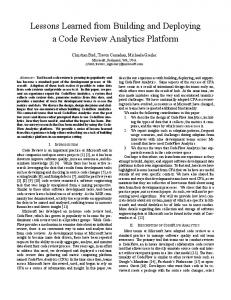
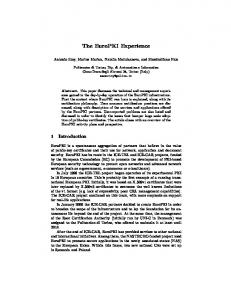
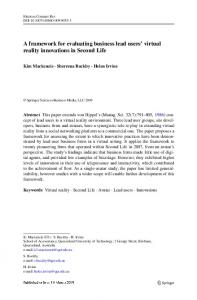
In this section we describe the system that is currently being used in a real scenario. Flash technology was used to get a high quality Graphic User Interface. The Application starts showing a presentation screen (see Figure 1). Afterwards, the user selects a language to interact with the PDA device (see Figure 2). And finally, the user chooses how to visit the museum (see Figure 3). There are four options available to visit the museum: 1. Guided tour 2. Recommended routes 3. Access to finder 4. Unguided tour The Guided Tour guides the user through the whole museum. It shows three controls: Previous, Next and Piece to navigate across the museum showcases (see Figures 4 and 5). The Recommended Routes mode was designed to guide users interested in specific subjects. Samples of these roads may be knives of XVII century or French scissors (see Figure 6). In order to provide a search engine, Access to Finder functionality is included into the system (see Figure 7). Users are capable of searching information by a piece or a showcase identifier (see Figure 8), or by author, typology or date (see Figure 9). Finally, Unguided Tour (see Figure 10) allows users to visit the museum without any guide. So they can freely navigate across the application to select any piece in the museum and retrieve information
about it. Information is not constrained to text only; but to images and audio too. Data is not bounded to piece only, because the user is able to perceive the context related to where the selected piece is exposed. Such space is organized in several screens: floors (see Figure 11), rooms (see Figure 12), showcases (see Figure 13) and pieces (see Figure 14).
4
EVALUATING THE USERS’ EXPERIENCE
In this section we describe the satisfaction evaluation we have performed with different groups of people. The experiment embraces three aspects of the application that will be evaluated to get the users’ experience satisfaction level: • Aspect 1: Graphic design and visual impact. • Aspect 2: General usability • Aspect 3: Concrete functionality (i.e. finding a showcase). The experiment was performed by two groups of users. Each group represents different user profiles. The main idea is to contrast results of both deployment scenarios. The first group of users was composed by people experienced in technical affairs; so they have some knowledge about the technology being used. However, the second group was composed by young students between 13-16 years old without any experience with PDA technology; so they are not influenced by daily use of this particular technology. To select groups of different profile, we performed the same experiment in two public events. Professionals belonging to the first group were contacted in a technological event called Feritec. Thus, from now and on, this group will be referred as FeritecGroup. The amount of people that filled FeritecGroup questionnaire was 75 (shown in Table 1). On the other hand, the second group was polled in the V Science Week. Thus, from now and on, this group will be referred as ScienceWeekGroup. 90 users filled the questionnaire described in Table 1 on ScienceWeekGroup. 1
http://www.amn.org/AMICO/ http://www.virtualmuseum.ca/ 3 http://artsmia.org/directories/ 4 http://www.oac.cdlib.org/ 2
353
WEBIST 2007 - International Conference on Web Information Systems and Technologies
Figure 1: Presentation screen.
354
Figure 2: screen.
Language
selection
Figure 3: Visit mode selection.
Figure 4: Guided tour.
Figure 5: Floor view.
Figure 6: Recommended tours.
Figure 7: Finder instructions.
Figure 8: Finder by characteristics.
Figure 9: Finder by identification.
EVALUATING THE USERS’ EXPERIENCE OF A PDA-BASED SOFTWARE APPLIED IN ART MUSEUMS
Figure 10: Unguided tour.
Figure 11: Floor view.
Figure 13: Showcase view.
Figure 14: Piece view.
The experiment was carried out using the same poll with both groups of people. This poll was designed to capture user feelings about aspects described above. It is composed by ten multiple choice questions and each question has six possible answers according to the user’s level of satisfaction. Questions and possible answers are shown in Table 1. Answers are ordered by level of satisfaction, considering the least satisfying on the left and the most satisfying on the right. Evaluation of the aspects related to users’ experience satisfaction are covered by these questions as follows: • Aspect 1 is expressed on questions 1, 2 and 3. • Aspect 2 is exposed in questions 4, 5 and 10. • Aspect 3 is covered by questions 6, 7, 8 and 9.
Figure 12: Room view.
To measure users’ experience satisfaction for a Question q the following formula is applied: (1) L
Sq = ∑ l =1
l xl ⋅ L N
Where: Sq: Satisfaction level of question q L: Amount of possible answers (in this case 6) xl: Amount of people that answered l in question q N: Amount of people that filled the questionnaire The results are shown in Figures 15 and 16 for FeritecGroup and ScienceWeekGroup respectively.
355
WEBIST 2007 - International Conference on Web Information Systems and Technologies
Table 1: Satisfaction Questionnaire.
Satisfaction Questionnaire 1
Do you like application design?
Not at all 2
No
It’s indifferent
Not bad
I like it
I love it
It’s indifferent
Not bad
I like it
I love it
Not bad
Yes, good
Yes, very good
Not difficult
Yes
Easy & intuitive
Not bad
Yes
Yes, very much
No
Not difficult
Easy
Trivial
No
Not difficult
Easy
Trivial
No
Not difficult
Easy
Trivial
No
Not difficult
Easy
Trivial
Complicated
Easy
Intuitive
Trivial
Do you like application appear?
Not at all 3
No
Do you feel graphics has good quality?
Not at all 4
No
It’s indifferent
Is this application easy to learn this application?
Not at all 5
Not easy
No
Did you get a good feeling about using the application?
Not at all 6
I don’t like it
No
Was it difficult to choose the language?
Impossible 7
It’s hard
Is it easy to choose a room?
Impossible 8
It’s hard
Is it easy to get a showcase?
Impossible 9
It’s hard
Is it easy to find a piece?
Impossible 10
It’s hard
Why do you think about usability?
Impossible
Difficult
Satisfaction Rate Science Week '05
Satisfaction Rate Feritec '05 0,90
Rate
0,84
0,87
0,90
0,87
0,90
0,84
0,82 0,79
0,80
0,79
0,79
0,87
0,86
0,87 0,85
0,85
0,82 0,81
Rate
0,86
0,95
0,88
0,88
0,78
0,78 0,76
0,80 0,76
0,77
0,77
6
7
0,80
0,80
8
9
0,75 0,70
0,74 0,65
0,72 1
2
3
4
5
6
7
8
9
10
Question
Figure 15: Satisfaction ratings for Feritec.
An overall analysis is displayed in Figure 17. As we can see, this application has an acceptable performance; in both cases satisfaction ratings are above 0.80. A little bit higher among young and inexperienced people than adults that have some experience in technology.
356
1
2
3
4
5
10
Questions
Figure 16: Satisfaction rating for Science Week.
Now, a detailed analysis will be performed on the results based on the three aspects that lead the experiment. First aspect, graphic design and visual impact, will be analyzed first. Results reveal that the GUI is more attractive to young people than adults (bars 1, 2 and 3). Difference is deeper when people were
EVALUATING THE USERS’ EXPERIENCE OF A PDA-BASED SOFTWARE APPLIED IN ART MUSEUMS
asked about graphics quality and appearance. In this case, we have the lowest levels of the overall poll for FeritecGroup. However we get good marks for ScienceWeekGroup. Overall Satisfaction Ratio 0,832 0,83
Satisfaction Ratio
0,828 0,826 0,824 0,822 0,82 0,818 0,816 0,814 Feritec
ScienceWeek Event
Figure 17: Overall satisfaction ratio.
Analyzing the second aspect, embracing bar 4, 5 and 10, we got good performance in bar 5 for both groups (0.90 and 0.87); thus, the application is accepted by people in general. However, young and inexperienced people think that the application can be improved on learnability issues. Assessing usability in general, the FeritecGroup which is composed by experienced people, thinks that the application usability may be improved; while the other group thinks it is ok. When people are asked about concrete functionality, represented by bars 6, 7, 8 and 9; FeritecGroup is more comfortable than ScienceWeekGroup due to the fact that these users have a more fluent contact with this technology.
5
CONCLUSIONS AND FUTURE WORK
Starting from the outcomes of the experiments performed with real users, we can conclude that the PDA application is generally well accepted among both groups. Although experienced people may be a little bit more exigent than people without experience, rates are almost even. One reason of this difference may be caused on the fact that experienced people have more contact with this technology, and as it is easy to perceive the potential of this technology in this field, sometimes they may expect more functionality. The results revel that visual design is definitively targeted to young people. As design and visual issues are subjective matters and depends on people profile, we may provide a mechanism to customize it according to the user profile.
Regarding general usability, the application has a good rating; although, as pointed in the last section, learnability may be improved for inexperienced people. Application usability on concrete functions showed poor performance ratings on inexperienced people. We think that new interaction mechanisms should be implemented to improve this issue. On future work, we plan to address the issues mentioned above. The following list summarizes the lessons learned from these experiments and the future work for the next version of the application, which is currently under development: To improve design and visual impact, a skin based application must be implemented. This function allows users to customize application appearance according to the user’s preferences. Learnability will be addressed by using agent technologies. We propose an assistant to guide users through the application functionality depending on their own progress. To improve interaction for inexperienced people we propose a reduction of the number of interactions that users have to perform with the PDA in order to get the required information. This objective can be achieved using a location-aware system that replaces user clicks by user position. There are many alternatives to achieve this objective. An approach using a wearable computing device was presented in (Schiele et al., 2001). Studies of location identification were carried out in (Ciavarella and Paternò, 2003) and (Ciavarella and Paternò, 2004). So, it does not seem to be an easy task to find the most suitable one. As suggested by (Grinter et al., 2002) adding CSCW features to museums exhibitions as a rich space in which to examine this technology may emerge as a promising line of work..
ACKNOWLEDGEMENTS We would like to thank the Spanish CICYT project TIN2004-08000-C03-01 for funding this work, which was also supported by the grant PCC-05-0051 from JCCM
357
WEBIST 2007 - International Conference on Web Information Systems and Technologies
REFERENCES Baber C., Bristow H., Sean-Lee Cheng, Hedley A., Kuriyama Y., Lien M., Pollard J. and Sorrell P., 2001. Augmenting Museums and Art Galleries from http://citeseer.ist.psu.edu/543180.html. Bristow H., Baber C., Cross J., Woolley S. I. and Jones M., 2002. Minimal Interaction for Mobile Tourism Computers. Ciavarella, C., Paternò, F. 2003. Design Criteria for Location-aware, Indoor, PDA Applications. Proceedings Mobile HCI 2003, LNCS 2795, Springer Verlag, 131-144. Ciavarella, C., Paternò, F. 2004. The design of a handheld, location-aware guide for indoor environments. Personal and Ubiquitous Computing, Vol.8 N.2, Springer Verlag, 82-91. Ciolfi, L., Bannon, L. J. 2002. Designing Interactive Museum Exhibits: Enhancing visitor curiosity through augmented artefacts. Eleventh European Conference on Cognitive Ergonomics. Field Museum in Chicago, from http://www.fmnh.org/ Dolgos, Christopher 1996. Visiting the Virtual Museum: The World Wide Web and its Impact on Museum Education. Thesis (M.S. Ed.) - Bank Street College of Education, New York. Falk, John H./Dierking, Lynn D 1992. The Museum Experience. Washington: Whalesback Books. Gallud, J.A., Penichet, V.M.R., Argandeña, L. González, P., García J.A. 2005. Digital Museums: a multitechnological approach. HCI-International Conference 2005. :Lawrence Erlbaum Associates (ISBN 0-80585807-5) Las Vegas (USA), July, 2005. Green, David 2004. How fares the wired Museum?. Report on 32 Annual Conference of Museum Computer Network (November 10-13, 2004, Minneapolis, Minnesota). Grinter, R. E., Aoki, P. M., Hurst, A., Szymanski, Thornton, J. D., Woodruff, A. 2002. Revisiting the Visit: Understanding How Technology Can Shape the Museum Visit. Proceedings of CSCW'02, ACM, 1620. Jackson, Roland/Bazley, Martin/Patten, Dave/King, Martin 1998. Using the Web to Change the Relation Between a Museum and its Users. Ed. David Bearman and Jennifer Trant: Museums and the Web 1998: Selected Papers published on CD-ROM. Proceedings of the Second International Conference Toronto, Canada, April 22-25, 1998. Pittsburgh, PA: Archives & Museum Informatics, 1998. Pages counted as printed. McKenzie, Jamie 1998. Building Virtual Museums. From Now On - The Educational Technology Journal. Internet, from http://www.fromnowon.org/museum/museum.html.Ve rsion: 01/10/98. Last visited 09/14/1998. Schiele, B., Jebara, T. and Oliver, N. 2001. Sensory Augmented Computing: Wearing the Museum's Guide. IEEE Micro 21 (3).
358
Steele B. 2002. Human-Computer Interaction Group tests systems for electronic guides, Computer Science, Cornell University. Werner Schweibenz 1999. The Learning Museum: How Museums use information Technology to present value added Collection Information for Lifelong Learning. Proceedings of the 7th International BOBCATSSS Symposium Learning Society – Learning Organisation – Lifelong Learning, Bratislava, Slovak Republic, January 25-27, 1999, ed. by Sandra Beheim, Stephan Cradock, Eva Dächert, Sonja Pfurr.