Evaluating the Visual Quality of Web Pages Using a Computational Aesthetic Approach Ou Wu
Yunfei Chen, Bing Li
Weiming Hu
NLPR, Institute of Automation Chinese Academy of Sciences
NLPR, Institute of Automation Chinese Academy of Sciences
NLPR, Institute of Automation Chinese Academy of Sciences
[email protected]
{yfchen,bli}@nlpr.ia.ac.cn
[email protected]
ABSTRACT
1.
Current Web mining explores useful and valuable information (content) online for users. However, there is scant research on the overall visual aspect of Web pages, even though visual elements such as aesthetics significantly influence user experience. A beautiful and well-laid out Web page greatly facilitates users’ accessing and enhances browsing experiences. We use “visual quality (VisQ)” to denote the aesthetics of Web pages. In this paper, a computational aesthetics approach is proposed to learn the evaluation model for the visual quality of Web pages. First, a Web page layout extraction algorithm (V-LBE) is introduced to partition a Web page into major layout blocks. Then, regarding a Web page as a semi-structured image, features (e.g., layout, visual complexity, colorfulness) known to significantly affect the visual quality of a Web page are extracted to construct a feature vector. We present a multi-cost-sensitive learning for visual quality classification and a multi-value regression for visual quality score assignment. Our experiments compare the extracted features and conclude that the Web page’s layout visual features (LV) and text visual features (TV) are the primary affecting factors toward Web page’s visual quality. The performance of the learned visual quality classifier is close to some persons’. The learned regression function also achieves promising results.
Besides providing information, Web pages serve as the user interfaces of the Internet. The Internet has become indispensable in people’s daily life, so there is an increasing need to design visually appealing Web pages. Researchers in multiple disciplines have laid emphasis on the aesthetics of web pages. Findings on human computer interaction (HCI) suggest that aesthetics enhances positive feelings toward Web-based applications and has important implications for user experience [27, 32, 33]. Psychology experiments were conducted to examine the effect of the aesthetics of a Web page on its usability [25, 27] and credibility [12, 24]. The results concluded that visually appealing Web pages are perceived to be easier to use and access, and higher aesthetic Web pages are usually judged as having higher credibility. Consequently, both the HCI and design research fields have exerted great efforts to improve a Web page’s aesthetics and to develop standards to evaluate the aesthetics of a Web page [7, 18, 21]. Many well-designed experiments, based on cognitive psychology and user experience theories, have been performed to exploit critical factors related to Web pages’ aesthetic. Plenty of useful Web page design rules are established. However, due to limitations in visual information processing and Web mining techniques, previous studies have usually considered only a small number of factors. The lack of solid machine learning theories has resulted in that evaluation models are usually simple and have poor generalization capabilities. Further, most of the models rely on human intervention. On the other hand, current Web mining mainly engages in the exploration of valuable content and page relevance on the Web and in the evaluation of content usability. Web pages’ aesthetics has receives little attention in the Web mining literature despite its crucial effect on Web-based applications. To advance Web aesthetics research and construct a generalized, automatically and more accurate aesthetic evaluation model, this paper bridges the gap between the studies in the HCI and design communities and the methodologies in Web mining and machine learning. Specifically, a wide range of factors, motivated by existing studies in the HCI, design, and computer vision fields, are considered; effective Web mining techniques are applied to the feature extraction; and theoretically well-founded machine learning methods are utilized to analyze and cope with the model learning. In this work, aesthetics is called visual quality (VisQ). The evaluation of VisQ can play a significant role in many Web-based applications. Some potential applications include:
Categories and Subject Descriptors H.4.m [Information Systems]: Miscellaneous; H.2.8 [Database Applications]: Data Mining
General Terms Algorithms
Keywords Visual quality, Web mining, aesthetics, semi-structured image, learning.
Permission to make digital or hard copies of all or part of this work for personal or classroom use is granted without fee provided that copies are not made or distributed for profit or commercial advantage and that copies bear this notice and the full citation on the first page. To copy otherwise, to republish, to post on servers or to redistribute to lists, requires prior specific permission and/or a fee. WSDM’11, February 9–12, 2011, Hong Kong, China. Copyright 2011 ACM 978-1-4503-0493-1/11/02 ...$10.00.
INTRODUCTION
i. Web search. A general Web search procedure involves two steps: finding the relevant Web pages and then fetching the the pages. Both steps involve the pages’ usability. Current search engines only manage the first step. The results are achieved based on Web pages’ relevance usability, which depends on many factors such as content relevance,user feedback, and pagerank score. The higher the Relevance of a page, the higher the page ranks. However, the VisQ of a Web page also determines its usability [19, 27] and affects user’s interaction. For example, studies in [25] show that the effect of Web page size ratio on the Web information retrieval task is statistically significant. In essence, relevance meets users’ information needs while VisQ meets the user experience needs. For two pages with approximately equal relevance scores, users prefer the higher-VisQ pages most probably1 . Thus, VisQ could be used as an additional factor to rank Web pages: pages with similar relevance can be ordered according to the VisQ, while pages with similar VisQ can be ordered based on the RelQ ii. Web page design. Designers rate the aesthetics of the Web pages during the design stage to obtain feedbacks. However, existing studies showed that designers do not always experience the same kinds of impressions as users [21]. Therefore, an objective and fair Web VisQ evaluation tool is needed for designers to evaluate pages. Learning the VisQ evaluation model for Web pages in our study involves a computational aesthetics approach. This falls into a classical statistical learning framework: extracting discriminative features and then learning the inductive model (classifier and regression function). However, VisQ is subjective, which begs the question: is it possible to learn a model in order to measure the VisQ of Web pages? Web design is a hot research topic in the HCI and design communities, and it follows general design patterns and rules. Certain features and design clues are believed to please users more than others do. It is feasible to learn a VisQ evaluation model based on some discriminative features. More over, several pilot works [9, 22, 14] on aesthetic modeling for images have demonstrated encouraging results. An online image aesthetics rating system has been running [1]. The achievements on image aesthetic suggest that the evaluation of the VisQ of Web pages can be reasonably learned. A Web page can be viewed as a semi-structured image. The structural information includes the page layout, text positions and distributions, inner image positions, and background areas. We first apply a Web structure analysis tool to segment a Web page into a set of blocks, and then construct the layout for the page. We extract four classes of visual features for a page: layout visual features, text visual features, classical visual features (color and texture), and the visual complexity feature. To reduce the negative effects of a single person’ s labeling subjectivity, each training page in our experiments is repeatedly labeled by several persons. Finally, a multi-cost-sensitive learning based classifier and 1 If we compare a Web page to a daily product (e.g., a mobile phone), the relevance can be seen as an indicator of the product quality, while VisQ can be seen as an indicator of the aesthetics of product appearance. People favor a product according to not only quality but also appearance.
a multi-value regression based function are constructed to classify and predict the VisQ of Web pages, respectively. The main contributions of this paper are as follows: i. The construction of the VisQ evaluation model is formalized into a multi-cost-sensitive learning problem in terms of classification and a multi-value regression problem in terms of VisQ score estimation, respectively. ii. We propose a heuristic algorithm to derive a Web page’s layout based on a classical Web page structure analysis tool. Regarding a Web page as a semi-structured image, we extract a wide range of visual features to describe a Web page. iii. Two VisQ evaluation approaches based on a cost-sensitive SVM (support vector machine) and SVR (support vector regression), respectively, are presented. We divided the extracted features of a Web page into several subsets, and each subset’s performance is evaluated. We also compare the combination of different subsets to select the more appropriate features. iv. Potential applications are discussed in this paper. The rest of the paper is organized as follows. Section 2 discusses and formalizes the VisQ evaluation problem. Section 3 introduces the Web page layout extraction algorithm. Section 4 presents the features used and their extraction methods. Section 5 describes the experimental setup, including two concrete learning methods. Section 6 reports our experimental results with some discussions. Section 7 briefly reviews related work. We conclude our work in Section 8.
2.
PROBLEM DISCUSSION AND FORMALIZATION
This section formalizes the construction of VisQ evaluation model from a machine learning viewpoint. In traditional machine learning, training samples’ labels are usually objective. In this study, the VisQ values rated by humans are subjective. This kind of learning problem is called subjective data learning. To address this problem, the following subsections discuss two key learning components (i.e., the labeling strategy and label preprocessing). Then the construction of the VisQ classifier and the VisQ regression function are formalized, respectively. The steps and conclusions of this section can be used for other subjective data learning problems.
2.1
Labeling and Preprocessing
We adopt the assumption in [9] and hold that there exists a true score/label of the aesthetics intrinsic to a Web page. The question posed is: how can the true intrinsic score/label for a Web page be obtained? It is nearly impossible to find a person who can give every Web page’s true label perfectly. In this study, we take the repeated labeling strategy, which obtains multiple labels for each training sample, to improve the quality of the learned model when each labeling is imperfect [28]. Hence, each training Web page is labeled by several persons, which corresponds to a set of scores/labels. The learning of VisQ classifier and VisQ regression function in this study is based on training pages and their score/label
sets. In this paper, a Web page is represented by a feature vector Xk . Assume there are M persons that rate (label) the training Web pages. Then each page receives M scores. For Xk , its score set is Sk = {Sk (1), . . . ,Sk (M )}, where Sk (i) is given by the i-th user. We define two important terms used in the following part of this paper. The first term is the consensus value (cv), which is defined as follows: 1 ∑M Sk (i) (1) cvk = i=1 M The second is the subjective degree (sd) which is defined as follows: 1 ∑M (Sk (i) − cvk )2 (2) sdk = i=1 M −1 These two terms are the two most important statistical parameters of a random sequence, that is, sample mean and sample variance. The subjective degree 2 can be regarded as an indication of the subjective aspect of the aesthetics of a page. The higher the subjective degree, the more subjective it appears to be. This parameter can be applied to improve the quality of the training data. It will be discussed in the experiments. Applying standard learning methods directly appears to be difficult, as each page has several scores/labels. Previous studies [9, 22] took average labels as the final label for each sample. We take an alternative approach, which is analyzed in §2.2 and §2.3.
2.2 VisQ Classification via Multi-cost-sensitive Learning To apply standard (classical) learning methods, each page’s score set should be transformed into a category label (high VisQ page or low VisQ page). Assume that the available rating scores are divided into five ranks: -2 (very bad), -1 (bad), 0 (border line), 1 (good), and 2 (very good). Previous studies [9, 22] utilized a threshold-based method to transform the score set into labels. For example, if the thresholds are set as 0, Web pages whose consensus values (cvs) are bigger than 0 are placed into high VisQ category (H), while others are placed into the low VisQ category (L). Despite the rationality of this strategy, it ignores the difference between “very bad” and “bad”, and the difference between “very good” and “good”. We keep in mind that the mis-classified error of a page with score -2 and that of a page with score -1 are different. In other words, the scores do not only indicate the label information but also the importance (extra cost) of a page. Both the transformed category labels and costs should be taken into account. We define the following rule to transform the score set of a Web page into its label and costs: Label and cost assignment rule: Assume that a Web page’s score set Sk = {Sk (1), . . . , Sk (i), . . . , Sk (M )}. The consensus value cvk is calculated using Eq. (1). If cvk ≥ 0, the label is assigned to “H” (high VisQ) and the cost set is Ck = {Ck (1), . . . , Ck (i), . . . , Ck (M )}, where Ck (i) = Sk (i); if cvk < 0, the label is assigned to “L” (low VisQ) and the cost set is Ck = {Ck (1), . . . , Ck (i), . . . , Ck (M )} where Ck (i) = −Sk (i). For example, if Sk = {−2, 1, −1, −1, 0, −2, −2, −1}, then using Eq. (1), we have cvk = −9/8 < 0; the label is assigned 2
Generally, the more subjective of a page’s VisQ, the higher the inter-rater disagreement. Hence, this degree can also be taken as the measurement of the inter-rater disagreement.
to “L” and Ck = {2, −1, 1, 1, 0, 2, 2, 1}. In standard costsensitive learning, all the costs are nonnegative. However, in this example, Ck (2) = −1. This is reasonable because from the second-participant’s view, the VisQ is good; if the page is classified into the “H” category, the total cost should be reduced and minus one. With this assignment rule, each page is assigned to a set of costs, while in standard cost-sensitive learning, each sample only has one cost. Hence, we need to introduce a new learning called multi-cost-sensitive learning in this study. Illuminated by the definition of standard cost-sensitive learning [35], multi-cost-sensitive learning is defined as follows: Multi-cost-sensitive learning: Assume that examples are drawn independently from a distribution G with domain X × Y × (C(1) × . . . × C(M )), where X is the input sample space, Y is a (binary) output space, and C(i) ∈ [0, +∞] is the extra cost associated with misclassifying that example. The goal is to learn a classifier h which minimizes the expected cost, ∑M c(i) · I(h(X) ̸= Y )] EX,Y,C(1),··· ,C(M ) [ i=1
given the training data in the form of (X, Y, c(1), . . . , c(M )), where I(·) is the indicator function that equals to 1 in case its argument is true, and 0 otherwise. All the label information is integrated in this learning. We find that it is not necessary to introduce a new method for this learning problem. The proposed multi-cost-sensitive learning can be cast into the standard cost-sensitive learning: Theorem 1. The proposed multi-cost-sensitive learning problem equals to a standard cost-sensitive learning problem in which each sample’s cost is its average cost. Proof. EX,Y,C(1),··· ,C(M ) [
∑M i=1
c(i) · I(h(X) ̸= Y )]
= EX,Y,C¯ [M · c¯ · I(h(X) ̸= Y )] ∼ EX,Y,C¯ [¯ c · I(h(X) ̸= Y )] ¯ is the average cost distribution determined by in which C C(1), · · · , C(M ). We use +1 to denote high VisQ and -1 to denote low VisQ. If the average of each sample’s cost set (Ck ) is treated as the sample’s average cost, then our VisQ evaluation (classification) problem can be formalized as follows: VisQ Classification: Given a set of N training samples {(X1 , Y1 , c1 ),. . .,(XN ,YN ,cN )}, the goal is to learn a classifier that can classify the VisQ of a new Web page, where Yk and ck are calculated as follows: Yk = sign(cvk ) ∑M 1 ck = M i=1 ck (i) = sign(cvk ) · cvk = |cvk | We utilize the standard cost-sensitive learning method to train a VisQ classifier. The concrete learning method is introduced in §5.2.
2.3
VisQ Score Assignment via Multi-value Regression
We also aim to learn a regression function that can assign a VisQ score to an unseen Web page. Since each Web page has multiple scores (values), we call this multi-value
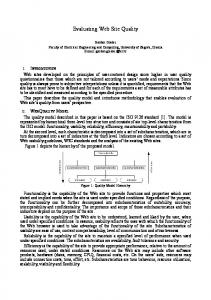
Figure 1: Three Web pages and their extracted layouts (rectangles with green lines) using V-LBE. regression. Given the training Web pages and their associated scores, the goal of the multi-value regression is to learn a function f that minimizes the following residual sum-ofsquares error (RSSE): ∑N ∑M (f (Xk ) − Sk (i))2 k=1
i=1
where N is the number of training samples. This formula can be rewritten as follows: ∑N ∑M 2 k=1 i=1 (f (Xk ) − Sk (i)) ∑N ∑ M 2 1 = k=1 [M · (f (Xk ) − M i=1 Sk (i)) + g(Sk (1), · · · , Sk (M ))] ∑N ∑ M 2 1 ∼ k=1 (f (Xk ) − M i=1 Sk (i)) ∑N = k=1 (f (Xk ) − cvk )2 Then the VisQ regression problem can be reduced to the following standard regression problem: VisQ Regression: Given a set of N training samples {(X1 , cv1 ), . . . , (XN , cvN )}, the goal is to learn a function that can predict the VisQ of a new Web page, where cvk is calculated by Eq. (1).
3. PAGE LAYOUT EXTRACTION Michailidou et al. [18] concluded that there is a strong and high correlation between Web pages’ layouts and their aesthetics. This section introduces our page layout extraction algorithm. Inspired by the definition of layout in design research [3], in this study, the layout of a Web page is defined as a set of un-overlapped large rectangular blocks that (approximately) cover the whole page. These rectangular blocks are also called layout blocks. Fig. 1 gives three layout examples for three Web pages, respectively. Many well-known Web page segmentation algorithms are proposed in the literature [4, 6, 15]. These algorithms represent a segmented page using a tree. Song et al. [30] directly took the leaf nodes (blocks) as the layout blocks of a Web page. As the sizes of leaf nodes vary greatly, and some leaf nodes’ sizes are very small, we instead introduce a heuristic layout extraction algorithm based on the Web page segmentation results. Given that this study explores the visual aspects of Web pages, the Vision-based Page Segmentation (VIPS) [4] algorithm is chosen as the basic segmentation algorithm. The VIPS algorithm outputs a block tree of a Web page. The root of the VIPS block tree is the whole page; each block corresponds to a node; parent nodes are partitioned into finer children nodes (blocks); and all the
leaf nodes (blocks) form a flat segmentation of the whole page. Our algorithm is called VIPS based Layout Block Extraction algorithm (V-LBE). V-LBE first selects all the layout block candidates whose sizes are above a threshold (τ1 ) and then deletes or inserts blocks to construct a set of un-overlapped large blocks which (approximately) cover the whole page. In our experiments, τ1 is set as 1/9 of the whole page size, while τ2 is set as 1/36 of the whole page size. Algorithm 1 V-LBE Input: a Web page, two thresholds τ1 and τ2 . Output: a set of layout (rectangular) blocks. Steps: 1. Segment the Web page into a block tree using the VIPS method described in [4]. The parameter PDOC (VIPS uses it to control the granularity of the leaf node blocks) is set to be large enough to ensure the smallest possible leaf node block granularity. 2. Access each node of the tree and select the nodes whose areas are equal to, or bigger than, the threshold τ1 . These selected nodes also consist of a new tree Tnew . 3. Access each non-leaf node of Tnew . If the node’s children do not cover it, new nodes are generated as the node’s children such that the node can be covered by its children. 4. Delete Tnew ’s leaf nodes whose areas are below τ2 , and output the rest of the leaf nodes’ rectangular blocks.
Once the layout blocks are obtained, the number of major blocks on a page and the blocks’ relative positions can be easily inferred. We use adjacent matrix (A) to describe the relationships between blocks: Aij = 1 if the block i and the block j are adjacent, while Aij = 0 otherwise. The adjacent matrix of the middle page in Fig. 1 is: [[0 1 0 0]; [1 0 1 0]; [0 1 0 1]; [0 0 1 0]]. The following section will introduce the crucial features that affect the VisQ of Web pages.
4.
FEATURES
A Web page’s VisQ is influenced by a wide range of factors. With the extracted layout, a Web page can be transformed into a semi-structured image, and each block of the page corresponds to an image block. We consider four classes of features: (1) layout visual features (LV) that reflect the visual perception on the page layout; (2) text visual features (TV) that reflect the visual perception on the Web texts; (3) classical visual features including traditional color and texture features; and (4) the visual complexity feature (VC). The four classes of features characterize a Web page’s four main parts: text, images, backgrounds, and the layout. The following subsections will introduce the four feature classes
Figure 3: An example of the text blocks of a Web page. text leaf nodes (blocks) enveloped by red rectangles. Texts outside the rectangles are not detected for they are embedded in images. However, the visual influence of these texts can be reflected in the classical visual features.
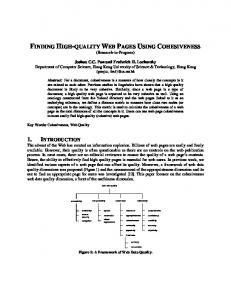
4.3 Figure 2: Two Web pages and their block trees. The layout of the left page (P1) is simple, while that of the right page (P2) is complex. one by one. Thirty features are extracted as candidate features denoted as {fi |1 ≤ i ≤ 30}.
4.1 Layout Visual Features (LV) Three straightforward features inspired by [9] are considered: the number of layout blocks (f1 ), the sum of the width (L1 ) and the height (L2 ) of the envelope rectangle of all layout blocks (f2 = L1 + L2 ), and the envelop rectangle’s aspect ratio (f3 = L1 /L2 ). Layout complexity also affects visual perception significantly. We find that a page’s VIPS block tree captures layout complexity. Fig. 2(a) presents two example pages. The left page’s layout complexity is lower than the right one’s. Fig. 2(b) shows the two pages’ block trees using VIPS (the right tree depicts only a part of the whole block tree of the right page with space consideration). The lower complex layout has a lower complex block tree. Hence, we use the number of leaf nodes (f4 ) and the number of layers of the block tree (f5 ) to characterize the layout complexity of a Web page. The f4 value is 6, and the f5 value is 3 for the left page in Fig. 2(a); the value of f4 is 137, and the value of f5 is 13 for the right page in Fig. 2(a).
4.2 Text Visual Features (TV) Text also influences visual perception, as it usually occupies a large proportion of a Web page. The visual features for text are extracted based on the VIPS algorithm. After utilizing VIPS to derive the block tree of a page with a large P DOC value, the leaf nodes that contain texts are detected. The number of these text leaf nodes is taken as the first text visual feature (f6 ); the sum of their areas proportion to the whole page’s area is taken as the second text visual feature (f7 ); and the character density ( the proportion of text characters on the text areas) is taken as the third text visual feature (f8 ). Fig. 3 shows a page and its
Classical Visual Features
This subsection concerns the features that are demonstrated to be effective in images’ aesthetics and attractiveness modeling. Before extracting these features, each Web page should be transformed into an image. To differ from general images, the transformed images are called Web-page images. They are represented both in the RGB (Red-GreenBlue) and HSV (Hue-Saturation-Value) color spaces in the requirement of calculation. Since a Web-page image is segmented into several blocks, we also extract the relative features that can describe the contrast among blocks in the Web-page image. Suppose a Web-page image’s layout blocks are {B1 , . . . , Bi , . . . , BW }.
4.3.1
Color Features
What we perceive and feel about an image is mainly experienced through its colors. Colors and their organization are the key issues that affect the VisQ of a Web-page image. Several color attributes are utilized to characterize the color present in a Web-page image. Hue (H): This factor is one of the main properties of a color. Let Hue(Bi ) be the average hue of a Web-page image layout block Bi . Then the feature (f9 ) that describes the average hue of the whole Web-page image is as follows: 1 ∑W f9 = λi Hue(Bi ) i=1 W where λi is the area proportion of Bi in the Web-page image. The second hue feature (f10 ) measures the average hue contrast between blocks and their adjacent blocks: 1 ∑W ∑W f10 = Aij |Hue(Bi ) − Hue(Bj )| i=1 j=1 W The third hue feature (f11 ), which reflects the overall contrast among blocks, measures the blocks’ hue variance: f11 = Var(Hue(Bi )) Brightness (Bri): Previous studies reveal that bright Web pages appear to be more friendly [20]. We use three bright features (f12 , f13 , and f14 ) to denote the average brightness, average brightness contrast, and blocks’ brightness variance, respectively. They are calculated similar to the calculation for hue features by replacing Hue(Bi ) with
Figure 4: Two Web pages with different visual complexities. V alue(Bi ), where V alue(Bi ) is the average value of the pixels in block Bi in the HSV color space. Saturation (Sat): The saturation measures the vividness of a color. The saturation of a pixel is as follows [22]: Sat = max(r, g, b) − min(r, g, b) where r, g, and b are the pixel’s coordinates in the RGB color space. Three saturation features (f15 , f16 , and f17 ) are used to describe the average saturation, average contrast saturation, and blocks’ saturation variance, respectively. They are calculated similarly to those for hue features by replacing Hue(Bi ) with Sat(Bi ), where Sat(Bi ) represents the average saturation value of block Bi . Colorfulness (Col): An efficient colorfulness evaluation algorithm was proposed by Hasler [11]. The algorithm first calculates the opponent color space where for a pixel (r, g, b) in the RGB color space, its new coordinates are as follows: rg = r − g yb = 0.5(r + g) − b Then for block Bi , its colorfulness can be obtained using: Col(Bi ) = αrgyb (Bi ) + 0.3 · βrgyb (Bi ) √ αrgyb (Bi ) = [σrg (Bi )]2 + [σyb (Bi )]2 √ µrgyb (Bi ) = [µrg (Bi )]2 + [µyb (Bi )]2 Colorfulness is effective in image representation [22]. We use three features (f18 , f19 , and f20 ) to describe colorfulness: average colorfulness, average contrast colorfulness, and blocks’ colorfulness variance. They are obtained similarly to those for hue features by replacing Hue(Bi ) with Col(Bi ).
4.3.2 Texture features (T) In the visual arts, texture refers to the surface quality perception of an artwork. Studies in [17] suggest that three Tamura features [31] are effective in image representation: coarseness, contrast, and directionality. They are used in this study. For each Tamura feature, we extract its three corresponding features for a Web page: average value, average contrast value among blocks, and blocks’ value variance. Thus, there are 3 ∗ 3 = 9 texture measures for a Web-page image, which are denoted as f21 − f29 .
4.4 The Visual Complexity Feature (VC) Cognitive psychology experiments reveal that the visual complexity of a page affects users’ experience of pleasure [34]. Many cognitive psychology experiments simply use compressed image file sizes (e.g., JPEG) to quantify the
Figure 5: A long Web page and the truncated short page. Web pages’ visual complexities. This qualification is reasonable. Fig. 4 shows two Web pages with similar layouts. The JPEG size of the left Web-page image is 272 k, and that of the right one is 104 k. The two sizes are consistent with our perception that the left Web-page image is more complex. We then use the normalized visual complexity feature (f30 ) in this study. The feature is the ratio of the JPEG size to the whole Web-page image’s area.
5.
EXPERIMENT SETUP
Our experiments aim to test the performance of the proposed VisQ evaluation approaches (classification and regression). This section describes the experimental data as well as the concrete classification and regression methods.
5.1
Data and Human Labeling
Homepages are usually effectively designed to attract users, as they provide the first impression of a Web site [19]. We chose homepages as our experimental data and collected 500 homepages, mainly from sites of companies, universities, governments, personal, and so on. To ensure that the gathered pages contain both high and low VisQ pages, two persons collected high-VisQ pages, and two other persons collected low-VisQ pages. All pages are in foreign languages, which is a common practice that designers use when designing Web pages. The purpose is to prevent human evaluation being affected by the content. After completing the download, each page’s layout and text blocks are extracted, and each page is transformed into a Web-page image. In the human labeling, the scrolling for long Web pages may disturb the assessment. Hence, for each long page, it is truncated, and only the topmost part is left as a short page; the layout and features are then extracted from the short page. The length of a short page is approximately the length of a screen. Fig. 5 gives an example of a long page and the truncated short page, as well as the extracted layout. In Web perception experiments [20], human labeling interfaces should be well designed to keep participants’ perception as close as possible to the perception when they access the pages freely. Therefore, we design a labeling platform shown in Fig. 6. Seven PhD students, specifically four males and three females in our laboratory, are invited to label the collected pages. Each participant is allowed to view one page within
Table 1: The classification performances of each feature subset Feature subset AMC (performance order) LV (f1 − f5 ) 0.2281 (1) 0.2534 (2) TV (f6 , f7 , f8 ) H (f9 , f10 , f11 ) 0.3383 (8) Bri (f12 , f13 , f14 ) 0.3026 (6) Sat (f15 , f16 , f17 ) 0.3254 (7) Col (f18 , f19 , f20 ) 0.2951 (5) T (f21 − f29 ) 0.2648 (3) VC (f30 ) 0.2765 (4) Figure 6: The human labeling platform. 5 seconds and assess the page from the five rating scores (-2, -1, 0, 1, and 2). “2” means very good, while “-2” means very bad. After human labeling, each page has seven scores. The label and cost of each page are obtained using Eq. (1) and Eq. (2). The following subsection introduces the concrete learning and regression methods based on the formalizations in §2.
5.2 Classification and Regression Methods In §2.2 and §2.3, we introduced the multi-cost-sensitive learning to describe the VisQ classification and the multivalue regression to describe the VisQ regression. The multicost-sensitive learning problem is reduced into a standard cost-sensitive learning problem. We use the cost-sensitive SVM (c-SVM) [35] as the concrete learning method. c-SVM incorporates the cost of each sample (ci ) into the classical SVM framework. The optimization framework of c-SVM is ∑ min imize : 12 a · a + C N i=1 ci ξi s.t.∀i:Yi [ai Xi + bi ] ≥ 1 − ξi , ξi > 0 where C controls the model complexity. The multi-value regression has also been reduced into a standard regression problem. We choose the support vector regression (SVR) [29] as the concrete regression method. The optimization framework of SVR is ∑ ∗ minimize : 12 ∥a∥2 + C N i=1 (ξi + ξi ) cvi − wXi − bi ≤ ε + ξi wXi + bi − cvi ≤ ε + ξi∗ s.t.∀i: ξi , ξi∗ ≥ 0 where C controls the model complexity.
6. EXPERIMENTAL RESULTS This section reports the classification and regression results on the collected Web pages.
6.1 Visual Quality Classification In cost-sensitive learning, mis-classified cost instead of mis-classified error rate in the standard learning framework is applied to evaluate learning performances [35]. To compare with the standard learning framework, we linearly transform the average cost (c) of each Web page such that the to∑ tal average of all average costs equals to 1 ([ N ¯i ]/N = 1). i=1 c The average mis-classified cost (AMC) is used in this study: ∑N AM C = [ c¯i · I(h(Xi ) ̸= Yi )]/N i=1
Hence, AMC equals to 1, if all the Web pages are misclassified, while AMC equals to 0, if all Web pages are correctly classified. Then AMC ranges from 0 to 1, with a lower AMC being better. It is comparable to the mis-classified error rate. The SVMLight package [13] is used in the classification with the radius-based function kernel. The performance of each experimental run is evaluated via leave-one-out validation. Specifically, the parameter C and the kernel parameter g are searched in {0.01, 0.1, 1, 10, 100} and {0.25, 0.5, 1, 2, 4, 8}, respectively. We first take all the 30 features introduced in §4 to classify the Web pages. The AMC is 0.2088, while the average misclassified error (proportion of the number of mis-classified Web pages) using the standard learning algorithm is 25.8% (0.258). The results show that the proposed cost-sensitive learning framework reduces the proportion of mis-classified high-cost samples. In the following part of this subsection, we then only use AMC to measure the results. This study is an initial Web VisQ modeling work in the Web mining filed, and the models proposed in the HCI community are noncomputational or even personalized. Therefore, to set the baseline, we calculate the AMC of the labels of each labeler, and the results are {0.1155, 0.0880, 0.1422, 0.0474, 0.0610, 0.1101, 0.0980}. The average is 0.0946. We compared the feature subsets introduced in §4: LV, TV, H, Bri, Sat, Col, T, and VC. The AMCs achieved by each feature subset are listed in Table 1. It can be observed that (1) LV provides the best performance. TV achieves the second-best performance. The best AMC value is 0.2281; (2) three classical image feature subsets, that is, hue, brightness and saturation, perform poorly; and (3)all the AMC values are below 0.5, meaning that all the features may be useful for the VisQ learning process. To obtain a more satisfactory performance, we undertake a forward feature selection strategy: the feature subsets are combined according to their performance orders. The AMCs of each feature subset combination are listed in Table 2. It can be observed that (1) the best performance (AMC = 0.1846) is achieved by the feature combination of LV, TV, T, VC, Col, and Bri; (2) each feature subset combination outperforms all the single feature subsets; and (3) with the increase in the number of combined feature subsets, the AMC decreases at first and then increases. Now, we test whether the contrast features among blocks are useful in learning. Five feature subsets (H, Bri, Sat, Col, and T) contain the contrast features. Each subset is divided into three parts: the average part (#1), the block contrast part (#2), and the block variance part (#3). The performances of the three parts, as well as their combina-
Table 2: The classification performances (AMC) of feature subset combinations Combinations AMC LV, TV 0.2104 LV, TV, T 0.2084 0.2063 LV, TV, T, VC LV, TV, T, VC, Col 0.1978 LV, TV, T, VC, Col, Bri 0.1846 LV, TV, T, VC, Col, Bri, Sat 0.2060 All features 0.2088 Table 3: The classification performances (AMC) of average features and contrast features. #1 #2 #3 All H 0.3051 0.3247 0.3051 0.3383 Bri 0.3051 0.3051 0.3312 0.3026 Sat 0.3293 0.3051 0.3051 0.3254 Col 0.3086 0.3004 0.3051 0.2951 T 0.2987 0.3093 0.3019 0.2648 tion (“All”), for each of the five feature subsets, are listed in Table 3. The overall conclusion is that contrast features can improve the performances of the average features (#1). In §2.3, we introduced the other important parameter of subjective data: subjective degree. Intuitively, highly subjective pages are inappropriate to be taken as training samples 3 . We list the AMC results in Table 4 when the top n% samples with highly subjective degrees are dropped from the learning set. The feature combination (LV, TV, T, VC, Col, Bri) is used. The overall results demonstrate that the classification can be improved by dropping some highly subjective Web pages. Two Web pages with highly subjective degrees are shown in Fig. 7. Both pages seem different from common Web pages. We collected 154 out-of-data Web pages in 1996, 1998, 2000, 2002, 2004, 2006 and 2008 from the Internet archive Wayback Machine [2]. There are 22 pages for each year. The learned classifier on feature combination (LV, TV, T, VC, Col, Bri) is used to classify these pages. Fig. 8 shows the percentage of predicted high-VisQ pages and that of humans labeled in each year. The results are consistent with human assessment that the VisQ of pages increases yearly.
6.2 Visual Quality Regression The LibSVM package [5] is used with nu-SVR. The parameters C and g are also searched via five-cross validation in the same candidates used in the classification experiments; other parameters are set as the default values. The 3 Dropping highly subjective (high inter-annotator disagreement) examples is a common practice in subjective concept learning tasks [9, 14, 23], though this may leads to a bias evaluation model. The consensus rating scores of highly subjective examples are usually near the average of the highest and lowest rating scores.
Table 4: The classification performances (AMC) after dropping n% highly subjective samples. 0% 4% 8% 12% 16% 20% 0.1846 0.1832 0.1862 0.1794 0.1781 0.1767
Figure 7: Two Web pages with highly subjective degrees.
Figure 8: pages.
The classification for out-of-data Web
residual sum-of-square error (RSSE) is applied to measure regression performance. The variance of the scores of all examples σ 2 is 0.723174, which is used as the baseline as in [9]. We also first evaluate the RSSE of each of the feature subset combinations as introduced in previous subsection. The results listed in Table 5 indicate that the combination (LV, TV, T, VC, Col, and Bri) achieves the best performance (RSSE = 0.54332). The value is a 24.87% reduction from the baseline. We run the learned regression algorithm (the features are the LV, TV, T, VC, Col, and Bri combination) on the collected 154 Web images. The average predicted score and the average of human rated score for each year are shown in Fig. 9. Most predicted values are located in (-1, 1). The main reason is that most scores of the training samples are located in the same range. This shows that to improve prediction accuracy, large and diverse training samples should be collected. Nevertheless, although the differences between the predicted scores and the human labeled scores are apparent, the predicted scores reflect the trend correctly.
Table 5: The regression performances (RSSE) of each feature subset combination Combinations AMC LV, TV 0.58137 LV, TV, T 0.546193 LV, TV, T, VC 0.55881 0.547087 LV, TV, T, VC, Col LV, TV, T, VC, Col, Bri 0.543342 0.5525 LV, TV, T, VC, Col, Bri, Sat All features 0.567706
Figure 9: The average RSSE of out-of-date Web pages.
6.3 Discussion The best classification performance (AMC = 0.1846) is almost twice the baseline (AMC = 0.0948) calculated from the seven labelers’ ratings. However, the result is close to the two labelers’ AMC values (0.1422 and 0.1155). Considering this study is an initial work that brings Web mining and machine learning into Web VisQ evaluation, with further research, the evaluation performance could be improved and could meet the requirement of Web-based applications. Two practical ways to improve the evaluation model are (1) to collect more training Web pages and employ more labelers, and (2) to learn personalized models instead of a general model as the aesthetics taste of a single person is constant to some extent. In our experiments, three feature subsets (i.e., LV, TV, and VC) are superior to other classical features, such as colorfulness and hue. Note that these three feature subsets are peculiar to Web pages and most of them are inapplicable for general images. Their superior performances indicate that the factors affecting the aesthetics of Web pages are not the same as those affecting the aesthetics of images. Consequently, our strategy that regarding a Web page as a semi-structured image is appropriate and reasonable. The structures of Web pages should be taken more carefully into account. In fact, Web pages’ layout design is an important research issue in design science [3].
7. RELATED WORK Aesthetics is a hot research topic in multiple disciplines including the HCI and design fields. It is a key issue related to the user experience of Web pages [26]. Previous works on Web pages’ aesthetics (VisQ) can be divided into two classes. One class of techniques aims to explore effective design rules on how to create a visually appealing and attractive Web page. These studies usually perform well-tuned cognitive psychology experiments to exploit the crucial factors related to aesthetics [8, 16, 19, 21]. However, the experiments usually involved several limited factors such as page size, text color, and so on. Schaik and Ling [25] investigated the effect of page size ratio on the information retrieval tasks in Web pages and ignored other factors. Park et al. [21] explored several high-level visual factors (colorfulness, static, tense) that influence the user experience on aesthetics. They did not provide a computational method for the factors such as “static” and “tense”. Hall and Hanna [10] examined the effect of web page text/background color combination on pages’ readability, aesthetics and so on. They concluded
that preferred colors such as blues and chromatic colors lead to higher aesthetics. The other class of techniques attempts to model the Web page aesthetics as our study aims. As mentioned in the Introduction, these approaches also merely consider limited factors, and the models are simply constructed and are only fit for the experimental data. For example, the model in [18] is constructed based on the simple linear regression on several factors. One factor in their model relies on different users, so their model is personalized and does work for general evaluations. In conclusion, the main differences between our work and existing studies are as follows: (1) existing studies are superior in exploring domain knowledge, while our work focuses on a Web mining and learning methodology for constructing a computational evaluation model; (2) our work considers a wide range of features; (3) our model is established on solid machine learning theories and thus has a better generalization capability; and (4) our approaches do not require manual intervention, so they can be easily integrated into Web-based applications. Nevertheless, despite there being many differences, our work benefited much from existing studies. Many features used are illuminated by, or directly brought from, the HCI and design studies. Therefore, one focus of our future work is to draw more domain knowledge from the HCI and design studies into our study. Learning to evaluate the aesthetics of images has gained much research interest recently [9, 22]. These studies provide many useful conclusions and techniques that benefit this work. Since a Web page differs from an image, there are also many differences between the two studies. As compared to the image aesthetics modeling, our study takes much structural information into account, while the structural features of a general image are not easy to obtain. In addition, the introduced multi-cost-sensitive learning and multi-value regression appear to be more reasonable in describing the learning task than the standard learning models, although they are tackled using standard techniques. Lastly, Web aesthetics evaluation can have more potential applications than image aesthetics evaluation.
8.
CONCLUSIONS
WWW has been becoming a necessary tool in people’s daily life. The user experience, especially the visual experience, plays an important part in attracting and facilitating users. In this paper, we have brought together multidiscipline studies from HCI, Web mining, machine learning, and computer vision to learn the VisQ evaluation model for Web pages. The VisQ evaluation is analyzed and formalized from a machine learning prospective at first. A multi-costsensitive learning is introduced for VisQ classification, and a multi-value regression is introduced for VisQ score assignment. The V-LBE algorithm is proposed to extract the layout of a Web page. Treating a Web page as a semi-structured image, four classes of features are extracted including layout visual features, text visual features, classical image features, as well as the visual complexity feature for a Web page. We compared the performances of different feature subsets and their combinations on the collected Web pages. The results show that the features describing Web page structures yield better discrimination capability than other classical visual features. The achieved best classification result is close to some persons’ actual assessment; and the achieved best re-
gression result also reveals that Web pages’ human-perceived aesthetics scores can be predicted with some success. Our future work will focus on the Web pages containing flashes and silverlight.
9. ACKNOWLEDGEMENT We would like to thank Prof. James Z. Wang for his useful comments and suggestions. This work is partly supported by NSFC (Grant No. 60825204, 60672040, 60723005).
[18]
[19]
[20]
10. REFERENCES [1] http://acquine.alipr.com/. [2] http://www.archive.org/web/web.php. [3] A.-R. Ahmad, O. Basir, K. Hassanein, and S. Azam. An intelligent expert systems’ approach to layout decision analysis and design under uncertainty. Studies in Computational Intelligence (SCI), 97:321–364, 2008. [4] D. Cai, S. Yu, J.-R. Wen, and W.-Y. Ma. Vips: a vision-based page segmentation algorithm. Microsoft Technical Report, (MSR-TR-2003-79), 2003. [5] C. Chang and C. Lin. Libsvm: a library for support vector machines, software available at http://www.csie.ntu.edu.tw/ cjlin/libsvm. 2001. [6] J. Chen, B. Zhou, J. Shi, H.-J. Zhang, and F. Qiu. Function-based object model towards website adaptation. In Proc. WWW, pages 587–596, 2001. [7] P. Costa. Evaluating web site design. In Proc. ACM SIGDOC’08, pages 1071–1083, 2008. [8] N. P. Dalal, Z. Quiblea, and K. Wyatt. Cognitive design of home pages: an experimental study of comprehension on the world wide web. Information Processing and Management, 36:607–621, 2000. [9] R. Datta, D. Joshi, J. Li, and J. Z. Wang. Studying aesthetics in photographic images using a computational approach. In Proc. ECCV, LNCS, pages 288–301, 2006. [10] R.-H. Hall and P. Hanna. The impact of web page text-background color combinations on readability, retention, aesthetics, and behavioral intention. Behaviour and Information Technology, 23(3):183–195, 2004. [11] S. Hasler and S. Susstrunk. Measuring colorfulness in real images. Proc. SPIE Electron. Imag: Hum. Vision Electron. Imag., VIII(SPIE 5007):87–95, 2003. [12] R. Hoffman and K. Krauss. A critical evaluation of literature on visual aesthetics for the web. In Proc. SAICSIT, pages 614–622, 2004. [13] T. Joachims. Making large-scale SVM learning practical. In Advances in Kernel Methods - Support Vector Learning. MIT Press, 1999. [14] Y. Ke, X. Tang, and F. Jing. Photo and video quality evaluation: Focusing on the subject. In Proc. ECCV, pages 386–399, 2008. [15] C. Kohlsch´l´ztter and W. Nejdl. A densitometric approach to web page segmentation. In Proc. CIKM, pages 1173–1182, 2008. [16] T. Lavie and N. Tractinsky. Assessing dimensions of perceived visual aesthetics of web sites. Int. J. Human-Computer Studies, 60(3):269–298, 2004. [17] R. Leuken, L. Garcia, and X. Olivares. Visual
[21]
[22]
[23]
[24]
[25]
[26]
[27]
[28]
[29]
[30]
[31]
[32]
[33]
[34]
[35]
diversification of image search results. In Proc. WWW, pages 341–350, 2009. E. Michailidou, S. Harper, and S. Bechhofer. Visual complexity and aesthetic perception of web pages. In Proc. SIGDOC’08, pages 215–223, 2008. M. Pandir and J. Knight. Homepage aesthetics: The search for preference factors and the challenges of subjectivity. Interacting with Computers, 18:1351–1370, 2006. E. Papachristos, N. Tselios, and T. Avouris. Bayesian modelling of impact of colour on web credibility. In Proc. ECAI, pages 41–45, 2006. S. Park, D. Choi, and J. Kim. Critical factors for the aesthetic fidelity of web pages: empirical studies with professional web designers and users. Interacting with Computers, 16:351–376, 2004. J. S. Pedro and S. Siersdorfer. Ranking and classifying attractiveness of photos in folksonomies. In Proc. WWW, pages 771–780, 2009. D. Reidsma and R. Akker. Exploiting ’subjecitve’ annotations. In Proc. Coling workshop on HJCL, pages 8–16, 2008. D. Robins and J. Holmes. Aesthetics and credibility in web site design. Information Processing and Management, 44:386–399, 2008. P. V. Schaik and J. Ling. The effects of screen ratio and order on information retrieval in web pages. Displays, 24:187–195, 2003. P. V. Schaik and J. Ling. Modelling user experience with web sites: Usability, hedonic value, beauty and goodness. Displays, 20:419–432, 2008. B. Schenkman and F. Jonsson. Aesthetics and preferences of web pages. Behaviour and Information Technology, 19(5):367–377, 2000. V. S. Sheng, P. F, and P. Ipeirotis. Get another label? improving data quality and data mining using multiple, noisy labelers. In Proc. SIGKDD, pages 614–622, 2008. A. J. Smola and B. Scholkopf. A tutorial on support vector regression. Statistics and Computing, 14(3):199–222, 2004. R. Song, H. Liu, J.-R. Wen, and W.-Y. Ma. Learning block importance models for web pages. In Proc. WWW, pages 203–211, 2004. H. Tamura, S. Mori, and T. Yamawaki. Texture features corresponding to visual perception. IEEE Trans. SMC, 8(6):460–473, 1978. P. Tarasewich, H. Z. Daniel, and H. E. Griffin. Aesthetics and web site design. Quarterly Journal of Electronic Commerce, 2(1):67–81, 2001. N. Tractinsky, A. Cokhavi, M. Kirschenbau, and T. Sharfi. Evaluating the consistency of immediate aesthetic perceptions of web pages. Int. J. Human-Computer Studies, 64:1071–1083, 2006. A. Tuch, J. Bargas-Avila, K. Opwis, and F. Wilhelm. Visual complexity of websites: Effects on users’ experience, physiology, performance, and memory. Int. J. Human-Computer Studies, 67:703–715, 2009. B. Zadrozny, J. Langford, and N. Abe. Cost-sensitive learning by cost-proportionate example weighting. In Proc. ICDM, pages 435–442, 2003.