âgoodâ violins respond more strongly at the lower register and exhibit a broad maximum around 2â3 kHz ..... That said, a fairly cheap but better maintained violin.
Evaluating violin quality: Player reliability and verbalization Charalampos Saitis
Department of Music Research McGill University Montréal, Québec, Canada December 2013
A dissertation submitted to McGill University in partial fulfillment of the requirements for the degree of Doctor of Philosophy in Music Technology © 2013 Charalampos Saitis
i
Abstract This thesis addresses the perceptual evaluation of violins from the player perspective. Three carefully controlled violin-playing studies were carried out, wherein experienced musicians assessed violins of different make and age, and described their choices in open-ended questionnaires. The focus was gradually narrowed from examining overall preference (Study 1) to the evaluation of certain perceptual attributes of the violin (Studies 2 and 3). Two distinct yet complementary approaches were followed: a systematic investigation into the reliability of preference judgments, and an exploratory analysis of concepts emerging from impromptu preference verbalizations. Study 1 examined both intra- and inter-player consistency in repetitive violin preference rankings. It was found that violinists are self-consistent when evaluating different instruments but a significant lack of agreement between musicians was observed. Study 2 investigated the origin of inter-individual differences and measured the extent to which different attributes of the instrument influence preference. Results showed that whereas violinists tend to agree of what particular qualities they look for in an instrument—preference was strongly associated with sound richness and, to a lesser extent, dynamic range—the perception of the same attributes widely varies across individuals. Study 3 focused on the evaluation of richness and dynamic range in constrained (playing only certain notes on certain registers) vs. unconstrained (playing a certain excerpt from the classical repertoire) tasks. The perception of richness from playing vs. listening tasks (using recorded sounds from the playing task) was also examined. Results suggested that specifying the musical material and technique removes a significant amount of inter-player variability: the more focused the task, the more self-consistent violinists are and the more they agree with each other. From verbal responses collected in the first and second studies, a categorization scheme emerged that illustrates the complex links between the different player-typical concepts (e.g., response, clarity, balance), properties (e.g., ease, richness, projection), and underlying themes (handling, sound and their relevance to the individual). A psycholinguistic analysis of the quality-relevant lexicon showed a diversity of linguistic devices borrowed mainly from four semantic fields (perceptual dimensions) related to texture-temperature (smooth vs. rough), action-presence (resonant vs. muted ), size-volume (deep vs. flat) and light (dark vs. bright). Richness, associated with the perceived amount of low-to-mid harmonics in the sound, was identified as a key perceptual factor in evaluating violin quality.
ii
iii
Résumé Cette thèse aborde le problème de l’évaluation perceptive des violons par des violonistes. La méthodologie de ce travail repose sur trois séries d’expériences contrôlées durant lesquelles des violonistes expérimentés ont eu accès à des instruments de différents modèles et de différentes époques et ont décrit leurs évaluations en répondant à une liste de questions ouvertes. Le travail s’est tout d’abord intéressé à la préférences globale pour se concentrer ensuite sur l’évaluation de certains attributs perceptifs du violon. Deux approches distinctes mais complémentaires ont été menées : une investigation systématique de la cohérence des jugements de préférence, et une analyse linguistique exploratoire des concepts exprimés lors de la verbalisation des préférences des instrumentistes. La première expérience avait pour but d’évaluer la cohérence des jugements de préférence exprimés par un même musicien, ainsi que d’un musicien à l’autre. Cette expérience a montré que les jugements des violonistes sont cohérents à l’échelle individuelle, et qu’il existe des différences significatives de ces jugements entre les musiciens. La deuxième expérience avait pour objectif de mieux comprendre l’origine des différences de jugements inter-individuelles et de mesurer si certains attributs des instruments influen¸caient les jugements de préférence. Les résultats de cette étude on montré que, bien que les violonistes s’accordent sur les qualités recherchées d’un instrument—principalement richesse du son et de fa¸con moindre la dynamique—la perception de ces qualités varie fortement d’un individu à l’autre. La troisième expérience menée pour cette thèse s’est donc concentrée sur l’évaluation de la richesse et de la dynamique dans un contexte de jeu libre (jeu d’une oeuvre musicale du répertoire classique) ainsi que dans un contexte de jeu plus contraint (jeu de certaines notes dans certains registres). La différence de perception de la richesse dans des tâches de jeu et d’écoute (à partir d’enregistrements sonores des tâches de jeu) a aussi été étudiée. Les résultats de ces études ont suggéré que la variabilité inter-musicien est grandement diminuée par le fait de spécifier le matériau musical et la technique du jeu: plus la tâche est contrainte et précise, plus les instrumentistes sont cohérents avec eux-mêmes et plus ils sont d’accord entre eux. Enfin, à partir des discussions recueillies lors des deux premières expériences, un schéma de catégorisation illustrant les liens complexes entre les concepts de la pratique musicale (la réponse, la clarté, l’équilibre), les attributs de l’instrument (la facilité de jeu, la richesse, la projection) et certains thèmes sous-jacents (le toucher, le son et leur pertinence pour chaque
iv
Résumé
individu) a été établi. Une analyse psycho-linguistique du lexique utilisé pour décrire la qualité a dévoilé la diversité des procédés linguistiques utilisés, s’organisant globalement en quatre champs sémantiques (dimensions de la perception): un axe texture-température (smooth vs. rough), un axe action-présence (résonant vs. assourdi ), un axe taille-volume (profond vs. plat) et finalement un axe lumière (sombre vs. brillant). La richesse, associée à la quantité per¸cue, dans le son, d’harmoniques de basse et moyenne fréquence, a été identifiée comme étant un facteur perceptif primordial dans l’évaluation de la qualité des violons.
v
Acknowledgments This dissertation would not have been made possible without the inspiring guidance, unwavering support and great enthusiasm of my advisor Gary Scavone and co-advisor Claudia Fritz. Gary’s openness for new ideas, combined with his experience in musical acoustics and Claudia’s expertise in violin perception, formed an important catalyst in this work. Also Bruno Giordano with his in-depth knowledge of experimental design and statistics has been indispensable as a collaborator. I want to extend my gratitude to Danièle Dubois and Catherine Guastavino for introducing me to psycholinguistics and grounded theory, respectively. During the various development stages of this project, I also received valuable input from Stephen McAdams, Jim Woodhouse, George Bissinger, Jean-Fran¸cois Petiot, Jacques Poitevineau, Lawrence Joseph, Marc Leman, Caroline Traube, Anders Askenfelt, Erika Donald, Christo Wood, Vincent Fréour, Alfonso Pérez, Vasileios Chatziioannou and Erwin Schoonderwaldt. I want to thank my colleagues at the Music Technology area, especially in the Computational Acoustic Modeling Laboratory (CAML), for their feedback, encouragement and the overall positive atmosphere. I am mostly grateful to Johanna Devaney, Andrew Hankinson and Jason Hockman for useful comments on language, grammar and style, to Bertrand Scherrer, Hossein Mansour and David Romblom for assisting with acoustical measurements and recordings, and to Darryl Cameron for technical support. Special thanks to Bertrand Scherrer for helping with the French version of the thesis abstract. I must thank my master’s thesis advisor Maarten van Walstijn for bringing the Music Technology area to my attention while I was studying at the Sonic Arts Research Centre in Belfast, Northern Ireland. Attending the annual violin acoustics workshop organized by the Violin Society of America at the Oberlin College in the summers of 2009, 2010 and 2011 has been a great learning experience. I want to thank all the luthiers, musicians and researchers who were there for fruitful discussions on the subject of violin quality. I am particularly grateful to Fan Tao for encouraging and facilitating my participation, and to Joseph Curtin for helping with acoustical measurements. Through generous funding by the Centre for Interdisciplinary Research in Music Media and Technology at McGill University (CIRMMT), I was able to visit l’équipe LutheriesAcoustique-Musique (LAM) in Paris during the springs of 2011 and 2012 and work closely with Claudia and Danièle. Without this opportunity, an important part of the work included
vi
Acknowledgments
in this thesis would not have been possible. I must thank Pascal Le Saëc for helping with technical issues, and Philippe Resche-Rigon for organizing a special wine, cheese and movie night in my honor. This research has been partially funded by CIRMMT and the Natural Sciences and Engineering Research Council of Canada (NSERC). I gratefully acknowledge the generosity of luthiers Tom Wilder (of Wilder & Davis), Olivier Pérot, Peter Purich, Denis Cormier and Isabelle Wilbaux, who lent the tested instruments. Violin shoulder rests were generously provided by Kun Shoulder Rest Inc. (Ottawa, Ontario, Canada). Experimental sessions took place at CIRMMT, hence my sincere thanks to the technical and administrative staff at the centre. Finally, this work would not have been made possible without the enthusiasm and patience of the 39 violinists who participated in the experiments. The treasured friendship of Anastasia Grekioti, Vasiliki Gatsiou, Xenia Pestova, Francis Gosselin, Patrick (Defasten) Doan, Gabriel Vigliensoni and Antonia Hernández, and the unexpected presence of Nik during the last year have helped to maintain appropriate levels of sanity and happiness. To them, and to my parents for their continuous love and support, I am forever indebted.
Dedication
Style is the sum of one’s imperfections. What one can’t do, as much as what one can. (Alan Bennett, The Habit of Art)
This dissertation is dedicated to Leoni Dalla and Konstantinos Chamarakis who have always believed in my imperfections
viii
ix
Contents List of figures
xix
List of tables
xxiii
Contribution of authors
xxv
1 Introduction 1.1 Motivation and objectives . . . . . . . . . . . . . . . . . . . . . . . . . . . . 1.2 The player perspective . . . . . . . . . . . . . . . . . . . . . . . . . . . . . 1.3 Content and organization . . . . . . . . . . . . . . . . . . . . . . . . . . . . 2 Background and method 2.1 The violin: An overview . . . . . . . 2.1.1 Lutherie . . . . . . . . . . . . 2.1.2 Acoustical behavior . . . . . . 2.1.3 Bridge mobility . . . . . . . . 2.2 Evaluating violin quality: Approaches 2.2.1 Listening tests . . . . . . . . . 2.2.2 Physical measurements . . . . 2.2.3 Timbral semantics . . . . . . 2.2.4 New versus old . . . . . . . . 2.3 Method: Design and analyses . . . . 2.3.1 Violins . . . . . . . . . . . . . 2.3.2 Choice of bow . . . . . . . . . 2.3.3 Visual occlusion . . . . . . . . 2.3.4 Acoustic environment . . . . .
. . . . . . . . . . . . . . . . . . . . . . . . . . . . . . . . . . . . and limitations . . . . . . . . . . . . . . . . . . . . . . . . . . . . . . . . . . . . . . . . . . . . . . . . . . . . . . . . . . . . . . . . . . . . . . . . . . . . . . . . .
. . . . . . . . . . . . . .
. . . . . . . . . . . . . .
. . . . . . . . . . . . . .
. . . . . . . . . . . . . .
. . . . . . . . . . . . . .
. . . . . . . . . . . . . .
. . . . . . . . . . . . . .
. . . . . . . . . . . . . .
. . . . . . . . . . . . . .
. . . . . . . . . . . . . .
. . . . . . . . . . . . . .
. . . . . . . . . . . . . .
.
.
.
.
1 1 3 5 7 7 8 10 12 14 15 18 21 23 25 26 26 27 28
x
Contents
2.4
2.3.5 Questionnaire design . . . . . . 2.3.6 Measuring reliability . . . . . . 2.3.7 Content analysis of verbal data Summary . . . . . . . . . . . . . . . .
. . . .
. . . .
. . . .
. . . .
. . . .
. . . .
. . . .
. . . .
. . . .
. . . .
. . . .
. . . .
3 A concordance analysis of preference judgments by experienced performers 3.1 Materials and methods . . . . . . . . . . . . . . . . . . . . . 3.1.1 Participants and violins . . . . . . . . . . . . . . . . 3.1.2 Questionnaire . . . . . . . . . . . . . . . . . . . . . . 3.1.3 Procedure . . . . . . . . . . . . . . . . . . . . . . . . 3.2 Analysis and results . . . . . . . . . . . . . . . . . . . . . . . 3.2.1 Intra- and inter-individual consistency . . . . . . . . 3.2.2 Variation of consistency within and between sessions 3.2.3 Influence of participant characteristics . . . . . . . . 3.2.4 Preference ranking of the violins . . . . . . . . . . . . 3.2.5 Preference profiles of participants . . . . . . . . . . . 3.2.6 Verbal descriptions of violin preference . . . . . . . . 3.3 Summary and discussion . . . . . . . . . . . . . . . . . . . . 3.4 Bonus: Trial 11 . . . . . . . . . . . . . . . . . . . . . . . . . 3.4.1 Procedure and questionnaire . . . . . . . . . . . . . . 3.4.2 Results and perspectives . . . . . . . . . . . . . . . . 4 Investigating the origin of inter-player differences in the preference for violins 4.1 Materials and methods . . . . . . . . . . . . . . . . 4.1.1 Participants and violins . . . . . . . . . . . 4.1.2 Questionnaire . . . . . . . . . . . . . . . . . 4.1.3 Criteria-scales . . . . . . . . . . . . . . . . . 4.1.4 Procedure . . . . . . . . . . . . . . . . . . . 4.2 Analysis and results . . . . . . . . . . . . . . . . . . 4.2.1 Intra- and inter-player consistency . . . . . . 4.2.2 Comparison with Study 1 . . . . . . . . . .
. . . . . . . .
. . . . . . . .
. . . . . . . .
. . . . . . . .
. . . . . . . .
. . . .
. . . . . . . . . . . . . . .
. . . . . . . .
. . . .
. . . .
. . . .
. . . . . . . . . . . . . . .
. . . .
. . . . . . . . . . . . . . .
. . . .
. . . . . . . . . . . . . . .
. . . .
. . . . . . . . . . . . . . .
. . . . .
28 28 30 31
. . . . . . . . . . . . . . .
33 33 34 34 36 37 37 40 42 43 44 45 45 48 49 49
. . . . . . . . . . . . . . .
. . . . . . . . . . . . . . .
. . . . . . . .
53 . . . . . . 53 . . . . . . . 54 . . . . . . 55 . . . . . . 55 . . . . . . . 57 . . . . . . 58 . . . . . . 59 . . . . . . 62
. . . .
.
Contents
4.3
xi
4.2.3 Influence of participant characteristics . . . . . . . . 4.2.4 Violin rating scores . . . . . . . . . . . . . . . . . . . 4.2.5 Preference and attribute profiles of participants . . . 4.2.6 Relationship between preference and attribute ratings Summary and discussion . . . . . . . . . . . . . . . . . . . .
5 Effects of task constraints and type on player 5.1 Materials and methods . . . . . . . . . . . . . 5.1.1 Participants and violins . . . . . . . . 5.1.2 Playing tasks . . . . . . . . . . . . . . 5.1.3 Recordings . . . . . . . . . . . . . . . . 5.1.4 Questionnaires . . . . . . . . . . . . . 5.1.5 Procedure . . . . . . . . . . . . . . . . 5.2 Constrained vs. unconstrained evaluations . . 5.2.1 Intra- and inter-player consistency . . . 5.2.2 Analysis of variance . . . . . . . . . . . 5.2.3 Comparisons with Studies 1 and 2 . . . 5.2.4 Influence of participant characteristics 5.2.5 Violin scores and participant profiles . 5.3 Playing vs. listening tasks . . . . . . . . . . . 5.3.1 Intra- and inter-player consistency . . . 5.3.2 Professional vs. amateur players . . . . 5.3.3 Violin scores and participant profiles . 5.4 Spectral interpretation of timbral richness . . 5.4.1 Spectral centroid . . . . . . . . . . . . 5.4.2 Tristimulus ratios . . . . . . . . . . . . 5.5 Summary and discussion . . . . . . . . . . . .
reliability . . . . . . . . . . . . . . . . . . . . . . . . . . . . . . . . . . . . . . . . . . . . . . . . . . . . . . . . . . . . . . . . . . . . . . . . . . . . . . . . . . . . . . . . . . . . . . . . . . . . . . . . . . . . . . . . . . . . . . . . . . . . . . . . . . . . . . . . . . . .
. . . . . . . . . . . . . . . . . . . .
. . . . .
. . . . . . . . . . . . . . . . . . . .
6 Conceptualizing violin quality: Categorization and lexicon 6.1 Data review and coding . . . . . . . . . . . . . . . . . . . . . 6.2 Analysis . . . . . . . . . . . . . . . . . . . . . . . . . . . . . . 6.2.1 Handling the violin . . . . . . . . . . . . . . . . . . . . 6.2.2 The sound of the violin . . . . . . . . . . . . . . . . . .
. . . . .
. . . . . . . . . . . . . . . . . . . .
. . . .
. . . . .
. . . . . . . . . . . . . . . . . . . .
. . . .
. . . . .
. . . . . . . . . . . . . . . . . . . .
. . . .
. . . . .
. . . . . . . . . . . . . . . . . . . .
. . . .
. . . . .
. . . . . . . . . . . . . . . . . . . .
. . . .
. . . . .
. 63 . 65 . . 67 . . 67 . 72
. . . . . . . . . . . . . . . . . . . .
. . . . . . . . . . . . . . . . . . . .
75 76 76 . 77 79 79 . 81 83 . 84 . 87 . 87 . 91 . 91 93 . 97 . 97 98 100 . 101 102 103
. . . .
109 109 . 111 . 111 112
. . . .
xii
Contents
6.3 6.4
6.5 6.6
6.2.3 Balance across strings 6.2.4 Relevance to the player Results . . . . . . . . . . . . . Lexicon . . . . . . . . . . . . 6.4.1 Objects of reference . . 6.4.2 Linguistic devices . . . Semantic fields . . . . . . . . Summary and discussion . . .
7 Conclusions 7.1 Summary and contributions 7.1.1 Player reliability . . 7.1.2 Player verbalization . 7.2 Future directions . . . . . .
. . . .
. . . . . . . .
. . . .
. . . . . . . .
. . . .
. . . . . . . .
. . . .
. . . . . . . .
. . . .
. . . . . . . .
. . . .
. . . . . . . .
. . . .
. . . . . . . .
. . . .
. . . . . . . .
. . . .
. . . . . . . .
. . . .
. . . . . . . .
. . . .
. . . . . . . .
. . . .
. . . . . . . .
. . . .
. . . . . . . .
. . . .
. . . . . . . .
. . . .
. . . . . . . .
. . . .
. . . . . . . .
. . . .
. . . . . . . .
. . . .
. . . . . . . .
. . . .
. . . . . . . .
. . . .
. . . . . . . .
. . . .
. . . . . . . .
. . . .
. . . . . . . .
. . . .
. . . . . . . .
. . . .
. . . . . . . .
. 113 . 116 . 116 . 120 . . 127 . 128 . 129 . 133
. . . .
137 . 137 138 140 . 141
. . . .
Appendix: Original verbal responses and coding scheme
145
Bibliography
173
xiii
List of figures 1.1
2.1
From the dynamic behavior of a violin to its perceived quality via the player perspective: sound and vibration sensation are perceived via the auditory and haptic modalities respectively; an aesthetic-evaluative dimension also contributes to the overall sensory experience. . . . . . . . . . . . . . . . . . .
4
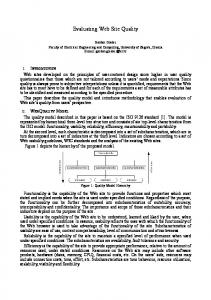
Front and side view of a lira da braccio by Giovanni Maria da Brescia, Venice, ca. 1525. The instrument is located in the Hill Collection of the Ashmolean Museum at the University of Oxford, UK. Taken from Boyden (1965). . . . 9 2.2 The different parts of the violin and bow. Taken from Rossing (1982). . . . 10 2.3 Input admittance of a violin, obtained by exciting the G-string corner of the bridge with a miniature force hammer (PCB 086E80) and measuring the velocity at the E-string corner of the bridge with a laser Doppler vibrometer (Polytec PDV 100). The magnitude and phase are shown in the top and bottom plots respectively. Some of the “signature” modes (see text) can be observed in the open string region, below about 600 Hz: the Helmholtz-type cavity mode A0 at around 280 Hz and the corpus bending mode B1+ just above 500 Hz. The hill-like collection of peaks known as the “BH peak” (see text) can be discerned in the vicinity of 2–2.5 kHz. . . . . . . . . . . . . . 13 2.4 One of the violinists that took part in the third study, wearing dark sunglasses and playing with his own bow. . . . . . . . . . . . . . . . . . . . . . . . . . . 27
xiv 3.1
3.2 3.3 3.4
3.5
3.6
3.7
4.1 4.2
List of figures Distribution of intra- and inter-individual ⇢c coefficients: 1 corresponds to perfect consistency, 0 corresponds to no consistency, -1 corresponds to perfect anti-consistency (i.e., exactly opposite rankings given on different trials). The symbols above the histograms report the across-participants average of the intra- and inter-individual consistency scores (error-bar = 95% confidence interval of the mean; the ordinate for the symbols has been chosen arbitrarily for display purposes). . . . . . . . . . . . . . . . . . . . . . . . . . . . . . . Variation of inter-individual agreement (upper graph) and intra-individual consistency (lower graph) within and across the 10 preference-ranking trials. Measures of intra- and inter-player consistency for each participant. Solid lines show least-squares fitting to the data. . . . . . . . . . . . . . . . . . . Different measures of intra-individual consistency for each participant. “Acrosssession” refers to averaging ⇢c coefficients for the same individual from both sessions, whereas “inter-session” is the average of the intra-individual scores computed by averaging ⇢c coefficients for the same individual in different sessions. . . . . . . . . . . . . . . . . . . . . . . . . . . . . . . . . . . . . . . Spearman rank correlation between intra-individual consistency and selfreported participant characteristics: ⇢S coefficients are reported at the upper right corners; solid lines show least-squares fitting to the data. . . . . . . . Across-participants average of the preference score for each violin (error-bar = 95% confidence interval of the mean). The violins are ordered by ascending preference. . . . . . . . . . . . . . . . . . . . . . . . . . . . . . . . . . . . . Agglomerative hierarchical cluster analysis on pairwise participant-specific preference profiles. The horizontal solid and dashed lines that connect individuals and clusters indicate their respective correlations. The preference profiles corresponding to each cluster are reported in Table 3.2. . . . . . . . .
38 39 40
41
42
43
44
Testing interface used to collect the ratings . . . . . . . . . . . . . . . . . . . 57 Distribution of intra- and inter-individual ⇢c coefficients: 1 corresponds to perfect consistency, 0 corresponds to no consistency, -1 corresponds to perfect anti-consistency (i.e., exactly opposite rankings given on different trials). . 60
List of figures 4.3
4.4
4.5 4.6 4.7
4.8
4.9
4.10
4.11
xv
Left plot: Across-participants average intra- and inter-individual consistency scores for each of the attribute-rating scales and preference; note the partcicularly low levels of self-consistency in all scales. Right plot: Partial Spearman rank correlation between each of the attribute-rating scales and preference; only the attributes of richness and, to a lesser extent, dynamic range were singificantly correlated with overall preference (shown in darker color). . . . 61 Variation of intra-individual consistency (left graph) and inter-individual agreement (middle graph) within and across the three blocks of repetitions (legends apply to both plots; note that it is not possible to measure withinblock intra-individual consistency). Right graph: Across-participants average inter-scale self-correlation within each block of repetitions. . . . . . . . . . 62 Across-scales average intra-individual consistency for each of the participants (error bar = 95% confidence interval of the mean). . . . . . . . . . . . . . . 63 Measures of intra-individual consistency versus inter-individual agreement for each participant. Solid lines show least-squares fitting to the data. . . . . 64 Spearman rank correlation between intra-individual consistency and selfreported participant characteristics for the preference scale: ⇢S coefficients are reported at the upper right corners; solid lines show least-squares fitting to the data. . . . . . . . . . . . . . . . . . . . . . . . . . . . . . . . . . . . 65 Spearman rank correlation between intra-individual consistency and selfreported participant characteristics for each of the attribute-rating scales: ⇢S coefficients are reported at the upper right corners; solid lines show least-squares fitting to the data. . . . . . . . . . . . . . . . . . . . . . . . . 66 Across-participants across-trials average rating scores for each violin (error bar = 95% confidence interval of the mean). For all scales, violins are ordered by increasing preference score (shaded background). . . . . . . . . . . . . . 69 Agglomerative hierarchical cluster analysis on pairwise participant-specific preference and attribute profiles. The horizontal solid and dashed lines that connect individuals and clusters indicate their respective correlations. . . . 70 Multiple rank-regression of preference ratings on the ratings along the attribute scales. The very high R2 value is likely a result of the experimental design: rating all scales simultaneously prompted a very economic response strategy. . . . . . . . . . . . . . . . . . . . . . . . . . . . . . . . . . . . . . . 71
xvi 5.1 5.2 5.3 5.4
5.5
5.6
5.7
5.8
List of figures Playing tasks (musical material and technique) used in Study 3 for the perceptual evaluation of violin richness and dynamic range. . . . . . . . . . Recording setup: two cardioid microphones configured in X-Y stereo coincident position and one free-field microphone. . . . . . . . . . . . . . . . . . Testing interface used to collect the ranking-ratings and limit of acceptability (example for the case of richness) . . . . . . . . . . . . . . . . . . . . . . . Distribution of intra- and inter-individual ⇢c coefficients for each of the constrained and unconstrained playing tasks: 1 corresponds to perfect consistency, 0 corresponds to no consistency, -1 corresponds to perfect anti-consistency (i.e., exactly opposite rankings given on different trials). Symbols: R = Richness; DR = Dynamic Range; P = Preference; c = constrained; u = unconstrained. . . . . . . . . . . . . . . . . . . . . . . . . . . . . . . . . . . Across-participants average intra- and inter-individual consistency scores for each of the constrained and unconstrained playing tasks (error bar = 95% confidence interval of the mean). See Sec. 2.3.6 for details on averaging of concordance correlations. Confidence intervals for inter-individual averages should be treated with caution beause of dependency issues. . . . . . . . . Across-tasks average intra-individual consistency for each of the participants (averaged across playing tasks only; error bar = 95% confidence interval of the mean). . . . . . . . . . . . . . . . . . . . . . . . . . . . . . . . . . . . . . Measures of intra-individual consistency (axis labeled ”self-consistency”) versus inter-individual agreement (axis labeled “agreement”) for each participant in constrained vs. unconstrained playing tasks. Solid lines show least-squares fitting to the data. Symbols: R = Richness; DR = Dynamic Range; P = Preference; c = constrained; u = unconstrained. . . . . . . . . . . . . . . . Variation of intra-individual consistency (left graph) and inter-individual agreement (right graph) within and across the three blocks of repetitions. Symbols: R = Richness; DR = Dynamic Range; P = Preference; c = constrained; u = unconstrained. . . . . . . . . . . . . . . . . . . . . . . . .
78 82 83
85
86
87
88
89
List of figures 5.9
5.10
5.11
5.12
5.13 5.14
5.15
xvii
Spearman rank correlation between intra-individual consistency and selfreported participant characteristics for each of the playing tasks: ⇢S coefficients are reported at the upper right corners; solid lines show least-squares fitting to the data. Symbols: R = Richness; DR = Dynamic Range; P = Preference; c = constrained; u = unconstrained. . . . . . . . . . . . . . . . 92 Across-participants across-trials average rating scores for each violin (error bar = 95% confidence interval of the mean). Symbols: R = Richness; DR = Dynamic Range; P = Preference; c = constrained; u = unconstrained. . . . . 94 Agglomerative hierarchical cluster analysis on pairwise participant-specific profiles for each of the constrained and unconstrained playing tasks. The horizontal solid and dashed lines that connect individuals and clusters indicate their respective correlations. Symbols: R = Richness; DR = Dynamic Range; P = Preference; c = constrained; u = unconstrained. . . . . . . . . . . . . 96 Distribution of intra- and inter-individual ⇢c coefficients in the playing vs. listening tasks: 1 corresponds to perfect consistency, 0 corresponds to no consistency, -1 corresponds to perfect anti-consistency (i.e., exactly opposite rankings given on different trials). The symbols above the histograms report the across-participants average of the intra- and inter-individual consistency scores (error bar = 95% confidence interval of the mean; the ordinate for the symbols has been chosen arbitrarily for display purposes). . . . . . . . . . . 98 Scatter plot of the measures of intra-individual consistency in the richness playing (R-P) vs. listening (R-L) tasks . . . . . . . . . . . . . . . . . . . . 98 Across-participants across-trials average of richness ratings for each violin in the richness playing (R-P) vs. listening (R-L) tasks (error bar = 95% confidence interval of the mean). Violins B and A were evaluated as the most and least rich, respectively, in both settings. . . . . . . . . . . . . . . . . . 99 Agglomerative hierarchical cluster analysis on pairwise participant-specific profiles for the richness playing (R-P) vs. listening (R-L) tasks. The horizontal solid and dashed lines that connect individuals and clusters indicate their respective correlations. . . . . . . . . . . . . . . . . . . . . . . . . . . . . . 100
xviii
List of figures
5.16 Boxplots of across-participants spectral centroid values for each of the first eight notes of the chromatic scale G2 ! D3 and for each of the five violins (labelled A–E). The violin perceived as most rich (shaded background) has the lowest spectral centroid value in almost all notes. Note that the large variability is likely a result of variations in the applied bow force between violinists (Schoonderwaldt, 2009c). . . . . . . . . . . . . . . . . . . . . . . 102 5.17 Boxplots of across-participants tristimulus 1 versus 3 values for each of the first eight notes of the chromatic scale G2 ! D3 and for each of the five violins (labelled A–E). For many of the notes, the violin perceived as most rich (shaded background) has the highest T 1 and lowest T 3 values. . . . . . 104 5.18 Boxplots of across-participants tristimulus 2 values for each of the first eight notes of the chromatic scale G2 ! D3 and for each of the five violins (labelled A–E). For some of the notes, the violin perceived as most rich (shaded background) has the highest T 2 value. . . . . . . . . . . . . . . . . 105 6.1
6.2
6.3
6.4
6.5
Concept map of emerging concepts, their Properties and underlying THEMES in player verbal descriptions of violin quality evaluation. The size of the circles corresponds to the different levels of categorization; lines indicate how different concepts link to each other (lengths are arbitrary). . Emerging concepts of violin quality in verbal descriptions by experienced performers collected in Study 1 (questions A1–A3 and B2) and total occurrence (normalized) across participants . . . . . . . . . . . . . . . . . . . . . Emerging concepts and Properties of violin quality in verbal descriptions by experienced performers collected in Study 2 (question B2 only) and total occurrence (normalized) across participants . . . . . . . . . . . . . . . . . . Comparison between preference-based and context-free verbal descriptions of violin quality (normalized occurrence; concepts and Properties are ordered as per Table 6.1) . . . . . . . . . . . . . . . . . . . . . . . . . . . . . . . . Comparing preference ranking criteria that determined the most- and leastpreferred violins (normalized occurrence; concepts and Properties are ordered as per Table 6.1) . . . . . . . . . . . . . . . . . . . . . . . . . . . .
115
118
119
. 121
122
List of figures 6.6
xix
A theoretical illustration of establishing links between the dynamic behavior of a violin (gray color) and its perceived sound qualities (black color) based on the proposed acoustical interpretations for the semantic fields of texturetemperature, size-volume and action-presence (see text). Dotted lines indicate the need for empirical investigations. . . . . . . . . . . . . . . . . . . . . . 132
xx
xxi
List of tables 3.1
3.2 3.3
4.1
Violins used in Study 1 along with preference score averaged across participants (0 = never preferred to any other violin; 1 = always preferred to all other violins; 95% confidence interval of the mean in parentheses). The most preferred violin (F) is indicated in bold and the least preferred violin (H) in italics. . . . . . . . . . . . . . . . . . . . . . . . . . . . . . . . . . . . . . . Average violin preference profile for each cluster of participants (figure dashes indicate tied ranks). . . . . . . . . . . . . . . . . . . . . . . . . . . . . . . . Free verbal descriptions for violin preference ranking criteria extracted from participant responses to question A1 (number N of occurrences across participants reported in parentheses except for descriptions with fewer than 2 occurrences). For the purposes of Study 2, only those attributes mentioned by at least 5 participants were considered and only the three indicated in bold used. The various verbalizations semantically related to “balance” (across the strings) are indicated in italics. . . . . . . . . . . . . . . . . . . . . . . . .
35 45
46
Violins used in Study 2. The most preferred violin (C) is indicated in bold and the least preferred violin (I) in italics. Violin H was included in Study 1 (labeled F, highest preference score). . . . . . . . . . . . . . . . . . . . . . . 54 4.2 Left and middle columns: Across-participants average intra-individual consistency and inter-individual agreement measures for each of the attribute-rating scales and preference. Right column: Partial Spearman rank correlation between each of the attribute-rating scales and preference. For 95% confidence intervals of the averages, the reader is referred to Fig. 4.3. . . . . . . . . . 63
xxii 4.3
List of tables Top: Across-participants across-trials average violin rating scores. Bottom: Proportion of times a violin was rated higher than any of the other violins throughout all trials (average rank). Parentheses report the 95% confidence interval of the mean. The differences observed are negligible and the two ways of ordering the violins are substantially similar for each scale. . . . . .
68
5.1
Violins used in Study 3. Violin D was included in Study 1 (labelled F, highest preference score) and Study 2 (labelled H). . . . . . . . . . . . . . . . . . . . 77 5.2 Across-participants average intra-individual consistency and inter-individual agreement measures for each of the constrained and unconstrained tasks as well as the listening task. . . . . . . . . . . . . . . . . . . . . . . . . . . . . 90 5.3 Across-participants average ratings (upper table), ranks (middle table) and acceptability scores (lower table) of the violins. Ranks represent the proportion of times a violin was rated higher than any of the other violins throughout all trials. Acceptability scores indicate the proportion of times a violin was characterized as acceptable. Parentheses report the 95% confidence interval of the mean. . . . . . . . . . . . . . . . . . . . . . . . . . . . . . . . . . . . 95 6.1 6.2
Coding scheme for the conceptualization of violin quality. . . . . . . . . . . . 114 Distribution of concepts within and across questions in Study 1 (S-1; occurrences collapsed across sessions because of similar distributions) and Study 2 (S-2). Descriptions of situations defined by each question, number of extracted phrasings (N ) and a color guide for subsequent charts are provided in the lower part. Normalized occurrences (%) are computed as the number of coded phrasings (#) over that of total extracted phrasings (N ). . . . . . . 117 6.3 Lexicon used by violinists in Study 1 (questions A1–A3 and B2) to describe desirable (+) quality characteristics, aggregated by morphological family and sometimes direct French-to-English translation, and sorted according to previously identified THEMES of violin quality evaluation as well as the concept of balance across strings. Parentheses show total occurrence across participants and questions. . . . . . . . . . . . . . . . . . . . . . . . 122
List of tables 6.4
6.5
xxiii
Lexicon used by violinists in Study 1 (questions A1–A3 and B2) to describe undesirable (-) quality characteristics, aggregated by morphological family and sometimes direct French-to-English translation, and sorted according to previously identified THEMES of violin quality evaluation as well as the concept of balance across strings. Parentheses show total occurrence across participants and questions. . . . . . . . . . . . . . . . . . . . . . . . 125 Lexicon used by violinists in Study 2 (question B2) to describe desirable (+) and undesirable (-) quality characteristics, aggregated by morphological family and sometimes direct French-to-English translation, and sorted according to previously identified THEMES of violin quality evaluation as well as the concept of balance across strings. Parentheses show total occurrence across participants and questions. . . . . . . . . . . . . . . . . . . . . . . . 126
xxiv
xxv
Contribution of authors This thesis, and the research to which it refers, is the candidate’s own original work except for commonly understood and accepted ideas or where explicit reference to the work of other people, published or otherwise, is made. The dissertation is formatted as a monograph comprising seven chapters and includes contents from the following journal and conference publications (in reverse chronological order): • Chapter 5: Saitis, C., Scavone, G. P., Fritz, C., and Giordano, B. L. (2013c). “Evaluating violin quality: A comparison of player reliability in contrained vs. unconstrained tasks”, in Proc. Stockholm Music Acoust. Conf., 109–114 (Stockholm, Sweden). • Chapters 2 and 6: Saitis, C., Fritz, C., Guastavino, C., and Scavone, G. P. (2013b). “Conceptualization of violin quality by experienced performers”, in Proc. Stockholm Music Acoust. Conf., 123–128 (Stockholm, Sweden). • Chapter 5: Saitis, C., Scavone, G. P., Fritz, C., and Giordano, B. L. (2013a). “Perceptual evaluation of violins: A comparison of intra-individual agreement in playing vs. listening tasks for the case of richness”, in Proc. Meetings Acoust. 19, 035029 (Montreal, Quebec, Canada). • Chapters 2, 3, and 4: Saitis, C., Giordano, B. L., Fritz, C., and Scavone, G. P. (2012c). “Perceptual evaluation of violins: A quantitative analysis of preference judgments by experienced players”, J. Acoust. Soc. Am. 132, 4002–4012. • Chapter 2: Saitis, C., Fritz, C., Giordano, B. L. and Scavone, G. P. (2012a). “Bridge admittance measurements of 10 preference-rated violins”, in Proc. Acoustics 2012, 3599–3604 (Nantes, France).
xxvi
Contribution of authors
• Chapter 2: Saitis, C., Giordano, B. L., Fritz, C., and Scavone, G. P. (2011b). “Aspects of experimental design for the perceptual evaluation of violin qualities”, Canadian Acoustics 39, 134–135. • Chapter 4: Saitis, C., Giordano, B. L., Fritz, C., and Scavone, G. P. (2011a). “Investigating the origin of inter-individual differences in the preference for violins”, in Proc. Forum Acusticum, 497–501 (Aalborg, Denmark). The candidate was responsible for every step involved in designing and carrying out all experiments mentioned in this dissertation, as well as analyzing collected data and preparing manuscripts for all the publications listed above. Gary P. Scavone, a thesis co-advisor, provided necessary funding, laboratory equipments and space. Dr. Scavone and Claudia Fritz, a thesis co-advisor working at l’équipe Lutheries-Acoustique-Musique (LAM) of l’Institut Jean le Rond d’Alembert in the Université Pierre et Marie Curie (Paris, France), contributed with guidance in experimental planning, data analysis and interpretation of the results. Bruno L. Giordano, former Research Associate at the Music Perception and Cognition Laboratory (MPCL) of McGill University and current Marie Curie Research Fellow at the University of Glasgow (United Kingdom), worked closely with the candidate on the design of Study 1 in Chap. 3 and Study 2 in Chap. 4, and contributed to the statistical analyses. The content analysis of collected verbal data described in Chap. 6 was planned with input from Catherine Guastavino, who is an Associate Professor at the School of Information Studies of McGill University.
1
Chapter 1 Introduction It was the Greek mathematician and philosopher Pythagoras in the sixth century B.C. who noted that the relative length ratios of the monochord string corresponded to musical intervals characterized as consonant. By reducing a subjective sensory experience to a mathematical relation, Pythagoras established the long-standing scientific goal of finding relationships between measurable physical properties of sound-producing objects such as musical instruments and their perceived characteristics. From Pythagoras to Helmholtz (1863, 1954) and from Raman (1918) to Cremer (1984), the vibrations of the bowed string are reasonably well-understood today. From Savart’s trapezoidal violin to the advent of computational (e.g., finite element modeling) and experimental (e.g., laser-Doppler vibrometry) modal analysis methods in the last decades, the vibrations of the violin body are also comprehensively understood (e.g., Roberts, 1986; Bissinger and Kuntao, 2000). More recent work has studied the control of bowing parameters in violin performance (bow force, bow velocity and bow-bridge distance) and their coordination, which allow the player to access the high musical expressivity of the instrument (Guettler, 2002; Demoucron, 2008; Schoonderwaldt, 2009a). However, there is still little practical knowledge and understanding of how the dynamic behavior of a violin relates to its perceived quality.
1.1 Motivation and objectives For a period spanning more than ten years, Bissinger conducted a wide range of acoustical and structural dynamics measurements on seventeen violins (Bissinger, 2008). Those
2
Introduction
instruments were quality-rated from “bad” to “excellent” by a professional player and Bissinger himself. Attempts to quantify the characteristics of “excellent” violins were largely inconclusive, which led Bissinger to remark: Perhaps a contrarian viewpoint about quality might be useful here? What truly defines violin excellence? If the answer is truly excellent violinists, then the reliability-reproducibility of their psychoacoustic judgments must draw more attention. It would seem illogical to expect violinists who pride themselves on their personal sound not to prefer certain violins over others because they are better at creating that sound. If excellent violinists cannot agree on a quality rating because of sound preferences—or worse, rate two quite different sounding violins as good—shouldn’t it follow that scientific measurements could do no better?1 The research presented here takes this “contrarian” perspective as a starting point and aims to contribute to the understanding of the following three issues pertinent to the perceptual evaluation of violin quality: • How to design reliable empirical tests to access the perceptual and cognitive processes involved when the player interacts with the instrument. • How consistent are experienced performers at assessing violins and whether there is agreement between individuals. • How violin quality is conceptualized in verbalizations by experienced performers. Concerning the first research question, a carefully controlled playing-based evaluation procedure was designed to investigate the processes involved when the player compares different violins in a musical setting—for example, during the process of choosing a new instrument (see Fritz et al., 2007, p. 3649). In three violin-playing studies, experienced musicians assessed violins of different make and age, and described their choices in open-ended questionnaires. The focus was gradually narrowed from examining overall preference to the evaluation of certain perceptual attributes of the instrument. All studies were experimentally 1
This last comment may be an overstatement. As McIntyre and Woodhouse (1978) remarked, “while acknowledging that standard acoustical measurements have their uses, we must guard against the assumption that such measurements can capture everything significant about a musical sound.”
1.2 The player perspective
3
oriented, with particular emphasis given to the design of conditions that are ecologically valid and musically meaningful to the performer (e.g., playing versus listening, comparing different instruments like in a violin workshop, using own bow, allowing time to familiarize with the different violins, developing own strategy for evaluating quality). To address the second and third research questions defined above, two distinct yet complementary approaches were followed: a systematic investigation of intra-individual consistency and inter-individual agreement in preference judgments, and an exploratory analysis of concepts emerging from spontaneous preference and quality verbalizations.
1.2 The player perspective The violin, as with any musical instrument, is part of a system that involves the player. In fact, the violin, player, and bow form an elaborate system of interactions where the sounds created by the interaction between the bow and the instrument are shaped by the player. The perspective of the violinist is therefore essential in developing an understanding of how one instrument differs from another (see upper part of Fig. 1.1). It should be noted that the influence of the bow is also of critical importance but this aspect will not be addressed in any detail in this dissertation. Figure 1.1 (lower part) schematizes the interactions between the player, bow, and instrument. As Traube (2004) noticed, the perspective of the player is at the same time that of a musician and a listener. To the bowing of the string, the violin responds by providing information communicated to the player-musician via tactile and proprioceptive channels (e.g., hands, arms, chin) and by producing a sound processed by the player-listener though the acoustic environment and auditory modality. The combined audio-haptic information is also perceived in an aesthetic-evaluative dimension grounded in musical and emotional situations relevant to the player-musician-listener (see, e.g., Fritz et al., 2010a). More importantly, vibrations are capable of providing the musician with cues that contribute to the perception of the radiated sound, so that the player can assess their interaction with the instrument cross-modally (Nichols, 2003). Askenfelt and Jansson (1992) argued that the tactile-kinesthetic feedback due to vibration sensation and finger touch facilitates intonation and timing during violin performance. Woodhouse (1993a,b) pointed out that what distinguishes one violin from another lies not only on its perceived sound quality, but also on ergonomic considerations, as in how the violinist feels the instrument or
4
Introduction
Player perspective
Dynamic behavior
Auditory modality Violin player
Perceived quality
Acoustic environment Bowed string
Vibrating body
Radiated sound
Haptic modalities Musical and affective relevance
Figure 1.1 From the dynamic behavior of a violin to its perceived quality via the player perspective: sound and vibration sensation are perceived via the auditory and haptic modalities respectively; an aesthetic-evaluative dimension also contributes to the overall sensory experience.
1.3 Content and organization
5
how easy it is to control, which he called “playability.” Woodhouse went on suggesting a link between the minimum amount of bow force required for pp playing and the playability of a violin. Schoonderwaldt et al. (2008) argued that this aspect of bow control may not be as important for the performer as the limits of the maximum bow force. More recent results indicate the presence of tactile-only cues in the perception of violin quality by performers (Wollman et al., 2012). When evaluating their interaction with the violin, players intuitively describe perceived qualities related to the sound or the vibration sensation calling upon a diverse vocabulary— for example, rich sound, responsive instrument, balance across strings, and clarity in the note. These descriptions are not always specific to the violin (e.g., Traube, 2004; Bernays and Traube, 2011) and are traditionally communicated from teacher to student. As this lexicon is often taken for granted in the design of perceptual tests, it is important to look into its semantic dimensions.
1.3 Content and organization The dissertation is structured as follows: • Chapter 2 defines the theoretical background and research methods for the thesis. Following a basic description of the lutherie and acoustical behavior of the violin, previous research approaches to instrument quality evaluation are reviewed. Limitations concerning the questions of player reliability and verbalization are highlighted. Finally, the experimental and analytical methods for the subsequent studies are presented. • Chapter 3 (Study 1) presents a quantitative analysis of violin preference judgments by experienced performers. Repetitive preference rankings are examined in terms of intra-individual consistency and inter-individual agreement. Two hypotheses about the origin of inter-individual differences are discussed. A preliminary analysis of verbal descriptions is presented, from which preference-associated attributes of the violin are extracted and then used to design rating scales for a subsequent study. A short study about the extent to which a violin’s look may influence preference is also reported. • Chapter 4 (Study 2) investigates the origin of inter-player differences in the preference for violins observed in Study 1 and measures the extent to which different attributes
6
Introduction are associated with preference. Repetitive violin ratings on certain attributes (mainly extracted from verbal responses collected in Study 1), as well as preference, are examined in terms of intra- and inter-player consistency. Methodological comparisons with Study 1 and some considerations about the variability in the preference for violins are discussed. • Chapter 5 (Study 3) examines intra-individual consistency and inter-individual agreement in repetitive violin ratings-rankings from (a) constrained (playing only certain notes in certain registers) versus unconstrained (playing a certain excerpt from the violin repertoire) evaluation tasks for the cases of richness and dynamic range; (b) playing versus listening (using recorded sounds from the constrained-playing task) settings for the case of richness. This study was focused on the perceptual characteristics of richness and dynamic range as they had been previously found to be highly correlated with violin preference (Study 2). Methodological comparisons with Studies 1 and 2 are discussed. The potential correlation of spectral centroid and the three tristimulus ratios with the perception of violin sound richness are also examined. • Chapter 6 explores how violin quality is conceptualized by experienced performers. The different player-typical concepts emerging in impromptu free-format verbal descriptions of violin preference and quality collected in Studies 1 and 2 are identified. Inter-categorical links are then established. A psycholinguistic analysis of the qualityrelevant lexicon is also reported. Semantic dimensions underlying violin sound quality descriptions and some acoustical interpretations are discussed. • Chapter 7 summarizes and discusses the main contributions of the dissertation, concluding with suggestions for future directions.
7
Chapter 2 Background and method In this chapter, the theoretical background and research methods for the subsequent studies is presented. Section 2.1 gives an overview of the lutherie and acoustical behavior of the violin. Section 2.2 reviews literature relevant to the perceptual evaluation of violin quality. This section has been organized according to different research practices and how they relate to the questions of player reliability and verbalization in evaluating violin quality (see Sec. 1.1). Limitations in previous approaches are discussed, which inform the research design outlined in Sec. 2.3.
2.1 The violin: An overview The violin has its origins in the various rebecs and fiddles played in medieval Europe (Rossing, 2010). Rebecs themselves were closely related to the Arabian rabab and the Byzantine lyra, and developed mainly in Southern Europe. They generally had a pear-shaped body with a variety of differently shaped sound holes and without a distinct neck. Medieval fiddles were mostly used in Northern Europe, such as the vielle in France and the giga in Norway. They usually had a distinct, narrow neck attached to a much wider body with C-shaped soundholes. During the late Renaissance, two families of bowed string instruments with noticeably different construction and musical role emerged. The viol or viola da gamba (i.e., played between the legs) probably developed from the vihuela da mano, a plucked string instrument used in the Iberian peninsula that preceded the guitar (Woodfield and Robinson, online). Pio (2011) recently suggested that the viola da gamba developed autonomously in Italy,
8
Background and method
more particularly in Venice. The body of the viol had a flat back, an arched bridge, a long, fretted fingerboard and middle bouts that allowed for easier bowing of the outermost strings. The number of strings was typically six. The lira da braccio (i.e., played on the shoulder) developed from the medieval fiddle (Brown and Jones, online). By the late fifteenth century, it was gradually refined to a characteristic violin-like body with f -curved soundholes, a flat bridge, a short, wide and fretless fingerboard, and a leaf-shaped pegbox with frontal pegs (see Fig. 2.1). There were generally seven strings, five on the fingerboard and two off the fingerboard used as drones. The strings in both viols and liras were normally tuned in fourths or thirds unlike the often used fifths in rebecs. The violin as we know it today developed around Cremona in Northern Italy and can be seen as the result of applying the tuning of the rebec to the body of the lira da braccio (Campbell et al., 2004). As the new instrument quickly established itself, the viol retained its distinct musical role until the eighteenth century, after which the more refined violin design prevailed (Rossing, 2010). The transition from baroque to classical music performance led to a few further modifications in the second half of the eighteenth century, such as a longer, narrower neck and fingerboard, and a stiffer bass bar. The construction of the bow was also standardized around the same time by Fran¸cois Tourte in France. 2.1.1 Lutherie Figure 2.2 shows the different steps in the construction of the violin. Its structure can be considered as having two main parts: the body and the strings and string-holding components such as the neck, the pegbox, the fingerboard and the tailpiece (Jansson, 2002). The body is a hollow box, comprising an arched top plate with f -shaped soundholes and an arched back plate joined by supporting sides known as “ribs.” Its shape incorporates an upper and a lower outward-curving bouts separated by a concave middle bout, the latter facilitating access of the bow to the highest and lowest strings and hence complex bowing gestures. The height of the ribs slightly varies from the upper to the lower bouts. Inside the body, a soundpost is wedged between the top and back plates, close to the foot of the bridge below the E-string corner (hereafter the right foot), a tapered bass bar is placed beneath the top plate close to the foot of the bridge below the G-string corner (hereafter the left foot), and six blocks are placed at the corners formed between the bouts to enhance
2.1 The violin: An overview
9
Figure 2.1 Front and side view of a lira da braccio by Giovanni Maria da Brescia, Venice, ca. 1525. The instrument is located in the Hill Collection of the Ashmolean Museum at the University of Oxford, UK. Taken from Boyden (1965).
structural rigidity (Fletcher and Rossing, 1998; Gough, 2007). The neck is attached to the upper part of the body. The fingerboard is placed on the neck, extending over the top plate towards the bridge. The tailpiece is fastened on the lower part of the body and similarly extends towards the other side of the bridge. The four strings are anchored in the upper end of the tailpiece, strung over the bridge and stretch along the fingerboard to the pegbox. In standard tuning, the fundamental frequencies of the open strings are G3 (196 Hz), D4 (293.7 Hz), A4 (440 Hz) and E5 (659.3 Hz). The very large pressures exerted by the stretched strings on the bridge are supported, in part, by the soundpost and the bass bar. The former is a very thin wood dowel fitted between the top and back plates (not glued) very close to the right foot of the bridge. The bass bar is a wood beam of tapered shape, glued along the inside of the top plate close to the left foot of the bridge (Rossing, 2010; Boyden et al., online). Typically the top plate, soundpost and bass bar are made of spruce while maple is preferred for the back plate, ribs, neck, pegbox, scroll and bridge. The fingerboard and tailpiece are carved from ebony. The various joints are glued using boiled animal hide, a glue that provides great flexibility in terms of removing parts to carry out repairs. The surface of the body, neck, pegbox and scroll is finally varnished for purposes of protection, flexibility and visual appeal (Campbell et al., 2004). Strings were originally made of catgut but modern strings largely use steel or other synthetic materials (e.g., nylon) as their core. The lowest and two middle strings are commonly wound with silver wire to improve response
10
Background and method
Figure 2.2 The different parts of the violin and bow. Taken from Rossing (1982).
(Boyden et al., online). The bow is normally crafted from pernambuco wood (Brazil) and horsehair. 2.1.2 Acoustical behavior The violin produces sound by bowing (or sometimes plucking) one or more of the four strings at a location between the bridge and the edge of the fingerboard. The bowed string produces oscillations that are rich in frequencies, but are not radiated efficiently by the string itself. Instead, the energy of the transverse string vibrations is coupled to the radiating body of the instrument (which acts as an amplifier) via the bridge. Pressing against the central region of the top plate, the two feet of the bridge excite the vibrational modes of the body. String vibrations are effectively transmitted through the right foot of the bridge to the soundpost, which enforces the coupling of the top plate (which acts as the soundboard of the instrument) to the back plate, and through the left foot of the bridge to the bass bar, the tapered shape of which strengthens the coupling of the central region to the larger
2.1 The violin: An overview
11
radiating surfaces on either side of the top plate, and via the ribs to the back plate. From Savart’s trapezoidal violin and Chladni pattern measurements (see Hutchins, 1983) to experimental modal analysis (e.g., Marshall, 1985) and elaborate finite element models (e.g., Roberts, 1986; Knott et al., 1989; Rodgers and Anderson, 2001) to three-dimensional scanning laser Doppler vibrometry (Oliver et al., 2007; Bissinger, 2008), the investigation of violin body vibrations has been an active area of string instrument research.1 The current state of the art offers a fairly good understanding of how the body as a whole as well as the individual components (e.g., top and back plates, ribs, neck, etc.) vibrate and radiate sound (see e.g., Bissinger, 2005). The normal modes of the violin structure are obtained primarily through the coupled motions of the top and back plates and the air in between, the other components such as the neck and ribs making less important contributions. The soundpost and bass bar essentially “break” the symmetry of the system, allowing for strongly-radiating symmetrical modes of vibration of the shell as opposed to only weakly-radiating asymmetrical modes (Schelleng, 1971; Bissinger, 1995). In addition to ensuring structural rigidity, the arching of the top and back plates allows for greater vibrational freedom as opposed to a flat plate. The flexibility of the top plate is further enhanced by the soundholes, which also have another important function: they make use of the cavity or Helmholtz air resonance to help boost the production of sound at the lower notes (below around 450 Hz, i.e., G and D strings) as there are no strongly-radiating shell resonances at those frequencies (Gough, 2007). The modal density of the violin is generally quite high, with typically as many as three modes per 100 Hz (Marshall, 1985). The characteristic timbre of a musical instrument is to a large extent shaped by the frequency response of its body. In the case of the violin, the varying patterns in which different harmonics are amplified by the resonances of the wood color the radiated sound. Furthermore, the resonances of the body exhibit a slow decay that brings a ringing (i.e., resonating) quality to the sound (Gough, 2007). At higher frequencies (above about 1 kHz) the motions of the shell create frequency-dependent directivity formations that are particular to the radiativity profile of the violin, adding flashing brilliance to its sound (Weinreich, 1997). This feature allows a solo violin to be distinguished in an orchestral 1
Carleen Hutchins, a violin maker and pioneer of the long collaboration between researchers and luthiers, has compiled extensive accounts of how research in violin acoustics developed up until the early 1990s (Hutchins, 1975, 1976; Hutchins and Benade, 1997).
12
Background and method
setting. In addition to tonal quality, the vibrational behavior of the body also contributes decidedly to the playability of the instrument or how easy it is for the player to produce and control the sound (Woodhouse, 1993a). In fact, the perceived quality of the played sound is more often than not coupled to its control. 2.1.3 Bridge mobility In the acoustical evaluation of string instruments, it is widely assumed that the most critical aspect of the body behaviour which influences the string is its input admittance at the bridge, also referred to as bridge mobility. The input admittance relates velocity response of a system to some excitation force. The velocity and force are measured / applied at the same location, which is generally considered to be the location where the system is driven. In the case of string instruments, each string notch on the bridge is considered as a driving point of the system. The bridge mobility, essentially a frequency response function, is formally defined as the ratio of the resulting velocity at a string notch on the bridge to a force applied at the same point. Although a separate input admittance is thus defined for each string, the standard experimental procedure for the violin family involves the excitation of the bridge at the G-string corner with a miniature impact-force hammer, in the local direction of bowing, and a measurement of the resulting velocity at the E-string using a very small accelerometer or other sensor or a laser Doppler vibrometer, again in the local direction of bowing. In that way, a single approximation to the input admittance for all the strings is obtained (Jansson, 1997). Although not directly related to the radiated sound of the instrument, bridge mobility contains essential information about the energy transferred between the string and the body (Cremer, 1984). As such, it provides useful information about the radiation profile of the instrument. In fact, the effect of the body can be almost completely characterized by a measurement of its input admittance at the bridge (Woodhouse and Langley, 2012). Figure 2.3 shows the input admittance of a violin. In the open string region, 196–660 Hz, the body response is characterized by the presence of five resonances that are sufficiently separated from the adjacent modes and hence easily identifiable. These are commonly dubbed the “signature” modes as they are considered crucial to violin sound (Bissinger, 2008). They are classified in cavity and shell or corpus modes:
2.1 The violin: An overview
13
Magnitude (dB)
0 −10 −20 −30 −40 −50 −60 A0
B1+
BH
Phase (rad)
2 1.5 1 0.5 0 −0.5 −1
3
10
Frequency (Hz)
Figure 2.3 Input admittance of a violin, obtained by exciting the G-string corner of the bridge with a miniature force hammer (PCB 086E80) and measuring the velocity at the E-string corner of the bridge with a laser Doppler vibrometer (Polytec PDV 100). The magnitude and phase are shown in the top and bottom plots respectively. Some of the “signature” modes (see text) can be observed in the open string region, below about 600 Hz: the Helmholtz-type cavity mode A0 at around 280 Hz and the corpus bending mode B1+ just above 500 Hz. The hill-like collection of peaks known as the “BH peak” (see text) can be discerned in the vicinity of 2–2.5 kHz.
• A0, a Helmholtz-type resonance with fA0 ⇡ 280 Hz2 that radiates strongly through the f -holes; • CBR,3 the lowest corpus mode with fCBR ⇡ 400, two-dimensional flexure, usually a weak radiator; • A1, a higher cavity mode with fA1 ⇡ 1.7 ⇥ fA0 that sometimes radiates strongly but is usually a weak radiator; 2 3
Frequency values of the signature modes are nominal (reported in Bissinger, 2005). Several researchers have adopted a different system of nomenclature for the observed modes, which is based on the primary vibrating component (see Jansson, 1997): CBR = C2 (second corpus mode), B1 = T1 (first top plate mode) and B1+ = C3 (third corpus mode). Rossing (2007) has recently proposed yet another system of naming modes.
14
Background and method • B1 (mainly motion of top plate) and B1+ (two-dimensional flexure), the first stronglyradiating corpus bending modes with fB1 ⇡ 480 and fB1+ ⇡ 550, also radiating strongly through the sound holes.4
Moving to higher frequencies in the input admittance of the violin, the quasi-random peaks and dips caused by the overlapping modes make it almost impossible to identify prominent features such as is possible for the low-frequency signature modes. However, a hill-like collection of peaks emerges in the vicinity of 2–3 kHz. Jansson (1997) originally made a direct link between this broad hump and the lowest “rocking” mode of the bridge near 3 kHz, and called it thus the “bridge hill.” Subsequent investigations showed that the “hill” rather results from local shell motions, particularly of the “island” area between the f -holes, with some if no contribution from the bridge (Jansson and Niewczyk, 1999; Bissinger, 2006; Woodhouse and Langley, 2012). It is now generally referred to as the BH peak (i.e., Bridge and/or Body Hill). Considering that the human ear is most sensitive to frequencies around 3 kHz, an analogy is often drawn between the BH peak and the so-called “singing formant” observed in the spectrum of trained male opera and concert singers (Jansson, 2002; Rossing, 2010). The formant refers to a confluence of vocal tract resonances around 3 kHz that allows the singer to be heard over the orchestra (Sundberg, 1977). Having a similarly strong local output may allow a solo violin to easily rise above the orchestral strings.
2.2 Evaluating violin quality: Approaches and limitations The prominent nineteenth century Italian cellist Alfredo Piatti once spoke of his Stradivarius cello (from The Adventures of a Cello by C. Prieto): I have at times become enamoured at the sight of a fine instrument, have been impressed by its beauty, and when I have become its owner I have tried to believe that its tone equalled that of my Stradivari. Time, however, has invariably seen me return to my old friend with a feeling of satisfaction difficult to explain. 4
In his early experiments, Saunders (1937, 1946) noticed the presence of two prominent resonances in “good” violins at approximately the frequencies of the open middle strings in frequency response curves of violins, violas, and cellos. Now known as the main cavity mode AO and the main body mode B1+ respectively, these two resonances were used in the development of the Hutchins-Schelleng violin octet (Jansson, 1997).
2.2 Evaluating violin quality: Approaches and limitations
15
True, the differences of tone between my Stradivari and other recognized fine instruments are subtle, but I can only say that I obtain from the former a depth and nobility of tone which ever affords me a sense of contentment; in fact, there is something unattainable elsewhere. What is a “fine” violin? A long-standing goal of violin acoustics has been to identify which vibro-acoustical factors affect the timbre and feel of a particular instrument—for example, its perceived “depth” of sound, thus distinguishing one violin from another. Of particular interest is the wide diversity of linguistic forms (e.g., nouns, adjectives, expressions, metaphors, etc.) shared by musicians to describe the quality of a violin or its sound, as illustrated in Piatti’s own words, and how these verbalizations can be mapped to acoustical properties of the instrument. Most previous research has traditionally attempted to answer this question through acoustical and structural dynamics measurements and/or listening tests. The review of previous literature in violin quality evaluation is organized as follows: • Section 2.2.1 discusses studies based on single- or double-blind listening tests using recordings, synthesized sounds or live performance; • Section 2.2.2 reviews studies that have attempted to correlate mechanical characteristics to instrument quality; • Section 2.2.3 focuses on mostly listening-based evaluations that have explored verbal descriptions of violin timbre and how they relate to spectral features; and • Section 2.2.4 comments on the long-standing “new versus old” discussion. Within each section, the content is generally structured in chronological order. 2.2.1 Listening tests Loos (1995) carried out a series of experiments to investigate projection of violin sounds.5 Six violin students played a set of single notes and musical extracts on their own instruments (price range e2,5K–20K) in a small (900 m3 ) concert hall. Recordings at the level of the ear 5
Because Loos’ thesis is written in German, the method and results discussed here are instead based on information provided in English by Curtin and Schleske (2003); a description of Loos’ thesis is also given by Schleske in Catgut Acoustical Society Journal Vol. 4, No. 8 (Series II), November 2003, pp: 72–73.
16
Background and method
as well as of the near (1 m from instrument) and far field (12 m from instrument) were made. Differences in sound pressure level across single violins were found to be larger between the ear and 1 m away than between 1 and 12 m away. This finding argues in favor of the widely shared impression that projection is a difficult sound quality to judge reliably merely by playing a violin (Curtin and Schleske, 2003). Listening tests were also realized using A-B pair comparisons of six single notes with vibrato. Strong lower harmonics appeared to enhance the perceived “nearness” of a violin. ˘ epánek (2002) performed several listening tests using primarily a set of five notes St˘ (B3, F ]4, C5, G5 and D6) recorded on different violins. From impromptu timbre descriptions collected during initial tests (in Czech), four quality-associated verbal attributes of violin sound were extracted: sharp, dark, clear and narrow (as translated in English by the authors themselves). Complementary tests showed higher agreement between listeners in evaluating violin sounds described as sharp and dark than in the cases of clear and narrow. Willgoss and Walker (2007) carried out semantic differential tests on recorded samples from 12 Stradivari and Guarneri del Gesù violins performed by the same player to investigate perceptual differences between violin sounds. The recordings were judged by two independent groups of listeners, 15 university-level music students and 8 professional musicians, based on 13 bipolar pairs of verbal timbre descriptions (e.g., resonant-muffled ). Both participant groups showed little or no agreement, with professional violinists appearing more selfconsistent than students (no quantitative data is provided). Further analyses showed that all participants used the following verbal pairs as semantically similar: weak-strong and soft-loud ; full-empty and interesting-boring; penetrates-weak and interesting-boring; focused-diffuse and like-dislike. Petiot and Caussé (2007) conducted listening tests to investigate perceptual differences between the sounds of two cellos. The instruments were played by two professional musicians behind a curtain and assessed by six blindfolded listeners. First, each cello was rated on 6 attributes defined by a bipolar scale (e.g., neutral-rich). Then the two instruments were comparatively ranked according to a different set of 4 attributes (e.g., bright). Listeners demonstrated a lower level of agreement in the rating task than in the comparative task. The listener judgments in the latter were found to generally agree with the spectral centroid of certain notes on each of the two cellos. Fritz et al. (2007) carried out a series of listening tests using virtual violins, whereby recorded bridge force signals were convolved with measured and post-processed bridge
2.2 Evaluating violin quality: Approaches and limitations
17
admittances to synthesize sounds, allowing controlled variations of modal properties. Initial tests investigated thresholds for the perception of frequency or amplitude modifications applied to the three signature modes A0, B1 and B1+ , and the four Dünnwald bands. Results demonstrated a large variability across participants with significantly lower thresholds for experienced musicians (more than 8 years of violin training) than for subjects with little musical training (less than 6 years). Subsequent tests showed that when listening to recorded single notes with varying levels of vibrato and body damping, ratings on the perceived liveliness of the sound were inconsistent across participants, while overall preference judgments appeared to be in good agreement between individuals (Fritz et al., 2010b). Interestingly, when asked to play freely on an electric violin (i.e., the bridge force signal was passed through the modified admittances in real time), participants rated both liveliness and preference consistently. In another study by Fritz et al. (2012a), 61 common English adjective descriptions of desirable and undesirable violin tone qualities were collected and then arranged by violinists on a two-dimensional map, so that words with similar meanings lay close together, and those with different meanings lay far apart (some results related to the verbalization of violin quality are discussed separately in Sec. 2.2.3). A representative set of five adjectives was then used in a listening test: virtual violin sounds with modified modal levels in five one-octave wide bands, 190–380, 380–760, 760–1520, 1520–3040, and 3040–6080 Hz, were evaluated as being bright, harsh, nasal, clear or good. Increased brightness and clarity were associated with moderately increased levels in the 1520–6080 Hz region, whereas increased harshness was associated with a strongly increased level in the 1520–3040 Hz band. These findings appear in contrast with earlier empirical observations by Meinel and Dünnwald (see Sec. 2.2.2). Participants were found consistent at assessing synthesized sounds described as bright, harsh and clear, but less so for nasal and good. Subsequent analyses implied that the observed inter-individual variability might have resulted from the fact that different players evaluate different qualities of the violin in different ways. This hypothesis has been further investigated in the present dissertation. Listening tests using recordings, synthesized sounds or live performance have several disadvantages. Recorded sounds often lack the naturalness of live performance. Similarly, synthesized tones often sound rather unmusical (Wright, 1996). And when using live players, listeners, regardless of musical relevance or the lack thereof, tend to focus more on the performer than the instrument. For example, the player may introduce performance biases
18
Background and method
in favor of one violin or against another when not blindfolded. Or more generally, the skills of an experienced player may compensate for a flawed violin. Most importantly, it is virtually impossible to assess vibro-mechanical properties, such as responsiveness, which are considered integral to the playing sensation (Askenfelt and Jansson, 1992), without direct interaction with the instrument. Concerning the perspective of the player, listening tests are therefore not completely indicative of the processes that take place when assessing the qualities of a violin. Playing-based evaluations afford a higher level of ecological validity: by playing, violinists can experience a wider range of performance effects than the very short phrases or single notes often used in listening tests, and in this way assess any particular attribute of the instrument on combined perception (i.e., based on auditory and tactile feedback, see Sec. 1.2). 2.2.2 Physical measurements Meinel (1957) examined the frequency response of each string on a 1715 Stradivarius violin, which he thought to be an instrument “of fascinating, fine tone quality.” The response curves were obtained via measuring the sound pressure at about 1 m away. Meinel observed that “good” violins respond more strongly at the lower register and exhibit a broad maximum around 2–3 kHz (i.e., the BH peak). More specifically, he drew attention to four frequency regions: • high-amplitude resonances at low frequencies (below about 1 kHz, although the author didn’t specify) give agreeably sonorous sound that carries well ; • the more weak the response in the vicinity of 1.5 kHz, the less nasal the sound is; • a strong BH peak is associated with a agreeable, pithy sound and dull brightness; and • low-amplitude resonances at high frequencies above about 3 kHz allow harmonious softness and a fine, pure response. Gabrielsson and Jansson (1979) examined long-time average spectra (LTAS) from recordings of 22 violins, which had previously been tonal-quality-rated during the 1975 Instrument Exhibition of the Nordic Association of Violin Makers. At the exhibition, two professional musicians rated 103 violins on equality in loudness and timbre across all registers and ease of playing. Each violinist both played two major three-octave scales (starting
2.2 Evaluating violin quality: Approaches and limitations
19
from A and A[) and listened to the other player. The authors selected 22 of those violins to represent “the different tonal quality ratings from the highest to the lowest” and had a player, who was not familiar with any of the instruments, record a three-octave G major scale on each violin in a reverberation chamber. The scale was played détaché, as loud as possible and with a tempo of about 60 bpm. Different correlation methods between the quality ratings of the violins and the LTAS analysis of their recorded samples indicated a preference for instruments with “strong” low-frequency response (i.e. signature modes) and “weak” high register. At the 1980 instrument exhibition of the same organization, 77 violins were played by two professional violinists and tonal-quality-rated based on evenness, volume, and brilliance of sound as well as playability. From those, Alonso Moral and Jansson (1982) selected 24 instruments “covering the full range of ratings” and studied their input admittance at both sides of the bridge. From the mobility curves, four criteria were extracted and used to “acoustical-quality-rate” the violins: the average and standard deviation of the T1, C3 and C4 mode levels (sound pressure level in dB) measured on the bass side of the bridge, the average increase in level from 1.4 to 3 kHz measured on the bass side; and the standard deviation of the difference between 1.4–3 kHz levels measured on the bass and treble side of the bridge. Correlations between the tonal and acoustical quality ratings suggested a strong influence of the modes below 600 Hz (i.e., signature modes) and the “hill around 3 kHz” (i.e., BH peak) on violin sound quality. Jansson (1997) later realized bridge admittance measurements on 25 violins, which were loaned from a private collection of high quality instruments,6 and made similar conclusions. Dünnwald (1991) conducted sound radiation measurements on a large set of about 700 violins, including old Italian instruments, violins by respected German makers circa nineteenth century, factory violins and instruments by amateur makers.7 To measure radiation from a violin, the bridge was excited by a sinusoidal vibration and the frequency response was measured with one microphone “placed at a location typical of listeners’ positions in a solo concert.” Dünnwald proposed that the four frequency bands 190–650, 650–1300, 1300–4200, and 4200–6400 Hz were critical in assessing the quality of the violin sound: 6 7
Järnåker Foundation of the Royal Swedish Academy of Music Dünnwald provided no further details regarding the make, age and origin of the measured violins.
20
Background and method • the first band contains the [signature] lower modes; • a strong response in the second band is associated with a nasal quality in the sound; • the third band is responsible for brilliance, effective radiation, and evenness of tone in the lower playing range; and • the fourth band should be relatively low to create a clear sound.
Dünnwald’s bands are in very close agreement with Meinel’s quality-critical frequency regions. Recent research has called most of these suggestions into question (Fritz et al., 2012a). Dünnwald then went on to suggest five parameters for the tonal quality evaluation of a violin: the relative sound level of the Helmholtz resonance; the percentage of very nasal sounds; the percentage of very “unnasal” sounds; the percentage of very harsh sounds; and the percentage of very clear sounds. He concluded that a strongly radiating Helmholtz mode was correlated with perceived excellence in sound quality; more systematic experimental measurements by Bissinger (2008) have confirmed this finding. Based on observations from input admittance measurements on over 100 violins with “a wide variety of tone and playing qualities, as described by their owners-players,” Hutchins (1989) proposed the frequency spacing between the B1+ and A1 modes as a criterion for assessing violin quality. She noted that • violins with a B1+ A1 frequency difference of less than 40 Hz were easy to play with little projection and preferred in chamber music; • instruments with values between 40 and 70 Hz were preferred by soloists; • violins in the 55–70 Hz range were more powerful in terms of projection; and • above 100 Hz instruments were harsh and hard to play. In fact, Hutchins originally considered only one first corpus bending mode, B1, which corresponds to B1+ . Bissinger and Gregorian (2003) noticed that this criterion was ambiguous as there are two such modes. Schleske (2002) later remarked that the B1+ resonance strongly influences the tonal color of the violin. According to Schleske, violins with B1+ < 510 Hz and > 550 Hz are soft vs. harsh, less vs. more resistant and characterized by dark vs. bright sound respectively.
2.2 Evaluating violin quality: Approaches and limitations
21
Bissinger conducted a wide range of systematic vibration and radiation measurements on 17 violins with quality ratings from bad to excellent (VIOCADEAS project). All instruments were played by a professional violinist; 12 violins were rated by the violinist using a standardized qualitative evaluation procedure (Bissinger and Gearhart, 1998); the other 5 violins, including two Stradivari and a Guarneri del Gesù, were rated by the author based on feedback from the violinist, comments of listeners, and the historical status of the old Cremonese instruments. The suggestions by Hutchins and Schleske were not confirmed as no quality trends for signature mode frequencies or total damping were found from bad-excellent comparisons (Bissinger and Gregorian, 2003). More elaborate band-/modalaveraged mobility and radiativity comparisons further confirmed no significant quality differentiators except for the Helmholtz-like cavity mode A0, the radiation of which was significantly stronger for excellent than for bad violins (Bissinger, 2008). It is unclear whether the results of these studies are reliable or generalizable, primarily because the evaluation tasks were carried out with an extremely low number of participants and/or violins. It is also unclear whether the influences of parameters like the choice of bow or visual information (e.g., color of varnish, identity of the instrument) were controlled because these specifics were not published. Attempts to correlate measurable vibrational properties of the violin with perceptual judgments by players first require a closer look into the subjective evaluation process itself. 2.2.3 Timbral semantics As part of the VIOCADEAS project, a standardized qualitative violin evaluation procedure was proposed by Bissinger and Gearhart (1998). Frequently used English descriptions of violin sound were grouped according to different quality categories: • across range: evenness of tone, evenness of response, problem notes on each string; • overall: loud, responds easily; • tonal qualities: mellow vs. strong, gritty vs. smooth, harsh vs. warm, thin vs. deep, complex vs. one-dimensional, tight vs. open, fuzzy vs. clear, bright vs. dark ; and • playing qualities transient behaviour, notes hard to play very softly or very loudly.
22
Background and method
Each description was mapped to an acoustical or spectral property—for example, a complex sound “has many overtones and color.” ˘ epánek and Ot˘cená˘sek (1999) asked listeners to judge a In one of their listening tests, St˘ set of recorded notes played on different violins as sharp, dark, clear or narrow (see Sec. 2.2.1). Results from audio feature extraction showed that sharp and narrow were associated with higher and lower spectral centroid values respectively. A frequent perception of rustle in the note D6 was attributed to temporal changes of the spectral energy around the A0, B1 and B1+ modes. Łukasik (2005) suggested a semantic classification of audio descriptors for violin sound retrieval. For example, the first cepstral coefficient was associated with the bipolar linguistic pair strained-light; the spectral centroid with bright-dark ; the tristimulus 1 and 3 with deep/full-flat/empty; and a coefficient of steady-state envelope fluctuation with smoothcoarse. The proposed scheme was tested using the recordings of fifty-three violins (AMATI database, see Łukasik, 2003) but no distinct trends were observed. In the study by Fritz et al. (2012a) previously discussed in Sec. 2.2.1, the collected adjective descriptions of desirable and undesirable violin sound qualities were analyzed using multidimensional scaling. Results demonstrated consistent use among performers of many words, and highlighted which words are used in similar situations. It was also observed that almost all verbal descriptions of violin sound incorporate an evaluative judgment as being either good or bad qualities. Further, three dimensions for the characterization of violin sound quality emerged (reported with acoustical and perceptual interpretations by the authors): • warm/rich/mellow vs. metallic/cold/harsh (spectral balance, undesirable qualities associated with excessive high-frequency content or too little low-frequency content); • bright/responsive/lively vs. muted/dull/dead (“amount of sound” produced by the instrument, particularly in the middle and upper ranges); and • even/soft/light vs. brash/rough/raspy (noisy character, i.e., width of distribution of spectral energy). These dimensions of violin sound quality and their interpretations seem to agree with the semantic classification of audio features suggested by Łukasik (2005). The results of the
2.2 Evaluating violin quality: Approaches and limitations
23
verbal data analysis conducted in the present dissertation further support some of these suggestions. It is unclear whether the acoustical interpretations of verbal violin sound descriptions suggested in these studies are reliable or generalizable, primarily because they are based only on a priori knowledge of the respective authors as opposed to emerging concepts grounded in the verbal data. Attempts to find relationships between measurable vibrational properties of violins and their perceived qualities first require a closer look into the ways violinists process and conceptualize the latter. To this end, a recent study examined the differences between preference judgments made by violin players in active playing vs. passive listening situations in conjunction with psycholinguistic analyses of free-format verbal French descriptions of the participants’ experience Fritz et al. (2010a). Two distinct objects under evaluation for the violinist were identified: descriptions refer either to the sound of the violin (e.g., sound is acide or with une certaine chaleur ) and/or to the instrument itself (e.g., the violin is facile à jouer or très égal ). Results suggested that the overall evaluation of a violin as reflected in the verbal responses of the musicians varies between playing and listening settings, the former invoking descriptions influenced not only from the produced sound but also by the interaction between the player and the instrument (e.g., pouvoir jouer pp très doux, voire aller au forte, avec des sons très timbrés). 2.2.4 New versus old A final discussion is necessary about the perception and evaluation of violin quality. Concerning the tonal quality of old Italian instruments, such as those made by Antonio Stradivari and Giuseppe Guarneri del Gesù, there is a widespread notion that their superiority is self-evident. In fact, much of the research discussed so far has been based, in part, on this very presumption. In a less scientific context, new violins by contemporary luthiers are traditionally tested against prestigious and highly priced old instruments in listening trials organized during professional instrument making conventions or music performance competitions. These listening “contests” often involve hundreds of listeners and top-quality soloists. Two hundred and five listeners judged six old and six new violins at the 1909 Paris Concours Musical (reported in the Strad magazine, February 2009, From the Archive, p. 95). The instruments were played by two professional violinists behind a curtain in a dark
24
Background and method
auditorium (i.e., double-blind). The “winner” was a contemporary French violin. The Strad correspondent at the time remarked that the top-scoring instrument belonged to one of the two performers, who “unconsciously . . . must have been more in sympathy with a violin he was used to.” At the 1912 Paris competition, an audience of 161 (“artists”) voted between six modern and six old violins under a similar setup, again preferring the former over the latter (Moya and Piper, 1916). At a double-blind test arranged at the 1990 American Cello Congress (Coggins, 2007), about 140 musicians evaluated the sound quality of six old and six new cellos played by a blindfolded musician behind a linen screen. Although the top-scoring cello was one of the old instruments, the contemporary cellos were rated higher as a group. In a very different setting, a single-blind listening test was organized and broadcast on the BBC8 in the 1970s (Coggins, 2007). Renowned violin dealer Charles Beare and well-respected soloists Isaac Stern and Pinchas Zukerman discussed and assessed the sound of three old (two Cremonese and one French) and one modern violins played by violinist Manoug Parikian. The judgments of the panel were rather inconsistent, the modern violin often mistaken for either of the old Italians. In their comments, both Stern and Zukerman argued that old Italian violins offer musicians “security.” Bearer added that “the difference between a great instrument and a good instrument is what it does for the player.” A common criticism of new-versus-old listening contests is that they are unscientific, and hence their outcomes are questionable. Such attitude is mostly shared among those who firmly support the tonal superiority of old Cremonese violins. From a scientific point of view, listening tests arguably present limitations as already discussed in Sec. 2.2.1. On the other hand, as violin maker David Burgess noted, “even musically educated audiences listening in double-blind tests are repeatedly unable to conclude that old Italians are superior . . . at some point it seems like the preponderance of evidence might prevail” (reported in Coggins, 2007). Perhaps the tonal superiority assigned to the instruments of the early Italian masters is not that self-evident? Saunders (1946) believed it is not: There is no correlation between the price of an instrument and its distribution of strength with frequency; and that, whatever is the best distribution, it is not exclusively the property of old instruments. There is about the same variation in distribution among the old as among good new ones, and whatever type the player prefers he may find it either in old or new instruments. 8
An audio copy of the program is available online at http://abcviolins.com.au/bbc-radio.
2.3 Method: Design and analyses
25
At the 2010 International Violin Competition of Indianapolis, 21 experienced violinists compared three violins by Stradivari and Guarneri del Gesù with three high-quality new instruments in a carefully designed experiment (Fritz et al., 2012b). The instruments were played under double-blind conditions in a (hotel) room with relatively dry acoustics. The most-preferred violin was one of the new instruments. In fact, the least-preferred choice was one of the Stradivarius violins. Most of the violinists who took part in the experiment were found inconsistent in distinguishing old from new instruments and, in support of the remarks made by Saunders and Burgess, no correlation between a violin’s age and monetary value and its perceived quality was observed.
2.3 Method: Design and analyses The quality of a violin depends on a number of factors, many of which relate directly to the sound radiated by the instrument, as well as others that relate to the interaction between the player and the instrument. For example, an important aspect of a violin’s behaviour concerns its playability or response to various playing gestures (Woodhouse, 1993a). Some of this information may be communicated to the player via tactile and proprioceptive channels (Askenfelt and Jansson, 1992). All these aspects are potentially relevant to perception and should be included in a test. The results of previous investigations have demonstrated the need to better understand how violinists perceptually assess and conceptualize different qualities of the violin. Previous studies have shown that, concerning the perspective of the musician, listening tests are probably not much indicative of the processes that take place when evaluating the quality of a violin; playing-based evaluations are more ecologically valid as they facilitate evaluations based on combined audio-tactile perception. The present research design comprises a series of three experimental studies based on a carefully controlled violin-playing experimental procedure, whereby experienced musicians assessed violins of different make and age (Secs. 2.3.1–2.3.4) and subsequently justified their choices in free verbalization tasks (Sec. 2.3.5). For the analysis, two distinct yet complementary approaches were followed: a systematic investigation of the reliabilityreproducibility of preference judgments (Sec. 2.3.6), and an empirical exploration of emerging concepts in impromptu descriptions of violin quality (Sec. 2.3.7).
26
Background and method
2.3.1 Violins The violins used in each of the subsequent studies were chosen from several local luthier workshops in order to form, as much as possible, a set of instruments with a wide range of characteristics. The violins had not been played on a regular basis, some having been recently fabricated and most of the others coming from the available sales stock of two workshops. The respective luthiers provided the price estimates and tuned the instruments for optimal playing condition based on their own criteria. The fact that some violins may have been less optimally tuned or had strings of varying quality was not a concern, as that should not influence the consistency of the evaluations. Participants were given the option to either use a provided shoulder rest (Kun Original model), or use their own, or use no shoulder rest. A preliminary pilot study was conducted prior to the first study, in which skilled players were found to consistently discriminate student-level (unmaintained Suzuki) violins from performance-level instruments. While interesting in itself and potentially worthy of future investigation, violins of this sort were excluded from the study because it appeared they were too easy to identify. In hindsight, one could have been used to assess some minimal performance level of the subjects. That said, a fairly cheap but better maintained violin was used in all subsequent studies. Participants’ own violins were not included in the set of instruments in order to avoid possible preference biases caused by the mere exposure effect (Zajonc, 1968) by which familiarity with a stimulus object increases preference toward it. 2.3.2 Choice of bow A critical issue when conducting violin playing tests is the choice of a bow. In the present studies, two options were considered: using a common bow across all participants (e.g. Inta et al., 2005) or asking players to use their own bow. Although neither solution is ideal, by considering the bow as an extension of the player (second option) the potential problems of using a common bow (e.g., participants being uncomfortable with a bow they are not familiar with) were avoided. Furthermore, a common bow would potentially trigger a similar quality debate (Caussé et al., 2001). Having the participants use the bow that they are most familiar with was also felt to be more representative of how violinists assess instruments while in the process of purchasing one.
2.3 Method: Design and analyses
27
Figure 2.4 One of the violinists that took part in the third study, wearing dark sunglasses and playing with his own bow.
2.3.3 Visual occlusion Anecdotal evidence strongly suggests that some visual information, such as the color of the varnish, the grain of the wood, or identifying marks of the violin, may influence judgment. More specifically, possible recognition of the instrument’s make and origin is likely to produce preference biases (e.g., old Cremonese violins are often considered excellent and hence preferred over modern instruments). To help minimize the effects of such visual cues as much as possible in listening tests involving live performance, the listeners or the performers or both are often blindfolded. Another approach is to have the instruments played behind a physical divider (e.g. Petiot and Caussé, 2007). However, blindfolding was not a viable solution for the playing tests discussed in this dissertation because players were allowed to freely explore a set of violins and rank-order them on a table. To circumvent the potential impact of visual information on preference while ensuring a certain level of comfort for the musicians, as well as safety for the instruments, low light conditions were used and participants were asked to wear dark sunglasses (see Fig. 2.4). Based on this procedure, violinists could provide unbiased assessments while still retaining some visual contact with the instruments.
28
Background and method
2.3.4 Acoustic environment The experimental sessions took place in diffuse rooms to help minimize the effects of room reflections on the direct sound from the violins (Bissinger and Gearhart, 1998). The first and second studies were carried out in the same room, which has a floor surface of 27 m2 and reverberation time of approximately 0.18 s. The third study was conducted in a different but similarly diffuse room with a floor surface of 46.8 m2 and reverberation time of approximately 0.3 s. 2.3.5 Questionnaire design Taking into account the lingual diversity of Québec, a bilingual questionnaire in English and French was compiled for each study, and participants were invited to respond in the language they felt most comfortable with. To avoid confining the responses into pre-existing categories, very general, comment-form (open-ended) questions were formed, wherein no restriction was imposed on the format of the response—for example, “What is a very good violin for you?” All questionnaires were designed with input from an expert in the psycholinguistic evaluation of sound quality and aimed at understanding how experienced musicians conceptualize violin quality, what aspects of the sound and/or the playing experience are essential, and what associations are formed between perception and acoustics (Dubois, 2000). Several questions were used in more than one study. The full set of questions presented in each study is included alongside the description of the experimental procedure in the respective chapters. 2.3.6 Measuring reliability For an individual violin player, the reliability of their evaluations was quantified based on two types of consistency: • intra-individual consistency measured how self-consistent the player was across repetitive judgments (hereafter also referred to as self-consistency); • inter-individual consistency measured the extent to which the player agreed with other musicians (hereafter also referred to as inter-individual agreement or, simply, agreement).
2.3 Method: Design and analyses
29
Consistency was assessed as the concordance correlation between measurements from different trials. The concordance correlation coefficient was introduced by Lin (1989) and is defined as: ⇢c (A, B) =
2rsA sB s2A
+
s2B
+ A+B
2
where s2A and s2B are the variances of the two measurements, A and B their means, and r is the Pearson product-moment correlation coefficient. Lin’s ⇢c is a special case of Pearson’s r that measures departures from the equality lines with slopes ±45 : ⇢c (A, B) = 1 and 1 if A = B and A = B, respectively, and ⇢c (A, B) = 0 in case of no association between A and B . As such, ⇢c does not assume linear relationships, thus being a stricter index of agreement than Pearson’s r (also known as the linear correlation coefficient) and the Spearman rank correlation coefficient ⇢S (defined as the Pearson correlation coefficient between the ranked variables). From the lower triangular part of the concordance correlation matrix, the intra-individual consistency was defined as the average of the ⇢c between the measurements from each of the trials for the same participant. The computation of the inter-individual consistency for a given participant A was given by the average of the ⇢c between the measurements of A and those of all of the other participants. Note that according to this definition, the interindividual consistency measures for participants A and B would be computed by considering the same set of n ⇥ n concordance coefficients ⇢c between the n measurements of participant A and those of participant B. In order to minimize one source of dependence between the inter-individual consistency measures for different participants, correlations were equally distributed among participants at random: for participant A the inter-individual consistency measure considered n⇥n randomly selected ⇢c (A, B) measures, whereas for participant B 2 it included the remaining half. However, there is another source of dependence as all correlations come from the same matrix and are therefore linked to each other. As a result, any statistical inferences on inter-individual consistency such as confidence intervals of the mean or parametric tests of statistical significance should be treated with caution. To examine whether known characteristics of the participants explained their selfconsistency, the Spearman rank correlation ⇢S (Kendall, 1962) between measures of intraindividual consistency on the one hand, and the self-reported price of the owned violin, the years of violin training, and the weekly hours of violin practice, on the other was computed.
30
Background and method
Average imputation was used to replace missing values for these self-reported measures. The Bonferroni correction, whereby the critical p-value was adjusted for the number of participant characteristics p = .05/3, was used to control for false positives (Miller, 1981). 2.3.7 Content analysis of verbal data The analysis of free-format verbal descriptions of violin preference and quality was based on the inductive principle of grounded theory (Glaser and Strauss, 1967) and aimed at exploring qualitatively and quantitatively the perceptually-relevant concepts of violin quality as reflected in player verbalizations. Contrary to the typical approach of beginning with a hypothesis, grounded theory provides a systematic method of formulating a theory that is grounded in data. Although originally developed to apply specifically on fieldwork and qualitative data, grounded theory is considered a general method of analysis transcending specific data collection techniques, including surveys, case studies, media content, etc. (Boutard, 2013). The conceptualization scheme proposed in Chap. 6 was generated through several data coding steps, which form the constant comparison method (Glaser and Strauss, 1967; Strauss and Corbin, 1998; Boutard, 2013): • open or substantive coding: identification of concepts, their properties and underlying themes in three questions directly related to descriptions of violin preference (i.e., preference ranking criteria, most- and least-preferred violin qualities) in Study 1; • axial coding: establishment of inter-categorical links—to better illustrate the relationships between different concepts, the same phrasing could be coded into more than one category (i.e., the derived concepts are not mutually exclusive); • selective coding: integration of new data from a question directly related to descriptions of violin quality (i.e., desirable qualities of the “very good” violin) in Study 1 and improvement of developed scheme; • theoretical sampling and saturation: analysis of responses collected in Study 2, wherein the same question about desirable qualities of the “very good” violin was asked, and conclusion of coding as no additional concepts emerged in the new data.
2.4 Summary
31
In this dissertation, the prior knowledge and experience of the researcher was acknowledged in the process of conceptualization, which thus relied on a contextualist approach to epistemology as per the view of Strauss and Corbin (1998) on grounded theory. Previous findings in the literature and informal discussions with musicians, luthiers and colleagues were considered.
2.4 Summary Since the classical period and the early Cremonese instruments of Amati and Stradivari, the lutherie of the violin and its bow has remained largely unchallenged. Its design combines visual charm with ergonomics and a precise acoustical function. Despite a considerable amount of research on the dynamic behavior of the instrument, efforts to understand how it relates to the perceived quality of a violin have often been unsuccessful. A review of the different approaches to correlate measurable vibrational properties of the instrument with psychoacoustical judgments by performers indicated limitations concerning the subjective evaluation process itself. To this end, the present thesis will consider quantitative and qualitative methods aiming to investigate the perceptual evaluation of violin quality by experienced musicians, focusing on the reliability of their assessments and the verbalization of their perceptions. Results from three experimental violin-playing studies are discussed in the subsequent chapters.
32
33
Chapter 3 A concordance analysis of preference judgments by experienced players In this chapter, an experiment is described that was designed to examine how consistent skilled players are at assessing violins within and between themselves. Repetitive preference rankings by skilled violin players were examined in terms of intra-individual consistency and inter-individual agreement. Preference judgments were collected as a measure of subjective evaluation based on choice behavior (Giordano et al., 2012). Participants were asked to provide rationale for their choices through a specially designed questionnaire, from which preference-associated attributes of the violin were extracted and then used to design the rating scales for Study 2 (see Secs. 3.2.6 and 4.1.3). Section 3.1 presents the materials and methods used in this study. The concordance correlation analysis and results are examined in Sec. 3.2. Section 3.3 summarizes and reviews the findings concerning player reliability in evaluating violin quality, and discusses some methodological aspects. A bonus Sec. 3.4 discusses a short exploratory study about the extent to which visual information might bias the preference for violins.
3.1 Materials and methods The experimental design developed for the purposes of this and subsequent studies has been presented in Sec. 2.3. The following sections will provide detailed descriptions of the particular materials and methods relevant to this study only.
34
A concordance analysis of preference judgments
3.1.1 Participants and violins Twenty skilled string players took part in this experiment (8 females, 12 males; average age = 34 yrs, SD = 13 yrs, range = 20–65 yrs; 11 native English speakers, 3 native French speakers, 6 other). They had at least 15 years of violin experience (average years of violin training = 26 yrs, SD = 12 yrs, range = 15–60 yrs; average hours of violin practice per week = 15 hrs, SD = 9 hrs, range = 9–30 hrs), owned violins with estimated prices ranging from less than $1K to $30K, and were paid for their participation. Thirteen participants described themselves as professional musicians, and 8 had higher-level degrees in music performance (MMus, MA, DMus, DMA). They reported playing a wide range of musical styles [classical (95%), folk (47%), baroque (37%), jazz/pop (10%), and contemporary (5%)] and in various types of ensembles [chamber music (70%), symphonic orchestra (70%), solo (55%), and folk/jazz band (40%)]. Eight violins of different make (Europe, North America, China), age (1840–2010) and price ($1K–$65K) were used (see Table 3.1). More detailed information on how the violins were selected and setup as well as on all other experimental conditions is provided in Secs. 2.3.1–2.3.4. 3.1.2 Questionnaire A first set of open-ended questions was given to participants as soon as they completed a ranking task (Questionnaire A), comprising questions related mainly to perceptual criteria that determined the preference for the violins: A1. How and based on which criteria did you make your ranking? / Avec quels critères avez-vous effectué votre classement et de quelle fa¸con les avez-vous utilisés ? A2. Considering the violin that you ranked as “most preferred,” can you say why? / A propos du violon que vous avez classé comme votre préféré : pourriez-vous nous dire pourquoi ? A3. Considering the violin that you ranked as “least preferred,” can you say why? / A propos du violon que vous avez classé en dernier : pourriez-vous nous dire pourquoi ? A4. Did you have difficulty ordering any particular instruments? If yes, which ones and why? / Avez-vous eu des difficultés à classer certains instruments ? Si oui, lesquels
3.1 Materials and methods
35
Table 3.1 Violins used in Study 1 along with preference score averaged across participants (0 = never preferred to any other violin; 1 = always preferred to all other violins; 95% confidence interval of the mean in parentheses). The most preferred violin (F) is indicated in bold and the least preferred violin (H) in italics. Violin
Origin
Luthiera
Year
Price
Preference score
A
France
Silvestre
1840
$65K
0.51(0.1)
B
Italy
Cavallini
1890
$35K
0.44(0.1)
C
Canada
-
2010
$16K
0.44(0.12)
D
Canada
-
2010
$13K
0.37(0.15)
E
Canada
-
1976
$10K
0.44(0.13)
F
Germanyb
Unknown
Unknown
$8K
0.54(0.1)
G
France
Apparut
1936
$6K
0.42(0.04)
H
China
-
2010
$1.3K
0.34(0.08)
a b
The names of living luthiers are not provided for confidentiality purposes. This is based on a luthier’s informal appraisal, as there is no information regarding the make and age of this violin.
et pourquoi ? A5. Where would you place your own violin in this ranking? Why? / Où placeriez-vous votre propre violon dans ce classement ? Pourquoi ? A second questionnaire was presented to participants at the end of the whole session (Questionnaire B), consisting of open-ended questions referring to the concept of the “very good” violin as well as the potential difficulties in carrying out the experiment: B1. Would you buy any of these violins (assuming price wasn’t an issue)? Why? / Achèteriez-vous un des ces violons (en supposant que le prix ne soit pas un problème)? Pourquoi ? B2. More generally, what is a very good violin for you? / En général, comment définissezvous personnellement un très bon violon ? B3. To what extent was wearing sunglasses disturbing? Dans quelle mesure le port de lunettes de soleil vous a-t-il dérangé ?
36
A concordance analysis of preference judgments
B4. Do you have any comments or remarks about the task you were involved in? / Avezvous des commentaires ou des remarques concernant la tâche à laquelle vous avez participé ? Verbal (written) responses to question A1 are preliminarily discussed in Sec. 3.2.6 in relation to the experimental design of Study 2. Answers to questions A4, A5, B1, B3 and B4 are discussed in Sec. 3.3. Content and psycholinguistic analyses of verbalizations collected from questions A1, A2, A3 and B2 are the subject of Chap. 6. 3.1.3 Procedure The experimental session lasted two hours and was organized in two phases. The experimenter was constantly present in the room to facilitate the procedure. In the first phase, participants were presented with the violins randomly ordered on a table by the experimenter. They were asked to play all instruments for up to 25 minutes in order to familiarize themselves with the set. The second phase consisted of five trials. On each trial of the second phase, participants were initially presented with all violins placed on a table in random order (determined by computer calculations) by the experimenter. They were then given up to 15 minutes to play, evaluate and rank the violins by placing them in order of preference (from least to most preferred) on a different table. Participants were not allowed to assign the same preference rank to two or more instruments. Rankings were recorded by the experimenter. Participants were instructed to maximize evaluation speed and accuracy. No playing constraint was imposed on the evaluation process (e.g., specific repertoire). Participants were instead instructed to follow their own strategy. They were encouraged to play their own violin whenever they needed a reference point during the experiment. To minimize fatigue, participants were encouraged to take breaks between trials whenever needed. Upon completing the first trial, participants provided free verbal (written) responses to questionnaire A. At the end of each subsequent trial, they were given the opportunity to modify their initial response if they so wanted. Upon completing the last trial, participants provided written responses to questionnaire B. Participants were asked to return for a second, identical session 3–7 days after having completed the first session. In total, participants ranked each violin 5 ⇥ 2 = 10 times.
3.2 Analysis and results
37
3.2 Analysis and results Four different analyses were carried out. Firstly, the levels of intra- and inter-individual consistency in the preference rankings were measured and analyzed. Secondly, the extent to which various characteristics of the participants explained their ability to be consistent across repeated preference-ranking trials (for example, whether “hours of practice per week” was correlated with self-consistency) was assessed. Thirdly, an overall measure of preference for each of the violins was derived and used to conduct hierarchical clustering. Finally, the verbal descriptions of the violin attributes relevant in determining the preference responses given by the participants were analyzed. 3.2.1 Intra- and inter-individual consistency Consistency was measured as the concordance correlation between preference rankings from different trials (see Sec. 2.3.6). The first step involved computing a 200 ⇥ 200 symmetric matrix of ⇢c coefficients between the rankings on each of the 10 trials for each of the 20 participants. Across the 19,900 cells of the lower triangular part of this correlation matrix, there were 19,000 correlations between trials from different participants and 900 correlations between trials from the same participant. Across the 900 correlations between rankings from the same participant, 500 correlations are between trials from different sessions and 400 correlations are between trials from the same session. Figure 3.1 displays the histograms for all the ⇢c measures computed between preference rankings from the same participant, and between preference rankings from different participants, respectively. The intra-individual ⇢c distribution is highly asymmetrical with peaks in the range 0.5–0.8, while the inter-individual ⇢c distribution is roughly symmetrically centered around zero. In order to give a preliminary, approximate figure for the results of this analysis, a test assessed how many of these ⇢c coefficients were significant when assuming their independence [p < .05, df = 6]: the percentage of significant ⇢c coefficients between rankings from the same participants and between rankings from different participants was 51% and 7%, respectively. The first of these figures corresponds, simply put, to the case where the consistency between all of the 10 rankings given by the same participant throughout the experiment was significant for 10 of the 20 participants (51% of the intra-individual ⇢c coefficients). The second of these figures corresponds, approximately, to the case where all of the rankings from different participants in a group of 6 out of the 20 participants were
38
A concordance analysis of preference judgments
Intra−individual
Inter−individual
Probability
Across sessions 0.25 0.2 0.15 0.1 0.05
Probability
Session 1
0.25 0.2 0.15 0.1 0.05
Probability
Session 2
0.25 0.2 0.15 0.1 0.05 −1
−0.8
−0.6
−0.4
−0.2
0
0.2
0.4
0.6
0.8
1
Consistency (concordance correlation)
Figure 3.1 Distribution of intra- and inter-individual ⇢c coefficients: 1 corresponds to perfect consistency, 0 corresponds to no consistency, -1 corresponds to perfect anti-consistency (i.e., exactly opposite rankings given on different trials). The symbols above the histograms report the across-participants average of the intra- and inter-individual consistency scores (error-bar = 95% confidence interval of the mean; the ordinate for the symbols has been chosen arbitrarily for display purposes).
significantly consistent with each other (the number of ⇢c coefficients between the trials of two different participants equals 100; the number of ⇢c coefficients between the trials of 6 different participants equals 1500, i.e., 7.89% of all the inter-individual ⇢c coefficients
Within−trial Across−trials Within−session across−trials
0.08 0.06 0.04 0.02 0 −0.02
Intra−individual consistency
Figure 3.2 Variation of inter-individual agreement (upper graph) and intra-individual consistency (lower graph) within and across the 10 preferenceranking trials.
39
Inter−individual agreement
3.2 Analysis and results
0.75 0.7 0.65 0.6 0.55
Session 1 1
2
Session 2 3
4
5
6
7
8
9
10
Trial
between the trials of all of the 20 participants). Further, more rigorous analyses were carried out on measures of intra- and inter-individual consistency computed for each of the participants (see Sec. 2.3.6 for details on how the intra- and inter-player consistency measures were defined). The reader is reminded that any statistical inferences on measures of inter-individual consistency should be treated with caution due to dependency issues. On average, whereas the measures of intra-individual consistency were substantially high, average value = .62, the measures of inter-individual consistency were not significantly different than zero, average value = .015, [t(19) = .85, p = .405]. Figure 3.1 reports the intra- and inter-individual consistency measures averaged across participants (see symbols above the histograms) across-sessions (upper graph) as well as within each session (middle and lower graphs).
40
A concordance analysis of preference judgments
Across−sessions
Inter−player
0.2 0.1 0 −0.1 −0.2
Session 1
Inter−player
0.2
Figure 3.3 Measures of intra- and inter-player consistency for each participant. Solid lines show least-squares fitting to the data.
0.1 0 −0.1 −0.2
Session 2
Inter−player
0.2 0.1 0 −0.1 −0.2
Professional Amateur 0.3 0.4 0.5 0.6 0.7 0.8 0.9
1
Intra−player
3.2.2 Variation of consistency within and between sessions The same method was adopted to carry out a more detailed analysis of the variation of intraand inter-individual consistency across the two experimental sessions. For both sessions, the average measure of intra-individual consistency was substantially high, average value = .6 and .72 for Sessions 1 and 2, respectively, and the average measure of inter-individual consistency was not significantly different from zero, average value = 0 and .037 for Sessions 1 and 2, respectively [t(19) 1.76, p .954]. Whereas intra-individual consistency did not significantly differ between Sessions 1 and 2 [paired-sample t(19) = 1.2, p = .247], inter-individual consistency was significantly higher in Session 2 than in Session 1 [paired-
3.2 Analysis and results
41
Across−sessions
Session 1
Session 2
Inter−session
Intra−individual consistency
1 0.9 0.8 0.7 0.6 0.5 0.4 0.3 0.2 0.1 1
2
3
4
5
6
7
8
9
10
11 12 13
14 15 16 17
18 19 20
Individuals
Figure 3.4 Different measures of intra-individual consistency for each participant. “Across-session” refers to averaging ⇢c coefficients for the same individual from both sessions, whereas “inter-session” is the average of the intra-individual scores computed by averaging ⇢c coefficients for the same individual in different sessions.
sample, t(19) = 2.79, p = .012]. Note, however, that despite falling short of significance, the increase in intra-player consistency from the first to the second session is of a relatively large size because it corresponds to an increase in the average of the intra-individual ⇢c measure of 1.2, thus signifying a small effect of training from Session 1 to Session 2. The increase in inter-individual agreement from the first to the second session, on the other hand, is negligible because it corresponds to an increase in the average of the inter-individual ⇢c measure of .037. The differences between the two sessions in comparison to the across-session averages can be observed further in Fig. 3.2, which illustrates how inter-individual agreement and intra-individual consistency (upper and lower graphs respectively) varied within and over the 10 preference-ranking trials. Whereas inter-player agreement reached a peak in the third trial during Session 1, it was gradually increased from one trial to the next in Session 2. Note, however, that these fluctuations are negligible (see previous discussion). Figure 3.3 shows how the intra-individual consistency measures for each participant are related to the corresponding inter-individual agreement measures across-sessions (upper graph) as well as
42
A concordance analysis of preference judgments
0.113
Intra−individual consistency
0.307
−0.158
1 0.9 0.8 0.7 0.6 0.5 0.4 0.3 0
10
20
Price of own violin ($K)
30
20
40
Years of experience
60 0
10
20
30
Practice (hours/week)
Figure 3.5 Spearman rank correlation between intra-individual consistency and self-reported participant characteristics: ⇢S coefficients are reported at the upper right corners; solid lines show least-squares fitting to the data.
within each experimental session (middle and lower graphs). No correlation between the self-consistency of a participant and their level of agreement with the other violinists was observed in any of the cases. Figure 3.4 reports how self-consistent each participant was within each of the sessions, across the two sessions (i.e., averaging ⇢c coefficients for the same individual from both sessions) and “inter-session:” the average of the intra-individual scores computed by averaging ⇢c coefficients for violin rankings for the same individual in different sessions. This measure of intra-individual, inter-session consistency was considerably high, average value = .559, significantly different from the intra-individual, intra-session measure of consistency for Session 1 [paired-sample t(19) = 2.36, p = .029] but not significantly different from the intraindividual, intra-session measure of consistency for Session 2 [paired-sample t(19) = 1.34, p = .195]. Participants 4 and 5 stand out as being the most self-consistent, followed by participants 3, 6, 10, 12 and 17 (i.e., 35% of the violinists were more than 70% self-consistent in their preference judgments). 3.2.3 Influence of participant characteristics The following analysis examined whether known characteristics of the participants explained the variability across participants in intra-individual consistency. First, a two-sample t-test was adopted to assess whether intra-individual consistency significantly differed
3.2 Analysis and results
43
between professional and amateur violin players (N = 13 and 7, respectively). Despite a tendency for professional violin players to be more self-consistent than amateur players, average intra-individual consistency = .636 and .592 respectively, the difference was not significant [independent samples t(18) = 0.72, p = .479, equal variance]. The Spearman rank correlation ⇢S between measures of intra-individual consistency on the one hand, and the self-reported price of the owned violin, the years of violin training, and the weekly hours of violin practice, on the other was then computed. Average imputation was used to replace missing values for these self-reported measures. None of the correlations was significant, |⇢S | .307 [p .188, df = 18]. Figure 3.5 illustrates how self-consistency was associated with each of the participant characteristics. 3.2.4 Preference ranking of the violins For each of the violins, a preference score defined as the proportion of times that a violin was ranked as preferred to all of the other violins throughout all the preference-ranking trials was computed. This measure is an asymmetric square matrix with zeroes in the diagonal. This was believed to be a more meaningful and informative way of pooling data across trials than, for example, averaging the rankings for each participant. The across-participants average preference scores for each violin are reported in Table 3.1 (rightmost column) and plotted in Fig. 3.6. Violin D showed the largest variability (see confidence interval) in the rankings across the different trials (see also Table 3.2).
Total preference score
0.9
Figure 3.6 Across-participants average of the preference score for each violin (error-bar = 95% confidence interval of the mean). The violins are ordered by ascending preference.
0.8 0.7 0.6 0.5 0.4 0.3 0.2 0.1 H
D
G
B
C
Violins
E
A
F
44
A concordance analysis of preference judgments
14 19 5 11 4 7
Figure 3.7 Agglomerative hierarchical cluster analysis on pairwise participantspecific preference profiles. The horizontal solid and dashed lines that connect individuals and clusters indicate their respective correlations. The preference profiles corresponding to each cluster are reported in Table 3.2.
13
Individuals
10 17 8 15 18 16 20 1 12 6 9 3 2 0.9
0.7
0.5
0.3
0.1
−0.1
−0.3
Concordance correlation between rankings
3.2.5 Preference profiles of participants For each participant, a preference profile based on the participant’s violin preference scores was obtained. To further inspect inter-individual differences in the preference for violins, these preference profiles were analyzed with a clustering method (agglomerative hierarchical cluster analysis, average linkage) to detect potential grouping of agreement in the behavioral data. The number of clusters was determined based on a cutoff value of .444 above which concordance correlations were considered significant at the .05 level. The results of the hierarchical cluster analysis confirmed the presence of a large amount of inter-individual variation in the preference for violins: the resulting dendrogram comprised 8 clusters of participants with closely correlated preference profiles (see Fig. 3.7; the lowest border between solid and dotted lines corresponds to the cutoff correlation). The largely varied preference profiles corresponding to each cluster of participants are reported in Table 3.2.
3.3 Summary and discussion
45
Table 3.2 Average violin preference profile for each cluster of participants (figure dashes indicate tied ranks). Cluster
Least ! most preferred
{Participants}
1
2
3
4
5
6
7
8
{5,11,14,19}
D
B
H
G
E
F
A
C
{4,7,13}
D
B
G
C
H
A
E
F
{10,17}
E
D
H
F
B
A
{8}
C
F
H
G
B
E
{15,18}
H
A
F
C
D
G
B
E
{16,20}
D
F
H
B
G
C
A
E
{1,3,6,9,12}
E
A
C
H
F
G
B
D
{2}
H
E
A
G
D
C
B
F
C-G
A-E
3.2.6 Verbal descriptions of violin preference Finally, we examined the spontaneous verbal responses of participants to the question “How and based on which criteria did you make your ranking?” (question A1). A total of 194 phrasings were coded into violin attributes and classified according to whether they described the sound (e.g., richness), the instrument (e.g., weight), or the interaction between the player and the instrument (e.g., easy to play). Linguistic devices constructed on the same stem (e.g., “rich,” “richness”) were grouped together. Class-attribute pairs (e.g., sound-richness) that were reported multiple times by the same participant across different trials and/or sessions were considered only once. A total of 84 attributes of the violin were thus extracted (see Table 3.3). The sole purpose of this analysis was to extract those attributes of the violin that participants considered important for preference in order to facilitate the design of attribute-rating scales for Study 2 (see Section 4.1.3). More comprehensive content and psycholinguistic analyses of the verbal data collected in this study are discussed in Chap. 6.
3.3 Summary and discussion A perceptual study of violin quality was carried out based on a carefully controlled playing test. The objective was to investigate intra-individual consistency and inter-individual
46
A concordance analysis of preference judgments Table 3.3 Free verbal descriptions for violin preference ranking criteria extracted from participant responses to question A1 (number N of occurrences across participants reported in parentheses except for descriptions with fewer than 2 occurrences). For the purposes of Study 2, only those attributes mentioned by at least 5 participants were considered and only the three indicated in bold used. The various verbalizations semantically related to “balance” (across the strings) are indicated in italics.
easy to play (11)
I
blurry
S
expressivity
I
response (8)
I
control
I
liberty
I
richness (7)
S
clean
S
open strings
S
resonance (7)
S
stability
I
mellowness
S
projection (6)
S
color range
S
opening
S
clarity (4)
S
complexity
S
openness
S
color (4)
S
consonants
S
pianissimo
S
playability (4)
I
dynamics
I
nuances
I
weight (4)
V
open strings
V
relation between strings
V
consistency (3)
S
darkness
S
pitch range
S
evenness (3)
S
dynamics
S
presence
S
power (3)
S
A- and D-string
S
quantity
S
problems (3)
S
E-string
S
range
S
feel (3)
I
ease
I
quick play on G-string
I
balance (2)
S
brightness
S
warmth
S
depth (2)
S
emotive possibilities
S
ringing
S
high register (2)
S
equality
S
roundness
S
overtones (2)
S
focus
S
silkiness
S
speaks (2)
S
fullness
S
smoothness
S
comfort (2)
I
easy to produce
I
[how] sound comes out
I
flexibility (2)
I
feel
V
liveliness
S
strong (2)
S
answer
I
velvety
S
sustained (2)
S
consistency
I
harmonics
S
shape (2)
V
easy to work with
I
volume
S
evenness (2)
V
colour layers
S
low register
S
balance (2)
V
reaction
I
consistency
V
equality (2)
V
built
V
string differentials
V
articulation
S
loudness
S
vibrancy
S
S
Sound, V
Violin, I
Interaction
3.3 Summary and discussion
47
agreement in preference judgments by experienced violinists. The results of this experiment showed that experienced violinists are self-consistent when assessing different instruments in terms of preference both within and across different-day experimental sessions. A small effect of training from Session 1 to Session 2 on self-consistency was observed but violinists were not significantly more self-consistent within one experimental session than across multiple sessions carried out in different days. This seems to suggest that the criteria used by individuals to evaluate violin preference remain stable over a relatively long time period. Furthermore, attempts to associate self-consistency with known (self-recorded) characteristics of the participants were rather inconclusive. In particular, there were no significant differences in self-consistency between professional violin players and amateur musicians, which appears to contrast with previous observations in listening tests (Willgoss and Walker, 2007). Despite being self-consistent, the various analyses reported above demonstrated a significant lack of agreement between string players in the preference for violins. The large inter-individual differences observed in the preference for violins could have two different origins. First, individual violin players may disagree on what particular qualities they look for in a violin. For example, some violinists may have a strong preference for violins that produce bright tones irrespective of differences in other sound or vibrational characteristics, whereas others may favor instruments that are easy to play notwithstanding how bright the resulting tone is. Similarly, the fact that the participants were using their own violins as a reference during the rankings could have exaggerated this effect. Second, different violin players may follow different processes to assess those qualities considered essential for the evaluation of an instrument (Fritz et al., 2010b). For example, all violinists may prefer instruments that are easy to play, but there may be differences in how ease of playing is evaluated across individuals. To tease apart these potential sources of variation across players in the preference for violins, a subsequent study was carried out to examine whether there would be more inter-individual agreement if violinists are asked to focus on specific attributes of the instrument. Concerning the methodology, the free verbal responses of participants to questions A4 and B4 helped identify two kinds of difficulties encountered by the violin players during the preference-ranking task that might have influenced how consistent they were within and between themselves. First, almost all participants expressed difficulties in ordering some of the violins, particularly in the middle and upper ranks, because they were perceived as
48
A concordance analysis of preference judgments
being very similar in terms of overall quality. This is illustrated in the following comment by a player: “In general I had a hard time ranking these instruments - many of them have strengths where others have weaknesses, thus finding an objective ranking for them becomes somewhat arbitrary.” Second, a few violinists reported changing their evaluation method from one trial to the other. As one participant explained: “Throughout the course of these evaluations I found that certain characteristics came up as positive in certain contexts whereas in others, they were negative. This had the effect of varying my rankings quite a bit. Specifically, when I played simple scales on the violins, I think I tended to pick the ones with the clearest, most powerful tone as my favourites. But when I was playing Bach or something else, I tended to pick the violins with slightly more character to their sound, often sacrificing power.” Concerning visual occlusion (question B3), only four players (20%) mentioned being bothered by the dark sunglasses. Concerning the “quality” of the tested violins, the responses provided by participants to questions A5 and B1 were examined. In responding to question A5, six participants (30%) reported they would place their own violin in the lower ranks, five violinists (25%) thought their instrument would be placed somewhere in the middle ranks, and eight musicians (40%) believed their violin was as good as the ones they ranked higher or better than all tested violins. This indicates that the overall quality of the instruments tested in the study was “good” or more participants would have given their own violin the highest rank. It also shows that not all violinists necessarily prefer their own instrument. Further, fourteen participants said they would buy some of the tested violins in Session 1 (assuming price was not an issue) but two of them changed their mind in Session 2; two of the musicians who wouldn’t buy any violin in Session 1 changed their mind in Session 2 (question B1). This indicates that 70% of the participants thought that the tested instruments were overall “good” or they would not consider buying some.
3.4 Bonus: Trial 11 An extra preference-ranking trial was carried out at the end of Session 2, followed by a relevant questionnaire. The objective was to examine whether visual characteristics of a violin considerably affect the evaluation of the instrument’s perceived qualities through an exploratory comparison of preference judgments made with versus without visual occlusion.
3.4 Bonus: Trial 11
49
3.4.1 Procedure and questionnaire Upon completing the last “with-sunglasses” trial of the second session (i.e., trial 10), participants were asked to take off the dark sunglasses and evaluate-rank the violins in normal lighting conditions (one ranking task, no further repetitions). Participants then provided written responses to a third set of open-ended questions (Questionnaire C) aiming to better understand if and how their perceptions changed: C1. In this new condition (without the sunglasses), did your overall perception of the violins change? If yes, how and why? / Dans cette nouvelle situation (sans les lunettes de soleil), est-ce que votre perception globale des violons a changé ? Si oui, en quoi et pourquoi ? C2. Did the fact that you could see the violins affect your judgment? If yes, why? / Est-ce que le fait que vous pouviez voir les violons a affecté votre jugement ? Si oui, pourquoi ? C3. On what criteria did you make your ranking this time? Did these criteria differ from the ones used in the previous tasks? If yes, how? / Quels critères avez-vous utilisés pour faire votre classement cette fois-ci ? Ces critères étaient-ils différents de ceux utilisés dans les autres tâches ? Si oui, en quoi ? C4. More generally, can you specify how much you take into account visual aspects when you choose a violin? Which ones are particularly important to you? How do they interact with the non-visual properties when making your judgment? / De manière plus générale, pouvez-vous spécifier dans quelle mesure vous prenez en compte les aspects visuels lorsque vous choisissez un violon ? Quels sont ceux qui sont particulièrement importants pour vous ? Comment interagissent-ils avec les autres propriétés lorsque vous faites votre jugement ? 3.4.2 Results and perspectives As previously, a preference score was computed for each violin based on the proportion of times that a violin was ranked as preferred to all of the other violins across all participants. Ordering the violins according to their preference score in this trial resulted in an overall
50
A concordance analysis of preference judgments
ranking that substantially agrees with the one obtained across the 10 visually occluded trials: -
least T1-T10
H
D
G
S ?
T11
H
◆ S◆ ◆S / S ◆ w
B
G
D
C
most preferred E
S ?
B
◆ S◆ ◆S / S ◆ w
E
C
A
F
S
◆ S◆ ◆S / S ◆ w
F
A
Nevertheless, violinists acknowledged the influence of the “look” of a violin in their verbal responses. Fourteen participants (70%) reported that their overall perception of the instruments changed in varying degrees because of the added visual information. Three of those players mentioned that their evaluation was nonetheless not affected by the look of the violins and thus their preference criteria were not modified. From the other eleven participants (55%) who confirmed that being able to see the violins influenced their judgment, six of them (30%) further reported altering their preference criteria, and hence their ranking, accordingly. Finally, twelve participants (60%) reported that when evaluating a violin, they generally take into account visual characteristics like its varnish (8 players, 40%), how aged/worn it looks (5 players, 25%), its curvature (5 players, 25%), the grain of the wood (4 players, 20%) as well as information regarding the origin and make of the instrument (1 player, 5%). Concerning how important these characteristics are in relation to sound and/or vibrotactile properties, most participants reported that the acoustical behavior of a violin is more decisive in evaluating quality than the instrument’s look. However, several responses illustrate that the perception of sound is often influenced by visual elements: Some of the violins were simply more beautifully made and aged than the others. Necessarily this will affect the sound that I’m perceiving. I feel a preference for unique looking instruments—particularly in terms of wood color and grain, and it has to do a little with shape. Maybe a quirky violin would explain a quirky sound—which I judge less harshly when the appearance is so singular.
3.4 Bonus: Trial 11
51
I found the sounds of each [violin] more characterful, now that I had something visual to help differentiate among the violins as well. I changed my mind about several of the violins because what had before seemed like a rich, loud sound, suddenly sounded harsh and boring. The overall ranking of the violins as well as the free verbal responses of the players in this trial provide a first indication of the ways in which the appearance, age and make of a violin can bias preference.
52
53
Chapter 4 Investigating the origin of inter-player differences in the preference for violins This chapter presents a subsequent study, which was designed to investigate the origin of the large inter-individual differences in the preference for violins observed in Study 1 and measure the extent to which different attributes are associated with preference, as well as to understand how consistency would be affected if violinists were asked to focus on particular violin attributes when considering preference. To this end, repetitive ratings by experienced players on specific attributes of the violin, as well as preference, were investigated in terms of intra-individual consistency and inter-individual agreement. The rating scales were determined based on the analysis of verbal data collected in Study 1 (see Sec. 3.2.6 and Table 3.3 on p. 46) as well as the potential for the verbal attributes to be correlated with measured vibrational properties of the violin. As in the previous study, participants were asked to discuss their choices through an open-ended questionnaire. Section 4.1 presents the materials and methods used in this study. The different correlation analyses and results are examined in Sec. 4.2. Section 4.3 reviews the findings of this study and concludes.
4.1 Materials and methods The experimental design developed for the purposes of this and subsequent studies has been presented in Sec. 2.3. The following sections will provide detailed descriptions of the particular materials and methods relevant to this study only.
54
Investigating the origin of inter-player differences Table 4.1 Violins used in Study 2. The most preferred violin (C) is indicated in bold and the least preferred violin (I) in italics. Violin H was included in Study 1 (labeled F, highest preference score). Violin
Origin
Luthiera
Year
Price
A
Italy
Gagliano
1770-75
$250K
B
Italy
Storioni
1799
$44K
C
Germany
Fisher
1787
$22K
D
Italy
Sderci
1964
$20K
E
France
Kaul
1933
$20K
F
France
-
2009
$17K
G
France
Guarini
1877
$11K
H
Germanyb
Unknown
Unknown
$8K
I
Canada
-
2005
$6K
J
China
-
2006
$2K
a b
The names of living luthiers are not provided for confidentiality purposes. This is based on a luthier’s informal appraisal, as there is no information regarding the make and age of this violin.
4.1.1 Participants and violins Thirteen skilled string players took part in this experiment (9 females, 4 males; average age = 28 yrs, SD = 9 yrs, range = 21–53 yrs; 8 native English speakers, 4 native French speakers, 1 other). They had at least 12 years of violin experience (average years of violin training = 22 yrs, SD = 9 yrs, range = 12–46 yrs; average hours of violin practice per week = 25 hrs, SD = 11 hrs, range = 7–42 hrs), owned violins with estimated prices ranging from $3K to $30K, and were paid for their participation. Eleven participants described themselves as professional musicians, and 6 had higher-level degrees in music performance (MMus, MA, DMus, DMA). They reported playing a wide range of musical styles [classical (92%), folk (31%), baroque (23%), and jazz/pop (15%)] and in various types of ensembles [chamber music (92%), symphonic orchestra (85%), solo (85%), and folk/jazz band (31%)]. Ten violins of different make (Europe, North America, China), age (1770–2009) and price ($2K–$250K) were used (see Table 4.1). More detailed description of how the violins were selected and setup as well as on all other experimental conditions is provided in Secs. 2.3.1–2.3.4.
4.1 Materials and methods
55
4.1.2 Questionnaire The same set of open-ended questions as in questionnaire B of Study 1 was given to participants at the end of the experimental session: B1. Would you buy any of these violins (assuming price wasn’t an issue)? Why? / Achèteriez-vous un des ces violons (en supposant que le prix ne soit pas un problème)? Pourquoi ? B2. More generally, what is a very good violin for you? / En général, comment définissezvous personnellement un très bon violon ? B3. To what extent was wearing sunglasses disturbing? Dans quelle mesure le port de lunettes de soleil vous a-t-il dérangé ? B4. Do you have any comments or remarks about the task you were involved in? / Avezvous des commentaires ou des remarques concernant la tâche à laquelle vous avez participé ? Answers to questions B1, B3 and B4 are discussed in Sec. 4.3. Verbalizations collected from question B2 are part of the content and psycholinguistic analyses presented in Chap. 6. 4.1.3 Criteria-scales Considering cognitive resource limitations (i.e., it is unlikely that a single participant can rate each violin along 80 different scales without using heuristics such as strongly correlating the responses for different scales, or without having a low level of precision in the rating of each of these 80 different violin attributes) as well as in view of logistical constraints (i.e., duration of the experimental session), only those attributes of the violin mentioned by at least 25% of the participants in Study 1 were considered (see Table 3.3 on p. 46). From these, resonance and projection were discarded due to potential problems associated with their evaluation in the present experimental context, such as: • The perception of resonance and projection of the sound may be strongly affected by the acoustics of the room in which the experiment is conducted (Weinreich, 1997).
56
Investigating the origin of inter-player differences • The same individual might possibly assess such characteristics of the same instrument differently when in the role of player versus listener at a different location in the same space. • Sound projection is a difficult quality to judge reliably solely by playing the violin (Loos, 1995).
A balance (response across the strings) rating scale was added because it was noticed that several violinists used verbalizations that were semantically related to this attribute (e.g., evenness, consistency, equality; see Table 3.3). Even though not justified by the analysis of the verbal data, dynamic range was also included because it has long been a source of investigation in the literature (Askenfelt, 1989; Woodhouse, 1993b; Schoonderwaldt et al., 2008). These five criteria had been previously proposed as part of a standardized procedure for evaluating violins (Bissinger and Gearhart, 1998). A very similar set was obtained when Inta et al. (2005) asked violinists to report evaluating qualities for purchasing a violin. Finally, an overall preference rating scale was added in order to examine the extent to which each of the selected attributes influences preference. To ensure common interpretation of the rating scales across all participants as much as possible, each criterion was presented in the form of a descriptive phrase alongside a short explanatory text: • The violin is easy to play - it requires minimal effort to produce sound, easy to avoid wolf tones, easy to “get around” the instrument; • The violin responds well - it produces desired sounds using a wide range of bowing gestures, it responds well to a wide range of actions of the player; • The violin has a rich sound - it produces a sound that is rich in harmonics and overtones; • The violin is well balanced across the strings - the playing behavior of this violin is similar across all strings; • The violin has a broad dynamic range (from piano to forte) - it can produce sounds of a wide range of dynamics, from piano to forte; • The violin is the one I prefer the most - (self-explanatory).
4.1 Materials and methods
57
It should be noted that the “definitions” of the five violin attributes provided to the participants were based on prior experience of the author and colleagues and not necessarily on a proper analysis of verbal data. For all criteria, unipolar continuous rating scales were preferred over bipolar scales. For the latter it is necessary to use antonyms that are semantically relevant (e.g., male : female). However, considering poor as the opposite of rich may not be pertinent to evaluating the sound of a violin (Fritz et al., 2012a). To comply with the descriptive form in which each criterion was presented to participants, the right end of each unipolar scale was labeled as “strongly agree” and the left end was labeled as “strongly disagree” (see Fig. 4.1).
Figure 4.1
Testing interface used to collect the ratings
4.1.4 Procedure The experimental session lasted two hours and was organized in three phases. In the first phase, participants were presented with the violins and the rating criteria. They were asked to play all instruments for 20 minutes to acquaint themselves with the set. Participants were also instructed to explore how much each attribute varied across the different violins in the set. The second phase involved a short training session with two trials to help participants familiarize themselves with the rating task. On each trial, participants were presented with a violin, which was not one of the ten violins used in the main session, and asked to rate it
58
Investigating the origin of inter-player differences
according to the given criteria. In the third phase, each of the ten violins was presented once in each of three subsequent blocks of ten trials, for a total of thirty trials. Participants thus rated each violin three times. The order of presentation of the violins within each block of trials was randomized (determined by computer calculations). On each trial, participants were asked to play and rate the violin according to each criterion on a unipolar continuous scale using on-screen sliders (see Fig. 4.1). They had to move each slider (i.e., rate each criterion) before being allowed to move to the next trial (i.e., violin). In order to end a trial and start the succeeding one, the participant clicked an on-screen button labeled “Next” that appeared only after all sliders had been moved. Participants were instructed to maximize evaluation speed and accuracy. No playing constraint was imposed on the evaluation process (e.g., specific repertoire). Participants were instead instructed to follow their own strategy. They were encouraged to play their own violin whenever they needed a reference point during the experiment. To minimize fatigue, they were encouraged to take breaks between each block of trials. Upon completing the last trial, participants provided written responses to questionnaire B.
4.2 Analysis and results Four different analyses were carried out. Firstly, the measures of intra- and inter-individual consistency for each of the rated attributes were compared. The significance of differences between the intra- and inter-individual consistency measures for the preference scale on the one hand, and each of the other attribute-rating scales on the other were assessed. As a part of this analysis, the measures of intra- and inter-individual consistency recorded during Study 2 for the preference rating scale were also compared with those recorded during Study 1. Secondly, the effects of participant characteristics on the measures of intra-individual consistency computed for each of the attribute-rating scales were assessed. Thirdly, an overall score for each of the violins was derived and used to conduct cluster analysis for the preference rating scale as well as for each of the attribute-rating scales. Finally, the extent to which preference ratings for each participant could be predicted based on ratings of the different attributes was measured.
4.2 Analysis and results
59
4.2.1 Intra- and inter-player consistency For each rating scale, intra- and inter-individual consistency was measured and assessed based on the ⇢c between ratings given on different blocks of trials. The same approach described for the analysis of the results of Study 1 was followed. Figure 4.2 describes the distribution of intra- and inter-individual ⇢c coefficients. The intra-individual ⇢c distribution is highly asymmetrical for each attribute and varies considerably across the different attributes, while the inter-individual ⇢c distribution is roughly symmetrically centered around zero for all scales. The across-participants average of the intra- and inter-individual consistency scores measured for each of the attribute-rating scales are shown in Fig. 4.3 (left plot) and reported in Table 4.2. Figure 4.3 displays the across-scales average intra-individual consistency for each of the participants. The reader is reminded that any statistical inferences on measures of inter-individual consistency should be treated with caution due to dependency issues (see Sec. 2.3.6). The following were observed: • The measures of inter-individual consistency were significantly higher than zero for the cases of easy to play, richness and preference scales, average value = .064, .068 and .089 respectively [t(12) 2.46, p < .031] but not for the response, balance and dynamic range scales, average value = .042, -.005 and .071 respectively [t(12) 1.98, p .07]. Intra-individual consistency was also significantly higher than zero for all attributerating scales (for average values see Table 4.2) [t(12) 3.17, p .008], and was significantly higher than inter-individual consistency [paired samples t(12) 2.31, p .04]. • Significant differences emerged between the inter-individual consistency measured for the preference scale on the one hand, and the response, balance and dynamic range scales on the other [paired samples t(12) 2.53, p .026], while the measures of inter-individual consistency for each of the easy to play and richness scales were not significantly different than those for the preference scale [paired samples t(12) 1.52, p .155]. The analysis of intra-individual consistency revealed no significant difference between the preference and any of the attribute scales [absolute value of paired samples t(12) 1.99, p .069], with the exception of a significantly lower level of intra-individual consistency for balance than for preference [paired samples t(12) = 3.09, p < .01].
60
Investigating the origin of inter-player differences
Intra−individual Easy to play
Response
Richness
Balance
Dynamic range
Preference
Inter−individual
Probability
0.2 0.15 0.1 0.05
Probability
0.2 0.15 0.1 0.05
Probability
0.2 0.15 0.1 0.05 −1 −0.8−0.6−0.4−0.2
0
0.2 0.4 0.6 0.8
Consistency (concordance correlation)
1 −1 −0.8−0.6−0.4−0.2
0
0.2 0.4 0.6 0.8
1
Consistency (concordance correlation)
Figure 4.2 Distribution of intra- and inter-individual ⇢c coefficients: 1 corresponds to perfect consistency, 0 corresponds to no consistency, -1 corresponds to perfect anti-consistency (i.e., exactly opposite rankings given on different trials).
• Figure 4.4 illustrates how intra-individual consistency and inter-individual agreement (left and middle graphs respectively) varied within and over the three blocks of repetitions. The middle graph indicates a decrease in inter-individual agreement across the three blocks. A potential cause for this unexpected pattern is that participants started with a very undifferentiated strategy for rating across the various scales and then differentiated their criteria per scale as repetitions progressed. To this end, the across-participants average inter-scale self-correlation within each block of repetitions was measured to examine whether it is weaker in the later blocks (see right graph in Fig. 4.4).
4.2 Analysis and results
61
Intra−
Inter−
p < .05
Easy to play Response Richness Balance Dynamic range Preference
−0.3
−0.1
0.1
0.3
0.5
0.7
0.9
Consistency (concordance correlation)
−0.3
−0.1
0.1
0.3
0.5
0.7
0.9
Partial rank correlation with Preference
Figure 4.3 Left plot: Across-participants average intra- and inter-individual consistency scores for each of the attribute-rating scales and preference; note the partcicularly low levels of self-consistency in all scales. Right plot: Partial Spearman rank correlation between each of the attribute-rating scales and preference; only the attributes of richness and, to a lesser extent, dynamic range were singificantly correlated with overall preference (shown in darker color).
• In Fig. 4.5 the intra-individual consistency measures for each of the participants are averaged across all scales. Four groups of participants can be observed in order of increasing self-consistency: {11}, {1,2,4,9}, {3,5,6,8,13} and {7,10,12}. In particular, participant 11 was an outlier (i.e., their self-consistency was “consistently” below 0 in all rating scales). • Figure 4.6 shows how the intra-individual consistency measures for each participant are related to the corresponding inter-individual agreement measures for each of the attribute-rating scales as well as for preference. No correlation between the selfconsistency of a participant and their level of agreement with the other violinists was observed in any of the cases.
62
Investigating the origin of inter-player differences
Consistency (concordance correlation)
Easy to play Response Richness Balance Dynamic range Preference
Within−block Across−blocks
0.55 0.5 0.45 0.4 0.35 0.3 0.25
Across−individuals average inter−scale self−correlation
0.2 0.15 0.1 0.05 0 −0.05
Intra−individual 1
2
Inter−individual 3
Block of trials
1
2
Block of trials
3
1
2
3
Block of trials
Figure 4.4 Variation of intra-individual consistency (left graph) and interindividual agreement (middle graph) within and across the three blocks of repetitions (legends apply to both plots; note that it is not possible to measure within-block intra-individual consistency). Right graph: Across-participants average inter-scale self-correlation within each block of repetitions.
4.2.2 Comparison with Study 1 The overall measures of intra- and inter-individual consistency collected during Study 1 were compared with those measured during Study 2 for the preference rating scale. Intra-individual consistency for the evaluation of preference was significantly higher in Study 1 than in Study 2, average value = .62 and .38, respectively [independent samples t(30.6) = 3.06, p = .005, unequal variance]. Inter-individual consistency in the evaluation of preference was instead significantly higher in Study 2 than in Study 1, average value = .089 and .015, respectively [independent samples t(31) = 2.63, p = .013, equal variance].
4.2 Analysis and results
63
Intra−player consistency
0.7 0.6 0.5 0.4 0.3 0.2 0.1 0 −0.1 1
2
3
4
5
6
7
8
9
10
11
12
13
Individuals
Figure 4.5 Across-scales average intra-individual consistency for each of the participants (error bar = 95% confidence interval of the mean).
4.2.3 Influence of participant characteristics For each of the rating scales, the association between the participant-specific measures of intra-individual consistency on the one hand, and the self-reported price of the owned violin, the years of violin training, and the weekly hours of violin practice on the other, was assessed. As for Study 1, this analysis was carried out by computing the Spearman rank correlation ⇢S between intra-individual consistency scores and participant characteristics. Figures 4.7 and Table 4.2 Left and middle columns: Across-participants average intraindividual consistency and inter-individual agreement measures for each of the attribute-rating scales and preference. Right column: Partial Spearman rank correlation between each of the attribute-rating scales and preference. For 95% confidence intervals of the averages, the reader is referred to Fig. 4.3. Intra
Inter
Easy to play Response Richness Balance Dynamic range
.24 .328 .389 .203 .333
.064 .042 .068 .005 .071
Preference
.38
.089
⇢p with Preference .079 .021 .634 .015 .28
Investigating the origin of inter-player differences
Inter−individual agreement
Inter−individual agreement
Inter−individual agreement
64
0.3 0.2 0.1 0 −0.1 −0.2
Easy to play
Response
Richness
Balance
Dynamic range
Preference
0.3 0.2 0.1 0 −0.1 −0.2
0.3 0.2 0.1 0 −0.1 −0.2 −0.2
0
0.2
0.4
0.6
Intra−individual consistency
0.8
−0.2
0
0.2
0.4
0.6
0.8
Intra−individual consistency
Figure 4.6 Measures of intra-individual consistency versus inter-individual agreement for each participant. Solid lines show least-squares fitting to the data.
4.8 illustrate how self-consistency was associated with each of the participant characteristics for preference and for each of the violin attributes respectively. No association was significant [absolute value of ⇢S .432, p .141, df = 11] except for a significant decrease in the
4.2 Analysis and results
0.432
−0.222
0.6 0.4
Preference
−0.061
0.8
Self−consistency
65
0.2 0 −0.2 0
10
20
30
Price of own violin ($K)
15
30
45
Years of experience
12
22
32
42
Practice (hours/week)
Figure 4.7 Spearman rank correlation between intra-individual consistency and self-reported participant characteristics for the preference scale: ⇢S coefficients are reported at the upper right corners; solid lines show least-squares fitting to the data.
intra-individual consistency for the response scale with increasing number of weekly violinpractice hours [⇢S = .562, p = .045, df = 11]. It should be nonetheless emphasized that this significant result is likely a false positive. Indeed, after a very conservative control of the false-positive rate (Bonferroni-corrected critical p-value, adjusted for the number of participant characteristics = .05/3), none of the ⇢S coefficients was significant. Given the small number of amateur as compared to professional violin players who participated in this study (N = 2 and 11, respectively), no t-test was carried out to assess the effects of this last participant characteristic on the measures of intra-individual consistency. 4.2.4 Violin rating scores For each of the violins, a preference score defined as the across-participants average preference rating of a violin throughout all trials (i.e., only the preference ratings from each trial were considered) was computed. Similarly, for each of the attribute-rating scales, an acrossparticipants average rating score for each of the violins was obtained. The across-participants average rating scores for each violin and for each scale are shown in Fig. 4.9 (violins are ordered by increasing preference for all scales) and reported in the upper part of Table 4.3: • The error bars were relatively larger for the cases of preference and richness, indicating larger variability in how the violins were rated by the different musicians in the respective scales.
Investigating the origin of inter-player differences
Self−consistency
−0.360
0.196
−0.562
−0.134
0.420
−0.357
−0.114
−0.241
0.066
0.033
0.246
−0.125
Dynamic range
Self−consistency
−0.366
Balance
Self−consistency
0.006
Richness
Self−consistency
−0.402
Response
0.8
Easy to play
Self−consistency
66
0.6 0.4 0.2 0 −0.2 0.8 0.6 0.4 0.2 0 −0.2 0.8 0.6 0.4 0.2 0 −0.2 0.8 0.6 0.4 0.2 0 −0.2 0.8 0.6 0.4 0.2 0 −0.2 0
10
20
30
Price of own violin ($K)
15
30
45
Years of experience
12
22
32
42
Practice (hours/week)
Figure 4.8 Spearman rank correlation between intra-individual consistency and self-reported participant characteristics for each of the attribute-rating scales: ⇢S coefficients are reported at the upper right corners; solid lines show least-squares fitting to the data.
4.2 Analysis and results
67
• The balance rating scores of the violins were highly similar across the group, suggesting that balance was not a discriminative criterion. This interpretation is further supported by the fact that the lowest intra- and inter-player consistency values were obtained for balance (see left part of Fig. 4.3). A different score was also computed for each of the violins by following the same procedure as in Study 1 (i.e., defined as the proportion of times a violin was rated as more preferred/being easier to play/responsive/having a richer sound/balanced/having a wider dynamic range than any of the other violins; see 3.2.4). These average ranks are reported in the lower part of Table 4.3. The differences observed are negligible and the two ways of ordering the violins are substantially similar for each evaluative scale. 4.2.5 Preference and attribute profiles of participants For each participant, scale-specific profiles based on the participant’s violin rating scores were obtained. To further inspect inter-individual differences in the preference for violins as well as in the evaluation of each of the attributes, these profiles were analyzed with a clustering method (agglomerative hierarchical cluster analysis, average linkage) to detect potential grouping of agreement in the behavioral data for each of the rating scales. For each scale, the number of clusters was determined based on a cutoff value of .553 above which concordance correlations were considered significant at the .05 level. The results of the hierarchical cluster analysis confirmed the presence of a large amount of inter-individual variation in the preference for violins as well as in the evaluation of each of the attributes. The resulting dendrograms are depicted in Fig. 4.10 (the lowest border between solid and dotted lines corresponds to the cutoff correlation). For balance and dynamic range only two participants are grouped together, suggesting a significant lack of discrimination between violinists in their evaluations. The similarities between the formed clusters for richness and those for preference (i.e., clusters {4,7} and {3,6} were observed in both cases) indicated a relationship between the ratings on the two scales. 4.2.6 Relationship between preference and attribute ratings The remaining analyses assessed the relationship between preference and attribute ratings. All analyses were carried out on the participant-specific attribute ratings along each of the scales, averaged across trials. For each of the participants, a multiple rank-regression model
68
Investigating the origin of inter-player differences
Table 4.3 Top: Across-participants across-trials average violin rating scores. Bottom: Proportion of times a violin was rated higher than any of the other violins throughout all trials (average rank). Parentheses report the 95% confidence interval of the mean. The differences observed are negligible and the two ways of ordering the violins are substantially similar for each scale. Violin
Easy to play
Response
Richness
Balance
Dynamic range
Preference
Average rating A
.52(.1)
.54(.11)
.45(.12)
.59(.07)
.58(.09)
.46(.11)
B
.63(.09)
.6(.1)
.53(.14)
.63(.06)
.53(.1)
.55(.16)
C
.68(.08)
.67(.11)
.63(.13)
.64(.11)
.67(.08)
.69(.14)
D
.54(.09)
.56(.08)
.41(.1)
.57(.1)
.57(.1)
.43(.12)
E
.63(.09)
.67(.1)
.54(.15)
.63(.06)
.69(.11)
.58(.17)
F
.57(.11)
.56(.11)
.54(.12)
.62(.1)
.51(.12)
.53(.14)
G
.57(.09)
.61(.11)
.47(.11)
.57(.1)
.57(.11)
.4(.11)
H
.58(.12)
.62(.11)
.64(.12)
.56(.1)
.56(.11)
.61(.15)
I
.46(.1)
.52(.08)
.39(.09)
.6(.05)
.52(.12)
.38(.09)
J
.66(.1)
.63(.12)
.53(.15)
.62(.09)
.60(.14)
.58(.17)
A
.36(.09)
.36(.13)
.37(.12)
.41(.11)
.45(.11)
.41(.1)
B
.5(.13)
.44(.12)
.47(.15)
.52(.1)
.41(.1)
.47(.15)
C
.56(.12)
.59(.11)
.59(.12)
.55(.13)
.53(.12)
.62(.14)
D
.35(.13)
.37(.15)
.29(.13)
.38(.12)
.42(.13)
.33(.15)
E
.5(.1)
.53(.13)
.49(.16)
.49(.11)
.61(.16)
.53(.15)
F
.43(.13)
.4(.13)
.49(.11)
.48(.13)
.39(.17)
.47(.11)
G
.4(.08)
.46(.13)
.41(.08)
.39(.11)
.41(.12)
.32(.1)
H
.5(.12)
.47(.14)
.59(.13)
.37(.14)
.4(.15)
.51(.13)
I
.28(.09)
.32(.1)
.28(.08)
.39(.08)
.37(.13)
.28(.1)
J
.6(.11)
.56(.13)
.5(.13)
.49(.11)
.5(.13)
.55(.1)
Average rank
lowest rating/rank
highest rating/rank
4.2 Analysis and results
69
1 0.9
Average rating
0.8 0.7 0.6 0.5 0.4 0.3 0.2 0.1
Easy to play
Response
Richness
Balance
Dynamic range
Preference
0.9
Average rating
0.8 0.7 0.6 0.5 0.4 0.3 0.2 0.1
0.9
Average rating
0.8 0.7 0.6 0.5 0.4 0.3 0.2 0.1 0
I
G
D
A
F
B
Violin
J
E
H
C
I
G
D
A
F
B
J
E
H
C
Violin
Figure 4.9 Across-participants across-trials average rating scores for each violin (error bar = 95% confidence interval of the mean). For all scales, violins are ordered by increasing preference score (shaded background).
70
Investigating the origin of inter-player differences
Individuals
1
10 1
3 6 11
4
8
2
7
11
1
3
2
8
6
4
12
11
6
4
2
12
7
9
13
13
5
7
9
10
3
5
13
9
10
5 13
4 7
6
7
8
10
2
2
12
10
6
8
13
4
3
4
3
6
1
1
11
9
8
2
13 1
3
12
5
12
11
10
11
9
9
0.7
0.5
0.3
0.1 −0.1
Concordance correlation
0.7
0.5
0.3
0.1 −0.1
Concordance correlation
Preference
7
Dynamic range
Balance
5
Individuals
5
Richness
12
Response
Easy to play
8
0.7
0.5
0.3
0.1 −0.1
Concordance correlation
Figure 4.10 Agglomerative hierarchical cluster analysis on pairwise participant-specific preference and attribute profiles. The horizontal solid and dashed lines that connect individuals and clusters indicate their respective correlations.
4.2 Analysis and results
71
was initially estimated to predict the ranks of the preference ratings based on the ranks of the ratings along the attribute scales. Across participants, attribute ratings predicted a very large amount of variance of the ranked preferences, average R2 = .901, SD = .106 (see Fig. 4.11). One possible interpretation for this result is that participants used a highly economic response strategy that led them to give strongly correlated ratings along each of the scales irrespective of their actual beliefs about the relationship between violin attributes and preference, thus resulting in a strong association between all scales, preference included—for example, a hypothetical participant assigning similar ratings to all scales. In order to avoid this possible interpretation, further analyses on the relationship between preference and attribute ratings were carried out based on partial rank correlation coefficients ⇢p . The partial correlation ⇢p (A, B · C) between variables A and B after controlling for variable C is the correlation of the residuals of the regression model that predicts A from C with the residuals of the regression model that predicts B from C. As such, ⇢p (A, B · C) assesses the association between A and B after eliminating the variance that both A and B share with the controlled variable C. For example, ⇢p (Preference, Richness · non-preference and non-richness scales) measures the association between ratings along the preference and richness scales after removing the variance that preference and richness ratings share with ratings along the other scales. For each participant, the partial rank correlation between the preference ratings on the
mean R2 = 0.9 10
Predicted preference ranks
Figure 4.11 Multiple rank-regression of preference ratings on the ratings along the attribute scales. The very high R2 value is likely a result of the experimental design: rating all scales simultaneously prompted a very economic response strategy.
9 8 7 6 5 4 3 2 1
1
2
3
4
5
6
7
8
Observed preference ranks
9
10
72
Investigating the origin of inter-player differences
one hand, and the ratings on each of the attribute scales on the other, while controlling for the ratings along the remaining scales, was computed. The across-participant average of the ⇢p coefficients are shown in Figure 4.3 (right graph) and reported in Table 4.2. Interestingly, preference ratings were significantly associated with two violin attributes: richness, average ⇢p = .634 [t(12) = 6.05, p < .001], and dynamic range, average ⇢p = .28, [t(12) = 2.59, p = .024]. Thus, despite the large amount of inter-individual differences in the evaluation of the different attributes and of preference, participants consistently preferred violins with a richer sound and with a wider dynamic range. Across participants, none of the other ⇢p coefficients was significant, average absolute ⇢p .079, [absolute t(12) 0.49, p .636].
4.3 Summary and discussion The results of this experiment showed that experienced violin players are, on average, not very self-consistent when evaluating different violins based on certain characteristics of the instrument as well as in terms of preference. The large inter-individual differences in the preference for violins observed in Study 1 were also confirmed and similarly large variations between individual players in rating various violin attributes were revealed. No significant differences were observed between the level of intra-individual consistency in the preference ratings and that in the attribute ratings, with the exception of balance, for which self-consistency was significantly lower than that observed for preference. Only two players reported being bothered by the dark sunglasses (question B3), whereas no participant reported that the task was difficult overall (question B4). Eight participants (61.5%) said they would buy some of the tested violins assuming price was not an issue but five violinists (38.5%) thought that none of these instruments were “good” enough to consider purchasing (question B1). Similarly to Study 1, attempts to associate self-consistency with known (self-recorded) characteristics of the participants were largely inconclusive. Perhaps more importantly, participants were significantly more self-consistent when evaluating preference in Study 1 than in Study 2. Many methodological differences between the two experiments could explain this effect. The higher number of trials in Study 1 (ten rankings of each violin across the two sessions) than in Study 2 (three ratings of each violin) gave participants a better opportunity to stabilize their response criteria and to accumulate more experience with the evaluated violins. The presence of multiple response scales in Study 2 but not in Study 1 did not allow participants in Study 2 to evaluate preference with
4.3 Summary and discussion
73
the same level of attention as during Study 1. Finally, due to experimental time constraints, participants in Study 2 had to rate all criteria, including preference, for a given violin rather than being able to compare the various violins to determine their respective ratings for a particular criterion. When evaluating a violin according to specific criteria, players will have their own weightings that define how important each criterion is for them. According to the regression analysis, preference prediction from individual weightings was very high in this experiment, meaning individual players appeared to make their preference judgments by taking into account the various attributes that emerged from the analysis of the verbal data from Study 1, and using a relatively consistent weighting of these attributes to determine their overall preference for an instrument. A further examination of the association between preference ratings and violin attributes based on measures of partial rank correlation revealed that participants strongly agreed in preferring violins with a rich sound and, to a lesser extent, a wide dynamic range. Combined with the observed low level of inter-individual consistency in both the preference ratings and the ratings on the different attributes, these results show that whereas violinists tend to agree of what particular qualities they look for in an instrument (in this case, sound richness and a broad dynamic range), the perceptual evaluation of the same attributes strongly varies across individuals, thus likely resulting in large inter-individual differences in the preference for violins. A final consideration is necessary about the interpretation of the large variability in the preference judgments by experienced violinists. Concerning the origin of inter-individual differences in the preference for violins (see 3.3), the above observations seem to support, at least in part, the second hypothesis, that different players may follow different perceptual processes to assess different attributes of the violin. On the other hand, there remains the issue of varying playing approaches taken by players to assess different attributes. In this experiment, no playing constraints were imposed on the evaluation process (e.g., specific repertoire). Participants were instead instructed to follow their own strategy with respect to what and how to play. The only way one could discuss this issue further is if one prescribed the musical gestures and/or material that the violin players were allowed to use for the evaluation task. And that still would not address differences in the way people play. Different violinists may use different combinations of gestures when playing, each producing a fundamentally different behavior of the instrument for a certain criterion. For example, player A may use more bow force than player B and thus produce a “brighter”
74 timbre (Schoonderwaldt, 2009c).
Investigating the origin of inter-player differences
75
Chapter 5 Effects of task constraints and type on player reliability The studies discussed in the previous chapters showed that experienced violinists are selfconsistent when evaluating different instruments in terms of overall preference and certain perceived qualities in free-playing tasks, though there was a significant lack of agreement between individuals. One of many hypotheses about the origin of the large inter-individual differences in violin preference is that players may take varying playing approaches to assess different attributes of the instrument (see Sec. 4.3). To this end, a new experiment was designed to investigate the perceptual evaluation of richness and dynamic range in playing tasks based on prescribed musical material and techniques. The objective was to compare intra-individual consistency and inter-individual agreement in constrained (i.e., playing only certain notes in certain registers) versus unconstrained (i.e., playing a certain excerpt from the violin repertoire) tasks for the cases of richness and dynamic range. The perceptual evaluation of richness was further investigated using the constrainedplaying task, which was recorded, and a subsequent listening task (using the previously recorded sounds). The goal was to compare the evaluation of richness from playing versus listening tasks in order to better understand whether it is based on different criteria and/or perceptual processes in the two settings. As in the previous studies, violin players were asked to discuss their choices through specially designed questionnaires. The study was focused on the perceptual characteristics of richness and dynamic range as they had been previously found to be highly correlated with violin preference (see Chap. 4). Section 5.1 describes how the playing and listening sessions
76
Effects of task constraints and type on player reliability
were designed. In Sec. 5.2, intra- and inter-player reliability are compared in constrained versus unconstrained violin-playing tasks. Section 5.3 focuses on how intra-player consistency varies between playing and listening settings. The potential correlation of spectral centroid and the three tristimulus ratios with the perception of violin sound richness are examined in Sec. 5.4. Results are summarized and discussed in Sec. 5.5.
5.1 Materials and methods The experimental design developed for the purposes of this and previous studies has been presented in Sec. 2.3. The following sections will provide detailed descriptions of the particular materials and methods relevant to this study only. The constrained and unconstrained violin-playing tasks for the perceptual evaluation of quality were designed with input from an experienced violin player and accomplished researcher. 5.1.1 Participants and violins Sixteen skilled string players took part in this experiment (8 females, 8 males; average age = 32 yrs, SD = 8 yrs, range = 21-55 yrs; 9 native English speakers, 2 native French speakers, 5 other). They had at least 15 years of violin experience (average years of violin training = 25 yrs, SD = 8 yrs, range = 17–48 yrs; average hours of violin practice per week = 15 hrs, SD = 11 hrs, range = 3–35 hrs), owned violins with estimated prices ranging from $3K to $70K, and were paid for their participation. Eleven participants described themselves as professional musicians, and 10 had higher-level degrees in music performance (MMus, MA, DMus, DMA). They reported playing a wide range of musical styles [classical (81%), folk (13%), jazz/pop (6%), and contemporary (6%)] and in various types of ensembles [symphonic orchestra (38%), chamber music (31%), folk/jazz band (25%), and solo (19%)]. Five violins of different make (Europe, North America, China), age (1914–2011) and price ($2.7K–$71K) were used in Study 3 (see Table 5.1). One of the violins (D) had been used in Study 1 (the most preferred, labelled F in Table 3.1) as well as in Study 2 (labelled H in Table 4.1). More detailed information on how the violins were selected and setup as well as on all other experimental conditions is provided in Secs. 2.3.1–2.3.4.
5.1 Materials and methods
77
Table 5.1 Violins used in Study 3. Violin D was included in Study 1 (labelled F, highest preference score) and Study 2 (labelled H). Violin
Origin
Luthiera
Year
Price
A
Italy
Contino
1916
$71K
B
Switzerland
-
2003
$30K
C
Denmark
Hjorth
1914
$20K
D
Germanyb
Unknown
Unknown
$10K
E
China
-
2011
$2.7K
a b
The names of living luthiers are not provided for confidentiality purposes. This is based on a luthier’s informal appraisal, as there is no information regarding the make and age of this violin.
5.1.2 Playing tasks For each of the perceptual characteristics of richness and dynamic range, a constrained- and an unconstrained-playing task were designed. The constrained task was different for each of the attributes (i.e., different musical material and technique) while the unconstrained task was recurrent across the attributes. The unconstrained task was also used for the evaluation of preference. The richness-constrained task was focused on the lower register of the violin, in particular on the G-string (see Fig. 5.1a). It involved playing the first eight notes of the chromatic scale G2 ! D3 détaché, first without vibrato followed by a repetition with vibrato. Participants were instructed to follow a 50 bpm tempo and use the whole bow. The dynamic rangeconstrained task comprised only the notes B2[ on the G-string and B4[ on the E-string (see Fig. 5.1b). Participants were instructed to follow a 60 bpm tempo and play détaché, without vibrato, as soft and as loud as possible to obtain a clear sound (i.e., the sound doesn’t break). The unconstrained task used for the evaluation of both richness and dynamic range as well as for preference involved playing the opening solo passage from Max Bruch’s Violin Concerto No. 1 in G Minor, Op. 26 (Movement I: Prelude; see Fig. 5.1c). The particular excerpt was chosen because it incorporates the whole range of the instrument (as opposed to the two constrained tasks) as well as a variety of techniques and dynamics. Unlike the free-playing approach adopted in our previous studies, the idea of constrained versus unconstrained playing in this experiment concerned the playing range of the instrument
78
Effects of task constraints and type on player reliability
! = 50
$ #
!
! "! mf
"!
!
!
"!
!
(a) Constrained 1: richness - détaché, with and without vibrato, use whole bow, 50 bpm
! = 60
$ % & #! ppp $ # " !% fff ! = 60
" #! & %
# !$
# !"
ppp ! %$
%&
fff
(b) Constrained 2: dynamic range - détaché, without vibrato, 60 bpm
Max Bruch, Violin Concerto in G Minor, Prelude
!" !" !+ " # ! ! ! # ! ! ! # ! ! % ! ! ! ! "! ! ) ! # !& " ! ! ! ! ! $ ! ,! *) ' ! rit. ( !!! f Allegro moderato espr.
(c) Unconstrained: richness, dynamic range, preference
Figure 5.1 Playing tasks (musical material and technique) used in Study 3 for the perceptual evaluation of violin richness and dynamic range.
5.1 Materials and methods
79
on which violinists were permitted to focus (1 or 2 strings versus all strings) as well as the playing technique they could apply (strict versus loose instructions) during the evaluation procedure. In this respect, the idea of “unconstrained” is not similar to that of “free.” In the latter, which was not used in the current study but only in the previous two, the participants would be encouraged to choose both their own materials and techniques—and those would often change from one trial to the next, whereas the musical material would be common for all players in the former. 5.1.3 Recordings The richness-constrained task was recorded by each participant in order to (a) capture the stereo stimuli for the listening test and (b) extract certain audio features: • For (a), the X-Y stereo microphone positioning technique using a pair of condenser microphones with cardioid patterns (DPA 4011-TL) was followed. The two microphone capsules were mounted on top of each other (i.e., coincident position) at an angle of 90 degrees, their center facing directly at the top side of the played violin from a distance of 7 feet (see Fig. 5.2). The recorded musical phrases were digitized through a RME Micstasy 8-channel microphone preamplifier and saved in 16-bit, stereo 48 kHz WAV format. • For (b), a 1/2-inch free-field microphone (Brüel & Kjær Type 4190-L-001 with Type 2669-L preamplifier) with a sound quality conditioning amplifier (Brüel & Kjær Type 2672) were used. The microphone was positioned 3 feet from the played violin, facing directly at its top side (see Fig. 5.2). The gain of the amplifier was set at 20 dB and a high-pass filter at 20 kHz was selected. The recorded notes were saved in 32-bit, stereo 48 kHz WAV format. 5.1.4 Questionnaires A first set of open-ended questions was given to participants at the end of the playing-test session (Questionnaire P), comprising questions related to the perception and evaluation of violin richness and dynamic range and how they relate to overall violin quality: P1. How and based on which criteria did you make your preference ranking? / Avec quels critères avez-vous effectué votre classement de préférence et de quelle fa¸con les
80
Effects of task constraints and type on player reliability avez-vous utilisés ?
P2. What does richness mean for you? / Qu’est-ce que la richesse signifie pour vous ? P3. When you evaluate a violin, how important is richness in your overall judgment compared to other characteristics of the instrument? / Quand vous évaluez un violon, quelle importance accordez-vous à la richesse par rapport aux autres caractéristiques dans votre jugement global de l’instrument ? P4. How would you evaluate a violin in terms of richness? Comment évalueriez-vous un violon en termes de richesse ? P5. What does dynamic range mean for you? / Qu’est-ce que la gamme dynamique signifie pour vous ? P6. When you evaluate a violin, how important is dynamic range in your overall judgment compared to other characteristics of the instrument? / Quand vous évaluez un violon, quelle importance accordez-vous à la gamme dynamique par rapport aux autres caractéristiques dans votre jugement global de l’instrument ? P7. How would you evaluate a violin in terms of dynamic range? / Comment évalueriezvous un violon en termes de gamme dynamique ? P8. Did you have difficulty with any of the tasks? If so, please explain. / Avez-vous eu des difficultés avec l’une des tâches demandées ? Si oui, lesquelles et pourquoi ? P9. To what extent was wearing sunglasses disturbing? / Dans quelle mesure le port de lunettes de soleil vous a-t-il dérangé ? P10. Do you have any further comments or remarks about the tasks you were involved in? / Avez-vous d’autres commentaires ou des remarques concernant les tâches auxquelles vous avez participé ? A second questionnaire was presented to participants at the end of the listening-test session (Questionnaire L), consisting of open-ended questions referring to the perception and evaluation of violin richness in playing versus listening tasks and how much sound influences overall violin quality judgments:
5.1 Materials and methods
81
L1. In this new condition (listening), did your overall perception of richness change? If yes, how and why? / Dans cette nouvelle situation (écouter), est-ce que votre perception globale de la richesse a changé ? Si oui, en quoi et pourquoi ? L2. On what criteria did you make your richness ranking this time? Did these criteria differ from the ones used in the previous condition (playing)? If yes, how? / Quels critères avez-vous utilisés pour faire votre classement de la richesse cette fois-ci ? Ces critères étaient-ils différents de ceux utilisés dans l’autre situation (jouer) ? Si oui, en quoi ? L3. When you evaluate a violin, how important is sound in your overall judgment compared to vibrational characteristics of the instrument? / Quand vous évaluez un violon, quelle importance accordez-vous au son par rapport aux caractéristiques vibratoires dans votre jugement global de l’instrument ? Verbal responses to some of these questions are discussed in Sec. 5.5 but most of the collected verbalizations in this study will be examined post-thesis. 5.1.5 Procedure The first session (playing test) lasted two hours and was organized in three parts. The first part involved two training rankings with three violins, which were distinct from the five violins used in the actual study, to help participants familiarize themselves with each of the constrained-playing tasks respectively. In the second part, participants were asked to rank-rate (see next paragraph) the violins in terms of richness first and then dynamic range according to the respective constrained task. Each task involved three repetitions (trials) and all players carried out the two tasks in the same order. Upon completing the last trial for the richness-constrained task, participants recorded the corresponding musical material on each of the five violins. In the third part, participants were asked to rank-rate the violins in terms of richness, dynamic range and preference according to the unconstrained task. Each of the three criteria was presented once in each of three subsequent blocks of trials. The order of presentation of the criteria within each block of trials was randomized (determined by computer calculations). In total, participants ranked-rated all violins 2 ⇥ 3 + 3 ⇥ 3 = 15 times. The experimenter was constantly present in the room to facilitate the process.
82
Effects of task constraints and type on player reliability
Figure 5.2 Recording setup: two cardioid microphones configured in X-Y stereo coincident position and one free-field microphone.
In each trial, participants were first presented with all violins placed on a table in random order (determined by computer calculations) by the experimenter. Participants were then asked to simultaneously rate each violin on the same unipolar discrete scale using separate, identical on-screen sliders, thus providing a ranking of the five violins at the same time (see Fig. 5.3). In addition to and independently of how they ordered the violins, participants were asked to indicate which of the instruments satisfied their perceived standard for the respective attribute or preference by setting a “limit of acceptability” (i.e., violins rated higher or equal to that threshold were flagged as “acceptable”) on a separate on-screen slider. Participants had to move each slider (i.e., assess each instrument and set the acceptability limit) before being allowed to move to the next trial. In order to end a trial and start the succeeding one, participants clicked an on-screen button labelled “Done” that appeared only after all sliders had been moved. Participants were instructed to always rate their top choice as 1 and their lowest as 0. They were not allowed to assign the same rank-rating to two or more instruments. Participants were instructed to maximize evaluation speed and accuracy. They were encouraged to play their own violin whenever they needed a
5.2 Constrained vs. unconstrained evaluations
83
Figure 5.3 Testing interface used to collect the rankingratings and limit of acceptability (example for the case of richness)
reference point during the experiment. To minimize fatigue, participants were encouraged to take breaks between trials whenever needed. Upon completing the last trial, participants provided written responses to questionnaire P (see Sec. 5.1.4). Participants were asked to return for a second session 1–4 days after having completed the first session. It lasted thirty minutes and involved a listening task with three repetitions (trials). On each trial, participants were first presented with their own audio recordings in random order (determined by computer calculations) over closed, dynamic stereo headphones (Sennheiser HD 280). They were then asked to rank and rate the violins following the same process as in the first session (i.e., the interface and instructions were identical). Upon completing the last trial, participants provided written responses to questionnaire L (see Sec. 5.1.4).
5.2 Constrained vs. unconstrained evaluations Three different analyses were carried out. Firstly, the measures of intra- and inter-individual consistency for each of the evaluation tasks were assessed and compared. Furthermore, a
84
Effects of task constraints and type on player reliability
two-way repeated-measures analysis of variance was employed to investigate the effects of condition (i.e., constrained versus unconstrained) and attribute (richness versus dynamic range) on the measures of intra-individual consistency. The measures of intra- and interindividual consistency recorded during this study were also compared with those recorded during Studies 1 and 2. Secondly, the effects of participant characteristics (self-reported) on the measures of intra-individual consistency computed for each of the tasks were assessed. Thirdly, an overall score for each of the violins was derived and used to conduct cluster analyses for the preference tasks as well as for each of the attribute tasks. 5.2.1 Intra- and inter-player consistency For each evaluation task, intra- and inter-individual consistency was measured and assessed based on the ⇢c between ratings given on different blocks of trials. The same approach described for the analysis of the results of Studies 1 and 2 was followed. Figure 5.4 describes the distribution of intra- and inter-individual ⇢c coefficients. The intra-individual ⇢c distribution is highly asymmetrical for the two richness and the preference tasks and less so for the two dynamic range tasks. The inter-individual ⇢c distribution appears roughly asymmetrical for each task. The across-participants average of the intra- and inter-individual consistency scores measured for each of the tasks are shown in Fig. 5.5 and reported in Table 5.2. Figure 5.6 displays the across-tasks average intra-individual consistency for each of the participants, while Fig. 5.7 shows how the intra-individual consistency measures for each participant are related to the corresponding inter-individual agreement measures for each of the tasks. Figure 5.8 illustrates the variation of intra-individual consistency and inter-individual agreement (left and right graph respectively) within and over the three blocks of repetitions. The following were observed: • For the constrained tasks, the average measure of intra-individual consistency was substantially high for richness, average value = .697, but less so for dynamic range, average value = .472. • Concerning the unconstrained tasks, the average measure of intra-individual consistency was relatively high for richness and preference, average value = .443 and .442 respectively, but considerably lower for dynamic range, average value = .292. Marginally significant differences emerged between the intra-individual consistency
Probability
Probability
5.2 Constrained vs. unconstrained evaluations
R−c
DR−c
R−u
DR−u
85
Intra−individual Inter−individual
0.35 0.3 0.25 0.2 0.15 0.1 0.05
0.35 0.3 0.25 0.2 0.15 0.1 0.05 −1 −0.8−0.6−0.4−0.2
0
0.2 0.4 0.6 0.8
Probability
Consistency (conc. corr.)
1
P−u
0.35 0.3 0.25 0.2 0.15 0.1 0.05 −1 −0.8−0.6−0.4−0.2
0
0.2 0.4 0.6 0.8
1
Consistency (concordance correlation)
Figure 5.4 Distribution of intra- and inter-individual ⇢c coefficients for each of the constrained and unconstrained playing tasks: 1 corresponds to perfect consistency, 0 corresponds to no consistency, -1 corresponds to perfect anticonsistency (i.e., exactly opposite rankings given on different trials). Symbols: R = Richness; DR = Dynamic Range; P = Preference; c = constrained; u = unconstrained.
measured for the preference task on the one hand, and the richness and dynamic range tasks on the other [paired samples t(15) 1.87, p .081]. • Considering all five tasks, most participants had average self-consistency above .4 (13 participants, 81.25%); five participants (31.25%) had average self-consistency of more than .5; three violinists (18.75%) had average self-consistency of less than .3; and only player 4 was highly, almost perfectly, self-consistent. • Going from the second to the third trial, average self-consistency dropped noticeably
Effects of task constraints and type on player reliability
Consistency (concordance correlation)
86
Intra−individual Inter−individual
0.9 0.8 0.7 0.6 0.5 0.4 0.3 0.2 0.1 Richness
Dynamic range
Constrained tasks
Richness
Dynamic range
Preference
Unconstrained tasks
Figure 5.5 Across-participants average intra- and inter-individual consistency scores for each of the constrained and unconstrained playing tasks (error bar = 95% confidence interval of the mean). See Sec. 2.3.6 for details on averaging of concordance correlations. Confidence intervals for inter-individual averages should be treated with caution beause of dependency issues.
( .1) for the dynamic range tasks, while an important increase of about .2 was observed for the preference task. • Inter-individual consistency was generally low for both constrained and unconstrained tasks, .145 average value .189, except for richness-constrained, average value = .305. • In the second trial, there was more agreement between participants for the unconstrained than constrained tasks, particularly for the cases of preference (wherein inter-player agreement made a +.35 jump) and dynamic range (+.15). However, participants were much less consistent between themselves in the third trial for these two tasks. Across trials inter-player agreement overall increased except for the richness-constrained condition ( .1). • Finally, no significant correlation between the self-consistency of a participant and their level of agreement with the other violinists was observed.
5.2 Constrained vs. unconstrained evaluations
87
Intra−individual consistency
0.9 0.8 0.7 0.6 0.5 0.4 0.3 0.2 0.1 0 −0.1 −0.2
1
2
3
4
5
6
7
8
9
10
11
12
13
14
15
16
Individuals
Figure 5.6 Across-tasks average intra-individual consistency for each of the participants (averaged across playing tasks only; error bar = 95% confidence interval of the mean).
5.2.2 Analysis of variance To examine the effect of constrained versus unconstrained task (condition) in the perceptual evaluation of richness and dynamic range (attribute) on self-consistency, a two-way repeated-measures analysis of variance was conducted on the corresponding measures of intra-individual consistency. Following the notable decrease in self-consistency from the constrained to the unconstrained tasks for each of the two attributes as well as from richness to dynamic range in both the constrained and unconstrained tasks (see Table 5.2), the analysis of variance revealed that both condition and attribute had a significant effect on how self-consistent participants were in their judgments [F (1, 15) = 8.64, p = .01 and F (1, 15) = 7.72, p = .014 respectively]. The interaction between attribute and condition fell short of significance [F (1, 15) = .25p = 0.628], hence the two factors do not appear to influence each other here (i.e, in the circumstances related to the particular experiment). 5.2.3 Comparisons with Studies 1 and 2 The overall measures of intra- and inter-individual consistency for richness and dynamic range were compared with those measured in the respective attribute-rating scales used in Study 2, wherein players were instructed to develop their own strategy (see Chap. 4). The
Agreement
Effects of task constraints and type on player reliability
0.5 0.4 0.3 0.2 0.1 0 −0.1 −0.2 −0.3
Agreement
88
0.5 0.4 0.3 0.2 0.1 0 −0.1 −0.2 −0.3
R−c
R−u
DR−c
DR−u
−0.4 −0.2
0
0.2
0.4
0.6
0.8
Agreement
Self−consistency
1 0.5 0.4 0.3 0.2 0.1 0 −0.1 −0.2 −0.3
P−u
−0.4 −0.2
0
0.2
0.4
0.6
0.8
1
Self−consistency
Figure 5.7 Measures of intra-individual consistency (axis labeled ”selfconsistency”) versus inter-individual agreement (axis labeled “agreement”) for each participant in constrained vs. unconstrained playing tasks. Solid lines show least-squares fitting to the data. Symbols: R = Richness; DR = Dynamic Range; P = Preference; c = constrained; u = unconstrained.
reader is reminded that any statistical inferences on measures of inter-individual consistency should be treated with caution due to dependency issues (see Sec. 2.3.6). The following
Inter−individual
0.75 0.7 0.65 0.6 0.55 0.5 0.45 0.4 0.35 0.3 0.25 0.2 0.15 0.1 0.05
89
Intra−individual
Figure 5.8 Variation of intraindividual consistency (left graph) and interindividual agreement (right graph) within and across the three blocks of repetitions. Symbols: R = Richness; DR = Dynamic Range; P = Preference; c = constrained; u = unconstrained.
Consistency (concordance correlation)
5.2 Constrained vs. unconstrained evaluations
Within−block Across−blocks
R−c DR−c R−u DR−u P−u 1
2
Block of trials
3
1
2
3
Block of trials
were observed: • Both intra- and inter-individual consistency for the evaluation of richness under constrained conditions were notably higher than in Study 2, average value = .697 and .305, and .389 and .068 respectively. Indeed, the large increase in both intraand inter-individual consistency was found to be significant [independent samples t(27) = 2.81, p = .009 and t(27) = 4.59, p < .001, respectively, equal variance]. • In the case of the dynamic range-constrained condition, intra- and inter-individual consistency were also higher, albeit to a lesser extent, than in Study 2, average value = .472 and .154, and .333 and .071, respectively. Although the relative increase in intra-individual consistency fell short of significance [independent samples t(27) = 1.32, p = .199, equal variance], the increase in inter-individual agreement was significant [independent samples t(19.78) = 3.36, p = .003, unequal variance]. • Intra-player consistency and inter-player agreement in the richness-unconstrained condition were moderately higher than Study 2, average value = .443 and .189, and .389 and .068, respectively. The increase in self-consistency was indeed not significant [independent samples t(27) = .44, p = .665, equal variance], but the increase in inter-individual agreement was [independent samples t(27) = 2.33, p = .028, equal variance].
90
Effects of task constraints and type on player reliability • In the dynamic range-unconstrained condition, intra-individual consistency was slightly and not significantly lower than in Study 2, average value = .292 and .333, respectively [independent samples t(27) = .38, p = .709, equal variance]; inter-individual agreement was significantly higher than in Study 2, average value = .145 and .071 respectively [independent samples t(21.32) = 3.56, p = .002, unequal variance].
The overall measures of intra- and inter-individual consistency collected during Study 1 (i.e., preference judgments) and those measured during Study 2 for the preference-rating scale were compared with those measured during Study 3 for the preference task. Intra-individual consistency for the evaluation of preference was higher in Study 1 than in Study 3, average value = .62 and .442, respectively, but the decrease was not significant [independent samples t(23.5) = 1.88, p = .072, unequal variance]. In Study 2, intra-individual consistency in preference judgments was lower than in Study 3, average value = .38 and .442, respectively, but the increase fell short of significance [independent samples t(27) = .56, p = .577, equal variance]. Inter-individual consistency in preference judgments gradually increased from Study 1 to Study 2 to Study 3, average value = .015, .089 and .179, respectively. Despite the increase from Study 2 to Study 3 not being significant [independent samples t(23.52) = 1.91, p = .068, unequal variance], the overall increase from Study 1 to Study 3 was found to be significant [independent samples t(20.38) = 3.79, p = .001, unequal variance] Table 5.2 Across-participants average intra-individual consistency and interindividual agreement measures for each of the constrained and unconstrained tasks as well as the listening task. Intra
Inter
Constrained task
Richness Dynamic range
.697 .472
.305 .154
Unconstrained task
Richness Dynamic range Preference
.443 .292 .442
.189 .145 .179
Listening task
Richness
.619
.022
5.2 Constrained vs. unconstrained evaluations
91
5.2.4 Influence of participant characteristics A two-sample t-test was adopted to assess whether intra-individual consistency significantly differed between professional and amateur violin players (N = 11 and 5, respectively). When evaluating richness, despite a tendency for professional violin players to be slightly more self-consistent than amateur players in the constrained task, average intra-individual consistency = .717 and .652 respectively, the difference was not significant [independent samples t(14) = .37, p = .715, equal variance]. Professional musicians appeared considerably less self-consistent than amateur players in the richness-unconstrained task, average intraindividual consistency = .379 and .585 respectively, although the difference fell short of significance [independent samples t(14) = 1.02, p = .326, equal variance]. In the case of dynamic range, professional violinists were more self-consistent than amateurs in both the constrained and unconstrained tasks, average intra-individual consistency = .517 and .375, and .353 and .157 respectively, but none of the differences was found to be significant [independent samples t(14) 1.16, p .267, equal variance]. It should be noted that due to the small sample size in one of the two groups (amateur players, N = 5), it is not surprising to find effects falling short of significance despite their relatively large size. Finally, professional musicians were significantly more self-consistent than amateur violin players in their preference judgments, average intra-individual consistency = .548 and .209 respectively [independent samples t(12.3) = 3, p = .011, unequal variance]. For each of the evaluation tasks, the association between the participant-specific measures of intra-individual consistency on the one hand, and the self-reported price of the owned violin, the years of violin training, and the weekly hours of violin practice on the other was assessed. As in previous cases, this analysis was carried out by computing the Spearman rank correlation ⇢S between intra-individual consistency scores and participant characteristics. Figure 5.9 depicts how self-consistency was associated with each of the participant characteristics for each of the constrained and unconstrained tasks. No association was found to be significant [absolute value of ⇢S .418, p .107, df = 14]. 5.2.5 Violin scores and participant profiles For each of the violins, a task-specific score defined as the across-participants average rating of a violin throughout all trials was computed. The across-participants average violin rating scores for each task are shown in Fig. 5.10 (violins are ordered by increasing preference for
Effects of task constraints and type on player reliability
Self−consistency Self−consistency
0
0.418
−0.121
0.118
−0.5
−0.249
−0.286
0.120
1
−0.019
−0.374
−0.068
0.052
0.123
−0.5 1 0.5 0
0.5
R−u
0 −0.5
0.170
1 0.5
DR−u
Self−consistency
0.5
DR−c
0 −0.5
0.170
1 0.5
P−u
Self−consistency
1
R−c
Self−consistency
92
0
0.305
−0.5 5
20
35
Price of own violin ($K)
70 15
25
35
Years of experience
50
0.361 5
15
25
35
Practice (hours/week)
Figure 5.9 Spearman rank correlation between intra-individual consistency and self-reported participant characteristics for each of the playing tasks: ⇢S coefficients are reported at the upper right corners; solid lines show least-squares fitting to the data. Symbols: R = Richness; DR = Dynamic Range; P = Preference; c = constrained; u = unconstrained.
5.3 Playing vs. listening tasks
93
all tasks) and reported in the upper part of Table 5.1. A different score was also computed for each of the violins by following the same procedure as in Study 1 (i.e., defined as the proportion of times a violin was rated as more preferred/having a richer sound/having a wider dynamic range than any of the other violins; see Sec. 3.2.4). These average ranking scores are reported in the middle part of Table 5.1 for comparison purposes. Finally, a third score was computed for each violin, defined as the proportion of times a violin was chosen as acceptable by the participants in terms of preference/richness/dynamic range (see lower part of Table 5.1). Ordering the violins by any of the scores discussed above revealed the same grouping pattern for all tasks: violins A and D always alternated between the two lower ranks, violin E was always placed in the middle position and violins B and C alternated between the two higher ranks (in the case of dynamic range-constrained, the grouping was only slightly different as violin E alternated with A). In particular, violin A was chosen as the least rich instrument and violin D as having the narrowest dynamic range consistently. Violin B was characterized as both the most rich and having the broadest dynamic range when evaluated in the constrained tasks; for the unconstrained tasks participants appeared to prefer violin C over B. Looking across the scores, the evaluation of dynamic range appeared always less discriminative than that of richness, more so for the constrained than the unconstrained task. This indicates that participants might have had difficulties in evaluating the dynamic range across the given violins with the constrained task. For each participant, task-specific profiles based on the participant’s violin rating scores were obtained. To further inspect inter-individual differences in each of the tasks, these profiles were analyzed with a clustering method (agglomerative hierarchical cluster analysis, average linkage) to detect potential grouping of agreement in the behavioral data for each of the tasks. The resulting dendrograms are depicted in Fig. 5.11). The results of the hierarchical cluster analysis confirmed the presence of a considerable inter-individual variation in the evaluation of each of the attributes (six or seven clusters) as well as, to a relatively smaller extent, in the preference for violins (five clusters) .
5.3 Playing vs. listening tasks As in the previous section, three different analyses were carried out. Initially, the measures of intra- and inter-individual consistency for each of the evaluation tasks were assessed
Effects of task constraints and type on player reliability
Total average rating
94
0.9 0.8 0.7 0.6 0.5 0.4 0.3 0.2 0.1
R−c
0.9 0.8 0.7 0.6 0.5 0.4 0.3 0.2 0.1
D
E
C
B
A
DR−c
D
D
E
B
C
A
E
B
C
E
B
C
DR−u
E
A
C
B
D
Violin Total average rating
Total average rating
A
R−u
0.9 0.8 0.7 0.6 0.5 0.4 0.3 0.2 0.1
P−u
D
A
Violin
Figure 5.10 Across-participants across-trials average rating scores for each violin (error bar = 95% confidence interval of the mean). Symbols: R = Richness; DR = Dynamic Range; P = Preference; c = constrained; u = unconstrained.
5.3 Playing vs. listening tasks
95
Table 5.3 Across-participants average ratings (upper table), ranks (middle table) and acceptability scores (lower table) of the violins. Ranks represent the proportion of times a violin was rated higher than any of the other violins throughout all trials. Acceptability scores indicate the proportion of times a violin was characterized as acceptable. Parentheses report the 95% confidence interval of the mean. Violin
Constrained task Richness
Unconstrained task
Listening test
Dynamic range
Richness
Dynamic range
Preference
Richness
Average rating A
.27(.1)
.56(.1)
.33(.09)
.42(.11)
.43(.1)
.45(.11)
B
.86(.07)
.73(.09)
.7(.09)
.66(.08)
.66(.09)
.72(.09)
C
.75(.07)
.69(.09)
.78(.07)
.76(.08)
.76(.08)
.54(.1)
D
.44(.09)
.28(.1)
.37(.1)
.34(.1)
.27(.1)
.49(.09)
E
.5(.09)
.54(.11)
.59(.12)
.59(.12)
.62(.11)
.47(.12)
Average rank A
.19(.12)
.38(.09)
.23(.08)
.3(.07)
.3(.09)
.35(.13)
B
.65(.08)
.53(.09)
.51(.1)
.48(.08)
.5(.09)
.53(.11)
C
.52(.08)
.5(.09)
.57(.05)
.55(.08)
.56(.09)
.41(.11)
D
.29(.09)
.17(.1)
.25(.11)
.24(.1)
.21(.09)
.37(.1)
E
.35(.11)
.41(.12)
.44(.13)
.43(.12)
.43(.12)
.34(.16)
Acceptability score A
.23(.07)
.56(.06)
.38( > > > >D
G> > > > > >D
G> > > > > >D
G> > > > > >D
G> > > > > >D
(a) Notes played without vibrato
Median spectral centroid
A
B
C
D
E
1300 1200 1100 1000 900 800 700 G> > > > > >D
G> > > > > >D
G> > > > > >D
G> > > > > >D
G> > > > > >D
(b) Notes played with vibrato (the open string is excluded) Figure 5.16 Boxplots of across-participants spectral centroid values for each of the first eight notes of the chromatic scale G2 ! D3 and for each of the five violins (labelled A–E). The violin perceived as most rich (shaded background) has the lowest spectral centroid value in almost all notes. Note that the large variability is likely a result of variations in the applied bow force between violinists (Schoonderwaldt, 2009c).
5.4.2 Tristimulus ratios The three tristimulus ratios were introduced by Pollard and Jansson (1982) to describe timbre in a way analogous to the three primary colors in vision. Accordingly, each of the ratios measures the relative presence (intensity) of (1) the fundamental (first harmonic), (2)
5.5 Summary and discussion
103
the second, third and fourth harmonics, and (3) all partials above and including the fifth harmonic in a given sound:
↵1 T1 = H , P ↵h h=1
↵2 + ↵3 + ↵4 T2 = , H P ↵h h=1
and
T3 =
H P
h=5 H P
↵h . ↵h
h=1
where fh , ↵h and H are defined as previously. Apart from Łukasik (2005), no previous study has investigated potential correlations between all or some of the tristimulus ratios and verbal descriptions of timbre semantically related to perceived spectral density. Figure 5.17 shows boxplots of T 1 and T 3 values across all participants for each of the first eight notes of the chromatic scale G2 ! D3 and for each of the five violins. Again, the large variability observed was likely a result of variations in the amount of bow force applied by different violin players. Violin B, which was rated as the most rich in both playing and listening settings (shaded background) had a more present fundamental and less present upper partials in many of the notes. It also appeared to show more energy in the middle harmonics (i.e., higher T 2 ratio than the other violins, see Fig. 5.18). However, the violin perceived as least rich (violin A) did not always have the weakest fundamental or the strongest upper harmonics. Therefore, no safe conclusion could be reached about the correlation of tristimulus values with the perception of violin sound richness (or fullness or depth).
5.5 Summary and discussion The results of this experiment showed that experienced violin players are self-consistent when evaluating different violins by focusing on a specific attribute of the instrument and following prescribed musical material and technique, both in constrained and unconstrained playing tasks. Only two players reported being “a bit” bothered by the dark sunglasses. Similarly to the previous studies, attempts to associate self-consistency with known (self-recorded) characteristics of the participants were largely inconclusive. A comparison of intra-individual consistency in constrained versus unconstrained playing tasks for the assessment of richness and dynamic range revealed that violinists are significantly
104
Effects of task constraints and type on player reliability
Median tristimulus 1 Median tristiumulus 3
A 0.6
0.6
B
C
D
E
0.5 0.4 0.3 0.2 0.1 G> > > > > >D
G> > > > > >D
G> > > > > >D
G> > > > > >D
G> > > > > >D
G> > > > > >D
G> > > > > >D
G> > > > > >D
G> > > > > >D
G> > > > > >D
0.5 0.4 0.3 0.2 0.1
(a) Notes played without vibrato
Median tristimulus 1 Median tristiumulus 3
A 0.6
0.6
B
C
D
E
0.5 0.4 0.3 0.2 0.1 G> > > > > >D
G> > > > > >D
G> > > > > >D
G> > > > > >D
G> > > > > >D
G> > > > > >D
G> > > > > >D
G> > > > > >D
G> > > > > >D
G> > > > > >D
0.5 0.4 0.3 0.2 0.1
(b) Notes played with vibrato (the open string is excluded) Figure 5.17 Boxplots of across-participants tristimulus 1 versus 3 values for each of the first eight notes of the chromatic scale G2 ! D3 and for each of the five violins (labelled A–E). For many of the notes, the violin perceived as most rich (shaded background) has the highest T 1 and lowest T 3 values.
5.5 Summary and discussion
A
B
105
C
D
E
Median tristimulus 2
0.8 0.7 0.6 0.5 0.4 0.3 G> > > > > >D
G> > > > > >D
G> > > > > >D
G> > > > > >D
G> > > > > >D
(a) Notes played without vibrato A
B
C
D
E
Median tristimulus 2
0.8 0.7 0.6 0.5 0.4 0.3 G> > > > > >D
G> > > > > >D
G> > > > > >D
G> > > > > >D
G> > > > > >D
(b) Notes played with vibrato (the open string is excluded) Figure 5.18 Boxplots of across-participants tristimulus 2 values for each of the first eight notes of the chromatic scale G2 ! D3 and for each of the five violins (labelled A–E). For some of the notes, the violin perceived as most rich (shaded background) has the highest T 2 value.
more self-consistent in well-focused evaluation tasks than in a less restrained setting. Several methodological differences between the two types of tasks could explain this effect. The non-randomized order of the constrained tasks (i.e., first all richness trials followed by all dynamic range trials) gave participants a better opportunity to stabilize their responses than in the unconstrained tasks (i.e., three tasks presented randomized in three blocks of trials). Moreover, the order of the constrained tasks was recurrent across participants,
106
Effects of task constraints and type on player reliability
while the (random) order of the unconstrained tasks was different (i.e., randomized) for each participant. Playing a violin concerto passage that involves a wider range of notes and nuances (unconstrained tasks) entailed a more differentiated evaluation strategy than playing certain notes in a certain way (constrained tasks). Furthermore, as the unconstrained tasks were carried out in the second half of the session, fatigue affected the level of attention in evaluating richness and dynamic range as well as preference. Finally, violinists were less self-consistent in assessing dynamic range than richness in the constrained tasks (see Fig. 5.5). When asked “Did you have difficulty with any of the tasks?”, five participants (31.25%) explicitly expressed difficulties in ranking the violins in the dynamic range-constrained task. Moreover, the related dendrogram in Fig. 5.11 exhibits the largest variability among the tasks. It might therefore be possible that the constrained task was not well designed for evaluating dynamic range. Participants were considerably more self-consistent in the constrained-playing tasks involved in this experiment than in the respective attribute-rating scales involved in Study 2 in which there were no playing constraints. Several methodological differences between the two experimental settings could explain this effect. The rating of richness alongside other attributes (in the previous study) did not allow the same level of attention as focusing only on richness. Similarly, the level of attention is increased when the number of violins is reasonably small. Furthermore, being able to compare the various violins to determine ratings is more meaningful for the musician than rating one violin at a time (as in Study 2). Participants were less self-consistent when evaluating preference in this study than in Study 1. As discussed previously in Chapter 4 (lower self-consistency for violin preference in Study 2 versus Study 1, see Sec. 4.3), this could be explained by the higher number of repetitions in Study 1 (10 ranks for each violin across the 2 sessions) than in the current experimental setup (3 ranks for each violin) as well as the presense of two attribute tasks alongside preference. On the other hand, participants appeared slightly more self-consistent in this study than in Study 2. To a certain extent, this observation may indicate that when evaluating a set of violins, comparing all instruments at a time is more meaningful and thus reliable than assessing each violin individually. Furthermore, no significant differences were observed between the level of intra-individual consistency in the preference ratings and that in the attribute ratings (unconstrained tasks). More importantly, results showed a higher inter-individual agreement in the playing tasks relative to the previous studies. This is further confirmed by the average ratings of the
5.5 Summary and discussion
107
violins (see Fig. 5.10), whereby we observe three distinct groups in all tasks but the dynamic range-constrained one (though the difference in the respective ordering is relatively minor). On the one hand, this observation seems to support the hypothesis that different violin players may take varying approaches to assess different attributes of the instrument and hence designing focused evaluative tasks may trigger more agreement between individuals. On the other hand, it is possible that participants were able to agree more with each other simply because they had to evaluate only five violins, a relatively smaller number than in the previous studies. While specifying the musical material and technique may improve consensus, there remains the issue of addressing differences in how people play. Different violinists may use different combinations of gestures when playing, each producing a fundamentally different behaviour of the instrument for a certain attribute. For example, player A may use less bow force than player B and thus produce a more dark (rich) timbre (see Sec. 5.4). Further exploration is needed in this direction. That still would not address differences in the semantic interpretation of such verbal tags (see e.g., Cheminée, 2009). Whereas violin players appeared highly self-consistent in both the playing and listening tasks, the rank-ratings of the violins in the playing task were generally different from those in the listening task and no significant effect of the type of task on intra-individual consistency was observed (see also Fig. 5.13). Players who were more self-consistent in the playing task were not necessarily self-consistent in the listening task and vice versa. This indicates that the evaluation of richness may be based on different criteria and/or perceptual processes in the two settings for some violin players, but perhaps not for others (since there are a number of participants that performed about the same in the two tasks). Indeed, when asked “In this new condition (listening), did your overall perception of richness change?” (question L1), eleven participants (69%) reported that their overall perception of the richness of the violins did change in varying degrees. A player commented: “I was able to better hear the instrument from an objective point of view. When playing the instrument, the sound is so close to your ear and there are other elements to take in mind (i.e., vibration, feeling of instrument, loudness etc.) that it can become confusing to isolate richness.” However, only three of those players further confirmed that their richness-related criteria for the evaluation of the violins were altered from the playing task (question L2). Furthermore, the average ratings of the violins appeared closer in the listening task than in the playing task (see Fig. 5.14). This indicates that there was less differentiation between the violins in the listening task than in the playing task. A possible interpretation of this
108
Effects of task constraints and type on player reliability
result is that cues that helped players discriminate between the instruments when they are played are absent as a result of the recordings. In fact, four participants (25%) reported that it was harder to differentiate between the violins in the listening setting. Concerning the importance of sound versus vibrational characteristics of the instrument, twelve participants (75%) commented that sound attributes are as essential to the overall quality of a violin as its playability. More specifically, many violinists pointed out that the perception of the produced sound is naturally dependent on the “physical requirements to produce the sound.” As one musician explained: “I think sound under one’s ears is very difficult to judge. Projection can be limited even when it feels like there is ample sound, and likewise, an instrument may have a tone that carries, though it seems meagre under the ears. Ultimately it is variety of tone, and flexibility of tone production, as well as proprioception (feel), which count for as much as the sound one hears under the ears.” The potential correlation of spectral centroid and tristimulus with the perception of richness was explored. Whereas no conclusions can be drawn about any of the tristimulus ratios at this point, increased power at lower frequencies (i.e, a lower value of spectral centroid) appears to indicate a rich sound. Spectral correlates of perceived richness in the sound of a violin need be further investigated, with attention given to experimental conditions that are ecologically and musically relevant to the performer. Following the work conducted in this thesis, a corpus of verbal definitions of richness collected in this study (from question P2, see Sec. 5.1.4) and in an online survey will be analyzed with psycholinguistic tools (see Chap. 6) to tease apart the different semantic interpretations of richness.
109
Chapter 6 Conceptualizing violin quality: Categorization and lexicon This chapter explores how violin quality is conceptualized as reflected in spontaneous, openended verbal descriptions by experienced performers collected while playing in a perceptual evaluation experiment. Starting from the questionnaires used in Studies 1 and 2, whereby participants were asked to justify their perceptual judgments (e.g., preference rankings) through answering comment-form questions, the present analysis aimed at identifying the different concepts and situations of violin quality relevant to the player, how they link to each other, and how they can be mapped to acoustical properties of the instrument. Section 6.1 outlines the verbal data set and coding process. Section 6.2 introduces a scheme for the conceptualization of violin quality, followed by a quantitative discussion in Sec. 6.3. A complementary psycholinguistic analysis of the observed violin quality-relevant vocabulary is presented in Sec. 6.4, while Sec. 6.5 focuses on the perceptual dimensions underlying violin sound quality descriptions, how these dimensions relate to identified concepts of violin sound quality, and how they can be acoustically interpreted. Finally, Sec. 6.6 summarizes and discusses the main findings of the chapter.
6.1 Data review and coding In Study 1, twenty violinists with at least fifteen years of experience freely played and preference-ranked eight violins of different make, age and price in five identical trials (see Sec. 3.1 for details on the musical background of participants and the exact experimental procedure). Upon completing the first trial, participants justified their choices through
110
Conceptualizing violin quality: Categorization and lexicon
answering a set of open-ended questions (A1–A5, see Sec. 3.1.2). At the end of each subsequent trial, they could modify their initial response if they so wished. Upon completing the last trial, participants provided written responses to a second set of comment-form questions (B1–B4, see Sec. 3.1.2). Participants returned for a second, identical session 3–7 days later. In Study 2, thirteen musicians with at least twelve years of experience freely played and rated ten different violins on five perceived qualities (specified) and preference in three identical trials (see Sec. 4.1 for details on the methodology). At the end of the experimental session, participants answered the same set of open-ended questions as questionnaire B used in the first study (B1–B4, see Sec. 4.1.2). To identify perceptuallyrelevant concepts of violin quality, the present analysis focused on the responses to those questions directly related to descriptions of preference (A1–A3, Study 1) and quality (B2, Studies 1 and 2). In the first study, all participants answered questions A1–A3 in up to 4 trials as well as question B2 in each session. All collected responses across the four questions were consolidated in a single data set as all questions were directly related to violin preference and quality descriptions (see Appendix for the complete data). In total, 756 phrasings (38 phrasings per respondent on average, SD = 14) were extracted from the data (see Table 6.2). Of the phrasings, 60% came from professional musicians’ answers and 40% from amateur violin players’ responses. All participants in the second study provided responses to question B2. In total, 65 phrasings (5 phrasings per respondent on average, SD = 1) were extracted from the collected data (see bottom part of Table 6.2). Of the phrasings, 86% came from professional musicians’ answers and 14% from amateur violin players’ responses. Questions were presented in both English and French, and violinists were invited to respond in that language they felt most comfortable with. In total, five participants from Study 1 and three from Study 2 answered in French and it was decided not to translate the phrasings extracted from their responses but include them in the analysis directly. The verbal data was examined with the constant comparison analysis method from grounded theory, which offers an inductive method of shaping a theory that is grounded in data instead of starting with a formalized hypothesis (Glaser and Strauss, 1967, see also Sec. 2.3.7). First, the extracted phrasings from questions A1–A3 were classified in semantic categories emerging from the free-format data. Each phrasing could be coded into one or more categories (i.e., not all categories are mutually exclusive). The core concepts, their properties and underlying themes were identified, and inter-categorical associations
6.2 Analysis
111
were established. Next, the integration of the extracted phrasings from question B2 (Study 1) into the analysis process led to new categories, which helped strengthen the generated conceptualization scheme. The analysis was then extended to the responses collected in Study 2 (question B2), wherein no further concepts emerged. Consequently, the coding was stopped as theoretical saturation had been reached. Existing literature and prior knowledge and experience of the researcher-coder were considered to inform the development of semantic categories (Strauss and Corbin, 1998, see also Sec. 2.3.7). Finally, all occurrences in each category (concepts and/or their properties) were counted.
6.2 Analysis The inductive analysis principle of grounded theory generates groupings starting from low levels to reach, a posteriori, more abstract themes. But these themes will instead be discussed from the more generic to the more specific for the sake of argumentation. A typographic-style scheme is adopted to differentiate these different levels of categorization: highest-level themes are displayed in LARGE CAPITAL LETTERS; high-level concepts in small capital letters; and low-level properties in Italics. At a first level of analysis, three underlying themes of evaluation emerged from the data: the HANDLING of the instrument, the produced SOUND, and the RELEVANCE to the player. A second level of analysis revealed eight concepts of violin quality, each situated within one of the three themes: HANDLING: {design & comfort, response}, SOUND: {timbre, capacity, clarity, sound-generic}, and RELEVANCE: {affective reactions, musical & emotive potential}. A ninth, autonomous concept also emerged: balance across strings. A third level of analysis led to a structure of properties for the concepts of response: {Ease, Speed & Articulation}, timbre: {Richness, Texture, Timbre-abstract}, and capacity: {Resonance, Power & Volume, Projection}. The classification scheme is outlined in Table 6.1. The emerged themes, concepts and properties, and how they link to each other are illustrated in Fig. 6.1. Definitions are described in the following section. 6.2.1 HANDLING the violin HANDLING refers to the ergonomic aspects of the violin-musician system and relates to such concepts as responsiveness, comfort and flexibility of playing.
112
Conceptualizing violin quality: Categorization and lexicon
• design & comfort addresses how comfortable it feels to hold the instrument in relation to its physical dimensions (e.g., size and weight) and design considerations (e.g., curvature). • response describes how the instrument behaves when played, how it responds to the actions of the performer. We identified two properties: ease of response to different bowing gestures, and speed of response, which relates to note articulation. response can be directly associated with the concept of “playability” (Woodhouse, 1993a, also see Sec. 1.2). – Ease denotes how easy and flexible it is for the violinist to interact with the instrument and control the played sound. – Speed & Articulation refers to how quickly and readily the violin responds to the different bowing techniques in terms of transients, dynamics and fast passages. 6.2.2 The SOUND of the violin SOUND comprises descriptions about the quality, quantity and spatiality of the produced sound. • timbre specifies perceptual attributes of the violin sound related to harmonic content, in particular to number of harmonics and distribution of harmonic energy across the spectrum. Timbre is often referred to as “tonal quality” or “sound color.” – Richness describes a certain quality of full-bodied sound (e.g., “full/fullness”) that appears related to harmonic density (i.e., perceived number of harmonics in the sound), particularly in the middle and low frequency regions of violin notes. – Texture pertains to descriptions of violin sound semantically associated with touch (e.g., “soft/softness” ) and taste (e.g., “sweet/sweetness”), appearing related to the perceived across-spectrum balance of harmonic energy present in a played note. Similarly to the first dimension of violin quality identified in Fritz et al. (2008), undesirable qualities such as “strident” or “stringy” appear to be associated with excessive high-frequency content or too little low-frequency content. – Timbre-abstract includes abstract allusions to the concept of timbre, such as “color” or “quality” of the sound.
6.2 Analysis
113
• capacity refers to descriptions of the instrument’s ability for substantial sound delivery: a sound that is present (i.e., it resonates), has power and projects well in the performance space. – Resonance refers to the duration and quality of the sustained part of the sound. It is not related to the physical resonances of the violin body but rather to the perceived presence of a “ringing” sound. – Power & Volume refers to the perceived intensity of the sound “under the ear.” It includes descriptions that appear associated with the semantic field of size-volume (e.g., “big”). – Projection relates to the performance space and concerns the quality and quantity of the played sound at different distances from the musician. • clarity mainly refers to the absence of extraneous noise in the sound, such as wolf tones, whistles or scratches. In this context, “clear” or “clean” is used to describe a sound that is free from audible artifacts. We further identified a second situation, wherein the concept of clarity is used to describe articulation (i.e., successive notes do not blend together). Hence, the concepts of clarity and response are linked via the latter’s Speed property. • sound-generic includes context-free references to the “sound” of the violin (i.e., it was not possible to identify associated concepts). 6.2.3 balance across strings balance across strings describes the similarity or “evenness” in the response of the violin across the four strings (e.g., one or several strings being harder to play or slower to respond to varying gestures) as well as the quality of the produced sound across the different registers (e.g., certain notes having too much or too little harmonic content or audible artifacts). It is therefore situated within both HANDLING and SOUND through response and {timbre, capacity, clarity, sound-generic} respectively.
Conceptualizing violin quality: Categorization and lexicon 114
HANDLING SOUND RELEVANCE
concept Ease
Property
responsive; transients; articulates well; playability
ease of playing; liberty; flexibility; ease of response; playability
Coding scheme (example keywords or phrasings)
Table 6.1 Coding scheme for the conceptualization of violin quality.
response Speed & Articulation
Projection
Resonance
powerful sound; a violin that carries a lot of sound; big; small; mince; weak; strong; thick; thin; petit
ability of the sound to travel; to carry in a hall; to fill the room; focus; dry
resonant; ringing; vibrant; present; open; ample; muffled; eteint; tight; dormant; singing; muted; brillance; brilliant; bright; nasillard; liveliness; sonority
size; shape; weight; curvature; comfort; feel of the instrument: bulk, lightness
Power & Volume
rough; raw; grossiere; soft; smooth; sweet; mellow; velvety; silky; golden; warm; cushioned; round; harsh; tinny; shrill; strident; stringy; acide
design & comfort capacity
Texture
pure; clean; direct; straightforward; wolf tones; buzzing; scratches; whistles; muddy
timbre
clarity
toujours en ecoutant le son du violon; based on the sound
Richness
sound-generic
well balanced from G-string till E-string; the tone was very even over the range of the instrument; consistency across the range of the instrument
rich; deep; hollow; has weight; flat; rich in/with a lot of harmonics/overtones; full, range/palette of colors/timbres; dark; complex; simple; colorless
balance across strings
interesting; beautiful; fascinating; irritating; overbearing; pleasant; pleasing; fun to play; enjoyable
tone quality; sound quality; timbre; color; color of sound; sound color
affective reactions
can respond emotionally and dramatically to my playing; can do anything you want it to; possibility to vary my vibrato and bow pressure for my musical needs
-abstract
musical & emotive potential
6.2 Analysis
115
musical emotive potential
Richness Texture
soundgeneric
affective reactions
Timbreabstract
timbre
RELEVANCE
Resonance
SOUND capacity
Power & Volume
clarity
HANDLING balance across strings
Projection
design & comfort response Speed & Articulation
Ease
Figure 6.1 Concept map of emerging concepts, their Properties and underlying THEMES in player verbal descriptions of violin quality evaluation. The size of the circles corresponds to the different levels of categorization; lines indicate how different concepts link to each other (lengths are arbitrary).
116
Conceptualizing violin quality: Categorization and lexicon
6.2.4 RELEVANCE to the player RELEVANCE refers to quality judgments based on the musical, cultural and emotional involvement of the violinist. • affective reactions includes subjective, emotional and value responses to the sound of the violin as well as the playing experience (Hargreaves and Colman, 1981). • musical & emotive potential denotes the ability of the violin to convey the musical and affective intentions of the player in varying situations.
6.3 Results In the first study, the distribution of concepts was similar for the two experimental sessions, so occurrences were collapsed across sessions in Table 6.2. Note that results are reported in terms of number of occurrences of individual phrasings rather than percentages across the respondents as one original response can include several phrasings coded into the same or different concepts. For the conceptualization of violin quality, 24% of the phrasings refer to the capacity of the instrument for substantial sound production, 21% to the timbre of the played sound, 18% to the response of the violin to the actions of the player, 11% to affective reactions of the violinist to the produced sound and playing experience, 8% to clarity in the played note, 8% to the balance across strings of response and sound quality, 6% to the design of the instrument and thus the comfort of playing, and 5% to the musical & emotive potential of the violin in performance and personal contexts (see Fig. 6.2a). Within the different situations defined by each question (see lower part of Table 6.2), concepts appeared similarly distributed with no sharp variations overall (note that the “white lines” in Fig. 6.2b are basically parallel). In the second study, wherein only the responses to question B2 were analyzed, 20% of the phrasings describe the response of the violin to the actions of the musician, 17% the instrument’s capacity to deliver sound, 17% affective reactions of the violinist to the sound and playing experience. 15% the potential of the violin to convey musical & emotive intentions of the performer, 14% the timbre of the radiated sound, 11% the clarity in the played note, 3% the balance across strings of response and sound characteristics, and 3% the design of a violin and hence the comfort of playing it (see Fig. 6.3a; Fig. 6.3b further displays the normalized occurrences of low-level properties).
6.3 Results
117
Table 6.2 Distribution of concepts within and across questions in Study 1 (S-1; occurrences collapsed across sessions because of similar distributions) and Study 2 (S-2). Descriptions of situations defined by each question, number of extracted phrasings (N ) and a color guide for subsequent charts are provided in the lower part. Normalized occurrences (%) are computed as the number of coded phrasings (#) over that of total extracted phrasings (N ). S-1 A1
A2
S-2
A3
ALL
B2
#
%
#
%
#
%
#
%
#
%
#
%
Ease
33
14
24
13
13
8
12
7
82
11
7
11
Speed
21
9
11
6
11
7
11
6
54
7
6
9
comfort
12
5
11
6
6
4
17
9
46
6
2
3
Resonance
28
12
17
9
26
17
16
9
87
12
5
8
Projection
13
6
10
5
9
6
10
6
42
6
3
5
Power
16
7
6
3
10
6
15
8
47
6
3
5
Texture
6
3
27
14
21
14
21
12
75
10
4
6
Richness
20
9
25
13
9
6
19
10
73
10
4
6
9
4
3
2
2
1
2
1
16
2
1
2
18
8
12
6
20
13
13
7
63
8
7
11
7
3
0
0
0
0
2
1
9
1
-
-
balance
25
11
11
6
8
5
13
7
57
8
2
3
affect
18
8
26
14
20
13
16
9
80
11
11
17
7
3
10
5
6
4
18
10
41
5
10
15
Timbre-abstract clarity sound-generic
potential sound-generc
Situation
S-1 (N )
S-2 (N )
A1
Preference criteria
228
A1
A2
Most-preferred violin
192
A1
A3
Least-preferred violin
155
A1
B2
The “good” violin
181
65
756
65
Total
A1
118
Conceptualizing violin quality: Categorization and lexicon
%
18
12
6
0
Y
E E AL TY RT CT NS TI NC RI FE FO A N O A F L M A TE SP CL BA CO PO RE
E BR
T CI
PA CA
M TI
(a) Across questions % B2 80
64
A3 48
A2
32
16
A1 0
Y
T CI PA
CA
M TI
E BR
E NS
PO
S RE
F AF
T EC
A
CL
RT FO
E NC
Y
T RI
LA
BA
M
CO
L
N
A TI
TE PO
(b) Within questions Figure 6.2 Emerging concepts of violin quality in verbal descriptions by experienced performers collected in Study 1 (questions A1–A3 and B2) and total occurrence (normalized) across participants
6.3 Results
119
%
15
10
5
0
E NS
PO ES
R
PA CA
TY CI
L
T EC
F AF
PO
N TE
A TI
M
TI
E BR
TY RI A L
C
RT
E NC
LA
BA
FO
M
CO
(a) High-level concepts
%
15
10
5
l t r t se ed ce ion e ec tia ure ss ac rity ce fort Ea Spe nan ject Pow Aff ten ext hne bstr Cla alan om T ic a C B so Pro Po R e− Re br m Ti
0
(b) High-level concepts and low-level properties Figure 6.3 Emerging concepts and Properties of violin quality in verbal descriptions by experienced performers collected in Study 2 (question B2 only) and total occurrence (normalized) across participants
120
Conceptualizing violin quality: Categorization and lexicon
The following sections discuss results from Study 1 only. Figure 6.4a compares questions A1, whereby violin preference was described in direct relevance to the experimental setting (i.e., preference rankings of given instruments), and B2, whereby respondents provided context-free descriptions of violin quality. Whereas characteristics related to response prevailed when violinists described the criteria under which they preference-ranked the tested instruments, it was considerably less present in the general descriptions of the “good” violin. Similarly, violinists called upon Texture, potential and, to a lesser extent, comfort more often in question B2 than in A1. Figure 6.4b further compares question B2 with question A2, whereby violin preference was verbalized in relation to the criteria that determined the mostpreferred violin. Again, the concept of response emerged more often from descriptions of preference criteria than from descriptions of general quality and the concept of musical & emotive potential was more present in quality than preference descriptions. However, Texture was almost equally referenced in the two situations. Furthermore, violinists talked about affective reactions more frequently when describing their chosen most-preferred violin than their universal idea of the “good” violin. The proportions of concepts within the different discriminating situations of describing the most- vs. the least-preferred violin (from the answers to questions A2 versus A3 respectively) are contrasted in Fig. 6.5 (sound-generic is excluded as we found no related phrasings in the responses to either question). Descriptions referring to Ease of playing and Richness of sound were considerably more present when violinists explained their most-preferred violin than their least-preferred choice. Similarly, the notions of sound Resonance and clarity emerged much more frequently from descriptions of undesirable than desirable violin features. The results of the lexical analysis presented in the following section further revealed the differences in the linguistic devices used by violinists to describe quality characteristics they prefer from those they do not.
6.4 Lexicon Inside each of the themes identified by the constant comparison analysis on the verbalizations, a complementary psycholinguistic analysis of nouns, adjectives, verbs and adverbs (keywords) was conducted to inspect the violin quality-relevant lexicon (see Sec. 2.3.7). Different lexical devices were grouped together according to morphologic similarity (e.g., rich and richness, easy and easily, pleasant and pleasantness, etc.). Certain French lexical forms were
6.4 Lexicon
121
A1: Preference criteria B2: The "good" violin %
12
6
0
se
Ea
ed
e Sp
om
C
l e n e rt ic ct ct er ia ss ity ce ur io fo er lanc ffe tent ar tra ow ext ne l an ject n s A h n e P C c T g ab Ba so Pro Po Ri d− e− n r Re u b m So Ti
(a) Describing preference criteria vs. the “good” violin
A2: Most−preferred violin B2: The "good" violin %
12
6
0
se
Ea
ed
e Sp
m Co
l e y n rt ct ct er ia ss ce ce ric ur io rit fo ffe tent tra ow ext ne la an ject ne alan s A h n e P C c T g ab B so Pro Po Ri d− e− n r Re u b m So Ti
(b) Describing the most-preferred vs. the “good” violin Figure 6.4 Comparison between preference-based and context-free verbal descriptions of violin quality (normalized occurrence; concepts and Properties are ordered as per Table 6.1)
122
Conceptualizing violin quality: Categorization and lexicon
A2: Most−preferred violin A3: Least−preferred violin %
12
6
0
r s n e e d rt re ct ity se fo we es tu tio nc nc ee ar tra x o c n l a a p Ea m l s e e h n P C S c T oj ab Co eso Ba Ri Pr e− r R b m Ti
ct e ot
l
ia
nt
fe
Af
P
Figure 6.5 Comparing preference ranking criteria that determined the mostand least-preferred violins (normalized occurrence; concepts and Properties are ordered as per Table 6.1)
considered together with their direct English translations (e.g., good and bon, harmonics and harmoniques, equal and egale, etc.). Occurrences of keywords were counted. In particular, the different lexical forms used to describe desirable versus undesirable quality features were comparatively studied.
Table 6.3: Lexicon used by violinists in Study 1 (questions A1–A3 and B2) to describe desirable (+) quality characteristics, aggregated by morphological family and sometimes direct French-to-English translation, and sorted according to previously identified THEMES of violin quality evaluation as well as the concept of balance across strings. Parentheses show total occurrence across participants and questions. SOUND
HANDLING
RELEVANCE
rich/richness (29)
easy/easily/ease (60)
beautiful/beauty (17)
to resonate/-ant/-ance (29)
responsive/-ness/response (23)
good/bon (14)
projection/to project (28)
light/lightness (12)
quality (9) continued on next page
6.4 Lexicon
123
continued from previous page SOUND
HANDLING
RELEVANCE
clear/clarity (24)
feel (10)
nice (7)
powerful/power (23)
weight (9)
interesting/interest (7)
color/couleur (16)
comfortable/comfort (8)
natural/naturally (5)
warm/chaleur (14)
playability (8)
unique/uniqueness (5)
harmonic/harmonique/-s (12)
control/to control (8)
possibilities (5)
overtones (12)
articulation (6)
versatile/versatility (4)
quality (12)
piano/pianissimo (6)
palette (4)
bright/brightness (11)
quick/vite (5)
great (3)
deep/depth (9)
size (4)
enjoyable/to enjoy (3)
mellow/mellowness (8)
dynamics (4)
pleasant/pleasantness (3)
strong/force (7)
flexible/flexibility (4)
pleasing/pleasingness (3)
to speak/parler (7)
effort (3)
expressif/expressions (3)
silky/silkiness (6)
shape (3)
rare/rarity (3)
sweet/sweetness (6)
to manipulate (3)
flexible/flexibility (2)
dark (6)
tuning (3)
basic (2)
open (5)
forte (2)
to inspire (2)
smooth/smoothness (5)
liberty (2)
emotive/emotionally (2)
full/fullness (5)
les consonnes (2)
potential/potentiel (2)
round/rondeur (4)
bulky/bulk (2)
feel/to feel (2)
focus (4)
maniabilité/to manoeuvre (2)
variety (2)
vibrant/vibrancy (4)
reflecting/reflexible (2)
open (2)
singing (3)
réagir
gout
velvety (3)
well-adjusted
preference
to carry (3)
curvature
impression
complex/complexity (3)
built
complet
brilliant/brillant (3)
craftmanship
fun
pure/purity (3)
fit
satisfaction
big/gros (3)
low [action]
to appeal
loud/loudly (2)
architecture
[musical] needs
free (2)
convenient
right
soft (2)
agréable
personality continued on next page
124
Conceptualizing violin quality: Categorization and lexicon
continued from previous page SOUND
HANDLING
RELEVANCE
clean (2)
la solidité
attention
articulation (2)
design
suitable
to travel/voyager (2)
material
fit-for-soloist
volume (2) ringing (2)
balance across strings
straightforward
even/evenly/evenness (19)
weight
balanced/balance (10)
thick
equal/egale/egalité (9)
sonority
consistent/consistence (5)
present
relation (2)
to fill liveliness directness unconstrained unrestrained ample cushioned shades golden substance reponse
stable/stability (2) to harmonize l’equilibre
The various lexical forms (keywords) used by the participants in Study 1 to describe desirable (positive) and undesirable (negative) quality characteristics of a violin are reported with occurrences in Tables 6.3 and 6.4 respectively. Negative verbalizations were largely collected from the responses to question A3 (descriptions of lowest preference-ranked violin), though they were sometimes found in expressions of positive qualities—for example, a participant commented that “the higher notes [of their most-preferred violin] didn’t sound shrill.” Table 6.5 presents the keywords identified in the verbal data corpus from Study 2. These describe mostly desirable qualities due to the positive orientation of question B2. The keywords are sorted in the three identified themes of violin quality evaluation, SOUND, HANDLING and RELEVANCE, as well as the concept of balance across strings (which transcends both the SOUND and HANDLING themes as argued previously). The
6.4 Lexicon
125
Table 6.4 Lexicon used by violinists in Study 1 (questions A1–A3 and B2) to describe undesirable (-) quality characteristics, aggregated by morphological family and sometimes direct French-to-English translation, and sorted according to previously identified THEMES of violin quality evaluation as well as the concept of balance across strings. Parentheses show total occurrence across participants and questions. SOUND muted/mute (10)
sand (2)
RELEVANCE
tinny (10)
colorless (2)
irritating (2)
scratchy/scratches (10)
hoarse/hoarseness (2)
unpleasant (2)
wolf tone (7)
kettle
impersonnel
buzz/buzzing (6)
constrained
controlled
harsh/harshness (6)
dry
mechanic
muddy (5)
dormant
boring
weak (4)
squeezed
generic
flat (4)
strangled
overbearing
rough (4)
grossière
inexpressif
hollow (3)
thin
limited
muffled (3)
stringy
raw/rawness (3)
mince
HANDLING
sore throat (3)
terne
hard (7)
whistles (3)
sourd
muddy (5)
compressed (2)
nasillard
big/gros (4)
petit (2)
metallic
uncomfortable/inconfort (3)
étouffé (2)
simple
heavy/lourd (3)
strident (2)
grating
difficult (2)
éteint (2)
blurry/blurred (2)
ferme (2)
balance across strings
to scratch
tight (2)
uneven/unevenness (4)
rigid
shrill/shrillness (2)
inegal
block-of-wood
blurry/blurred (2)
to change
to break
acide (2)
126
Conceptualizing violin quality: Categorization and lexicon
Table 6.5 Lexicon used by violinists in Study 2 (question B2) to describe desirable (+) and undesirable (-) quality characteristics, aggregated by morphological family and sometimes direct French-to-English translation, and sorted according to previously identified THEMES of violin quality evaluation as well as the concept of balance across strings. Parentheses show total occurrence across participants and questions. SOUND
RELEVANCE
HANDLING
(+)
to respond (4)
easy/ease/easily (7)
clear/clarity/clearly (5)
good/bonne (3)
responsive/response (4)
bright (3)
interesting/interessant (3)
dynamiques (2)
rich (2)
colors/couleurs (3)
feeling
warm (2)
pleasant
maniable
powerful/puissance
nicely
lower [action]
dark
complexite
quick
rondeur
character
reagir
coupant
perfect
small
complex
beau
to cut across
great
balance across strings
resonance
to project on
balanced
projection
to open up
even
couleur
to explore
harmonics
variety
loud
the looks
projeter
chercher davantage
(-)
gamme
shaved
healthy
buzzing
distinctivement
noise
6.4 Lexicon
127
following sections take a closer look at the objects under evaluation for the violinist (Sec. 6.4.1) and the diverse linguistic devices directed to these objects (Sec. 6.4.2). 6.4.1 Objects of reference Almost all descriptions of quality referred either to the sound of a violin or to the violin itself—for example, fullness of sound ; sounded good consistently; each note seemed to have a weight behind it; l’instrument est facile a jouer; the strings [i.e., a component of the instrument] seemed the most even; the instrument itself was light so it felt comfortable in my hand. It can therefore be seen that when playing a violin, there are primarily two distinct objects of reference for the violinist, namely the violin, as the physical sound-producing source with which they directly interact, and the sound of the violin, as the perceived result of their interaction with the source. However, the recurrence of several keywords in both sound and violin evaluations, such as evenness throughout the whole instrument, and evenness throughout all registers; it produced overall an unpleasant sound, and it [i.e., the least-preferred violin] was the most unpleasant to my ears; illustrates how these two objects of evaluation are in fact indistinct, at least in the case of verbalizing sound quality as opposed to vibrational feedback (whereby violin retains its distinct function). In the former, violin is used as a shortcut to sound of the violin: J’ai écouté la force du son du violon tout d’abord. It should be further noted that the function of violin as a cognitive object of evaluation might have been imposed by the particular way questions A2, A3 and B2 were formatted. When asked to explain why they chose violin X as their most or least preferred, or when asked to describe their idea of the “very good” violin, participants naturally employed expressions wherein the instrument (or components of it, e.g., the strings) are objectified.
128
Conceptualizing violin quality: Categorization and lexicon
Finally, the different examples referenced here show that sound functioned grammatically as both a subject and an object, whereas violin was mostly used as a subject. All above observations are in good agreement with the findings of Fritz et al. (2010a). 6.4.2 Linguistic devices Further analysis conducted on the verbalizations showed that the evaluation of violin quality is expressed through the following linguistic forms referring to sound (also tone, timbre, color, note, voix ) and/or violin (also instrument, fiddle, or components of the violin such as strings, bridge, neck ): • adjectives of three kinds, used mostly in phrasal constructions as either attributive (e.g., raw tone, pleasant sound) or predicative (e.g., the tone was very even, it sounds tinny): – simple adjectives linking to sensory experiences: {full, unique, sweet, warm, clear, pure, clean, rich, bright, deep, strong, good, versatile, easy, quick, round, . . . } vs. {flat, simple, raw, harsh, hard, slow, rigid, flat, weak, shrill, terne, dark, ...} – deverbal adjectives (adjectives derived from verbs): ∗ {pleasant, pleasing, interesting, enjoyable} vs. {unpleasant, boring, overbearing, irritating}, which refer mainly to a “hedonic” scale, suggesting that violin sounds—and sounds in general—are also processed as effects of the world on the subject (here the violin player, see Dubois, 2000), and thus confirming that affective reactions (of the violin player) are highly relevant in conceptualizing violin quality—and sound quality in general. ∗ {resonant, vibrant, singing, ringing, projecting, unconstrained, unrestrained} vs. {compressed, strangled, squeezed, constrained, muffled, muted, éteint, fermé, étouffé}, which stem from action verbs and describe a “presence” dimension (see next section), with mostly past participles ending in -ed used on the negative side as opposed to more present participles ending in -ing employed for positive attributes—even in the case of unconstrained and unrestrained, the prefix un- simply reverses the negative role of the past participle
6.5 Semantic fields
129
∗ grating, buzzing, controlled, scratchy, blurry, . . . – denominal adjectives (adjectives derived from nouns): velvety, silky, stringy, powerful, comfortable, beautiful, tinny, cushioned, muddy, metallic, . . . • nouns (N) of two kinds, used mainly in the forms N + of + (the) sound (e.g., I like a violin that puts out a good volume of sound, I can get a variety of sounds with ease) and, less frequently, sound + N (e.g., with good sound production) and N + in + (the) sound (e.g., with enough complexity in the sound, il y as une bonne reponse dans le son): – simple nouns borrowed from technical-scientific terminology: color, spectrum, palette, volume, power, weight, curvature, register, . . . – nominal suffixes derived from and functioning as substitute devices to verbs and/or adjectives: resonance, richness, fullness, projection, production, depth, puissance, complexity, clarity, purity, lightness, flexibility, pleasantness, impression, . . . • relative clauses and verb phrases: carried a lot of sound, can fill a hall, une voix qui empêche de voyager, responds well, un instrument qui parle et articule bien, it has to feel right, seemed to project well, doesn’t appeal to me, demanding a lot of effort, felt like a block of wood, . . . Overall, when player verbalizations of violin preference and quality refer to sound, either directly or indirectly through violin as has been seen, the most frequently called upon lexical forms are descriptive and evaluative adjectives in simple, denominal, or deverbal constructions. Even when using non-technical nouns, violinists essentially alternate between the same adjectives and their nominal derivatives. A closer inspection of all sound-descriptive adjectives revealed four underlying perceptual dimensions.
6.5 Semantic fields In the broader tradition of timbre research, attempts to uncover the number of salient perceptual dimensions through multidimensional scaling (e.g., Grey, 1977), factor analysis (e.g., Zacharakis, 2013) and other techniques (e.g., von Bismarck, 1974) have resulted
130
Conceptualizing violin quality: Categorization and lexicon
in three- or four-dimensional schemes. The proposed dimensions are usually directly linked to and labelled as the semantic fields of texture, density, volume, temperature, and light or combinations of those, which are generally associated with material object properties (Zacharakis, 2013). Despite the numerous studies aiming to identify the perceptual dimensions of timbre in general, very few have explored the musician-specific vocabulary ˘ epánek used to describe the sound qualities of one particular instrument (i.e., the violin in St˘ et al., 1999; Fritz et al., 2010a, 2012a, as reviewed in Sec. 2.2). In their adjective descriptions of violin quality, the violinists who participated in Studies 1 and 2 borrowed lexicon mainly from four semantic fields related to: • texture-temperature: {sweet, warm, smooth, velvety, silky, pure, soft, cushioned, round, even} vs. {rough, raw, scratchy, muddy, stringy, grating} This semantic field seems to be in direct agreement with the “spectral balance” dimension of violin sound quality identified by Fritz et al. (2012a) but for the word rich, which the present analysis considers as semantically related to size-volume. Note that even was used by some participants to denote “smoothness” rather than “balance across strings.” Acoustically, texture-temperature seems associated with the relative amount of higher frequencies in the sound and thus to the distribution of harmonic energy across the spectrum. Conceptually, the found contexts wherein adjectives from the semantic field of texture-temperature were used appear related to the notions of Texture (timbre) and, to a lesser extent, clarity. • action-presence: {resonant, vibrant, singing, ringing, projecting, unconstrained, unrestrained, present, free, open, powerful, strong} vs. {compressed, strangled, squeezed, constrained, muffled, muted, tight, weak, dormant, éteint, fermé, étouffé} The mostly participial adjectives framed in the semantic field of action-presence suggest a similar dimension to the “amount of sound” as proposed by Fritz et al. (2012a). As such, they seem acoustically akin to the amount of harmonic energy in the spectrum, especially in middle and upper frequencies. The use of such words as resonant or vibrant may suggest an association with the vibrational response of the violin body as felt by the performer through tactile and proprioceptive cues. Conceptually, the action-presence descriptions were used in situations identified as Resonance, Projection and Power and involved in the broader concept of capacity.
6.5 Semantic fields
131
• size-volume: {rich, big, gros, full, deep, ample, thick } vs. {flat, small, petit, mince, thin} In this semantic field, the emerging concepts are those of Richness, referring to the number of harmonics present in the sound, with an emphasis on the relative amount of low-to-mid frequencies in the spectrum, and Power (see above, also Table 6.1 for the classification). • light: {bright, brilliant, clear } vs. {dark, terne, blurry} Here the concepts of Resonance (capacity), clarity (also response via Articulation) and Richness (timbre) are observed (see Table 6.1 for the classification). The light dimension is therefore less straightforward to interpret acoustically. It should be noted that the word bright was sometimes used in a negative context: . . . the high notes did not seem to be too bright. Its semantic antonym dark was in fact used positively: I have a preference for a darker colour of sound. These semantic fields indicate what type of dimensions may explain the perception of violin timbre from the player perspective. Similar dimensions are commonly observed in verbal descriptions of instrumental timbre, often under different labels or in various combinations, independently of the instrument (see e.g., Traube, 2004; Bernays and Traube, 2011, for guitar and piano timbre verbalizations). However, the same word may have different perceptual weighting across different instruments—for example, whereas brightness is central to brass instrument quality, it is of less importance for violin timbre evaluations and sometimes has negative meaning. Similarly, there may be differences in how the same word is interpreted semantically between different instruments. Cheminée (2009) found three distinct meanings for clear (clair in French) in musicians’ piano quality verbal descriptions: defined (défini), dry (sec) and bright (lumineux). In the present corpora, clear had two separate meanings: clean (i.e., free from audible artifacts) and well-defined (i.e., successive notes do not blend together). Figure 6.6 provides a theoretical illustration of how the proposed acoustical interpretations for the semantic fields of texture-temperature, size-volume and action-presence may
Conceptualizing violin quality: Categorization and lexicon 132
SOUND
timbre
capacity
Size-volume
Size-volume
Texturetemperature
Amount of harmonic energy
Number of harmonics
Distribution of harmonic energy
Actionpresence
Sound spectrum
Vibration sensation
Body vibrations
Figure 6.6 A theoretical illustration of establishing links between the dynamic behavior of a violin (gray color) and its perceived sound qualities (black color) based on the proposed acoustical interpretations for the semantic fields of texture-temperature, size-volume and action-presence (see text). Dotted lines indicate the need for empirical investigations.
6.6 Summary and discussion
133
help establish links between the dynamic behavior of a violin (gray color) and its perceived sound qualities (black color). For the path from body vibrations to spectral features to identified semantic dimensions of verbal descriptions, dotted lines were used to denote the need for empirical investigations (as opposed to the path from the perception of SOUND to the concepts of timbre and capacity to the identified semantic fields, which was examined in this chapter). For example, in what ways can information about spectral features of the sound of a violin as well as the vibration sensation felt by the violinist, be extracted from a measurement of the instrument’s input admittance? A final consideration is necessary about the interpretation of the semantic dimensions underlying sound-descriptive adjectives used by experienced violin players. The present psycholinguistic analysis adopted a situated approach: the verbal descriptions of violin sound were spotlighted in open-ended responses of performers collected in a playing test. Rather than simply listening to and verbally tagging recorded sounds, violinists described sound quality inside a more involved experience.
6.6 Summary and discussion When evaluating a violin or its sound, musicians call upon a wide diversity of linguistic forms (e.g., nouns, adjectives, verbs, metaphors) to describe perceived qualities (e.g., richness of the sound, responsive instrument, a violin that speaks well, kettle effects in the sound, etc.). Most previous research has focused on adjective descriptions of violin sound qualities and suggested acoustical interpretations based on spectral features (Bissinger and Gearhart, ˘ epánek and Ot˘cená˘sek, 1999; Łukasik, 2005, see Sec. 2.2.3 for a more detailed review). 1998; St˘ These interpretations were based only on a priori knowledge of the researchers as opposed to emerging concepts grounded in the verbal data. In the case of Fritz et al. (2012a), semantic dimensions of violin sound quality were obtained by asking players to organise words by similarity as opposed to a proper linguistic analysis based on free verbalizations. Moreover, only adjective descriptions were considered. A psycholinguistic analysis of free-format verbalizations has also been published but the verbal data was collected from only three violinists (Fritz et al., 2010a). Notably, no previous study has investigated how violinists talk about and conceptualize violin quality. From spontaneous verbal responses of experienced performers collected in violin-playing experiments for the perceptual evaluation of violins (Studies 1 and 2), a concept map emerged
134
Conceptualizing violin quality: Categorization and lexicon
(see Fig. 6.1) that illustrates the complex links between the different player-typical concepts (e.g., response, clarity, balance), properties (e.g., Ease, Richness, Projection), and underlying themes (HANDLING, SOUND and their RELEVANCE to the individual). A psycholinguistic analysis of the lexicon used by musicians in their verbal descriptions further revealed a diversity of linguistic devices (mainly deverbal and denominal adjectives, nominal suffices and relative clauses) referring to either the sound of a violin or to the violin itself as the cognitive objects, the latter mainly used as a shortcut to sound of the violin. This confirms previous findings by Fritz et al. (2010a). Some preference for certain linguistic constructions for a certain type of conceptual category or for differentiating between desirable and undesirable characteristics was also observed. Most of the lexical forms used were descriptive, such as rich, pure, singing, easy, bulky, even, beautiful, interesting, and so on. From those, a comparatively larger number appears to be linked to sensory experiences (e.g., rich, soft, scratchy, hard, etc.; associated with the SOUND and, to a lesser extent, HANDLING themes). This is perhaps not surprising as most musicians are not familiar with describing sound in an objective, quantitative way and share little knowledge about the perceptual and acoustical dimensions of sound (Traube, 2004). More specifically, adjectives describing sound qualities appear largely borrowed from four semantic fields related to texture-temperature (smooth vs. rough), action-presence (resonant vs. muted ), size-volume (deep vs. flat) and light (dark vs. bright). Other descriptive words relate to the player’s feelings, emotions and value judgments (e.g., pleasant, unique, overbearing, inexpressif, etc.; associated with the RELEVANCE theme). Respondents also used technical terms, such as articulation, piano, forte, harmonics, overtones, tuning, shape, size, weight, etc. (associated mostly with the HANDLING theme). To describe the timbre of a violin, violinists appear to focus on the number of harmonics in the sound (conceptualized as Richness and related to the semantic field of size-volume) and the distribution of harmonic energy across the spectrum (conceptualized as Rexture and related to the semantic field of texture-temperature). To describe the capacity of a particular violin to produce sound, musicians refer to the amount of harmonic energy (conceptualized as Power and related to the semantic field of size-volume), as well as to the vibrational sensation they experience when playing the instrument (conceptualized as Resonance and related to the semantic field of action-presence). However, a “good” sound is dependent on the amount of effort required to obtain it (conceptualized as Ease and Speed of response), with different musical or subjective situations leading to different degrees
6.6 Summary and discussion
135
of compromise between sound quality and playability. This is illustrated in the following answer given by one of the participants: A good violin for me is one that combines an even, resonant, singing tone with good sound production. I often play fiddle and rock music, and although a good sound is always important, I also need to be able to play loudly. Finally, a “good” violin sound also has an aesthetic-evaluative dimension grounded in musical and emotional situations relevant to the violinist. Figure 6.6 provides a theoretical illustration of linking the body vibrations of a violin to its perceived sound qualities through the semantic fields of texture-temperature, size-volume and action-presence. Rich/richness was the most frequently quoted description of sound in the data (see Table 6.3), indicating a strong, widely-shared concept of violin quality. This observation is in agreement with results from a previous, more rudimentary analysis of the verbal responses to question A1 (see Sec. 3.2.6) as well as with the results from Study 2, wherein richness was found to be highly correlated with the preference for violins. In fact, an analogy may be drawn between the importance of richness in violin sound quality and that of brightness in brass instrument sound quality. A final remark concerning the “definitions” of the five violin attributes provided to the participants in Study 2 should be made (see Sec. 4.1.3). From the analyses in this chapter, it is understood that the characteristic of richness is associated with the perceived amount of mid-to-low harmonics in a violin sound. As such, the respective rating scale was appropriately explained. “Easy-to-play” and “dynamic range” were also properly explained. Whereas the concept of balance across strings refers to both the playing behavior and produced sound, only the former was considered to explain the respective scale in Study 2. Finally, the use of both a “response” and an “easy-to-play” scales might not have been as relevant because the latter now appears conceptualized as a property of the former.
136
137
Chapter 7 Conclusions This dissertation addressed the perceptual evaluation of violin quality by experienced performers, focusing on the reliability of their psychoacoustical judgments and the verbalization of their perceptions. Section 7.1 summarizes the main findings from the three experimental violin-playing studies presented in the previous chapters. Future directions in violin acoustics research are contemplated in Sec. 7.2, with emphasis given to playing-based evaluation of quality characteristics, and to verbal descriptions for musical sound.
7.1 Summary and contributions Attempts to quantify the characteristics of “good” and “bad” violins from listening tests and/or acoustical and structural dynamics measurements have largely been inconclusive (Bissinger, 2008). On the one hand, this may be due in part to overly broad characterizations of good and bad and the lack of a standardized quality evaluation procedure. On the other hand, the quality of a violin depends on a number of factors, many of which relate directly to the sound radiated by the instrument, as well as others that relate to the interaction between the player and the instrument. For example, an important aspect of a violin’s behaviour concerns its playability or response to various playing gestures. Some of this information may be communicated to the player via tactile and proprioceptive channels (e.g., hands, arms, chin; see Fig. 1.1 and Sec. 1.2). Listening tests are therefore not entirely indicative of the perceptual processes that take place when a player assesses the quality of a violin; playing-based evaluations afford a higher level of ecological validity. Furthermore, standard physical measurements such as bridge mobility may not be able to capture all
138
Conclusions
subtle variations in a violin sound perceived by the player (e.g., Woodhouse and Langley, 2012). The perspective of the violinist is therefore essential in developing an understanding of how one instrument differs from another. Correlating measurable vibrational properties of the violin with perceptual judgments by players first require a closer look into the subjective evaluation process itself. In the introduction to this work, three issues related to the perceptual evaluation of violin quality by performers were identified: the design of reliable empirical tests, the consistency (or lack thereof) in assessments by experienced players, and the conceptualization of violin quality in their verbal expressions. To address these questions, this dissertation followed an interdisciplinary approach that combined the fields of musical acoustics, perception, and psycholinguistics. One novelty of the proposed research is that a standardized, carefully controlled, playingbased procedure for the perceptual evaluation of violins was designed to obtain reliable and meaningful information within the context of finding links between preference judgments by players and mechanical-acoustical parameters of the instrument. In three violin-playing studies, experienced musicians assessed violins of different make and age, and described their choices in free verbalization tasks. The focus was gradually narrowed from examining overall preference to the evaluation of certain perceptual attributes of the instrument. Particular emphasis was given to the design of experimental conditions that are empirically valid but also musically meaningful to the violinist. Low light conditions and dark sunglasses were used to help hide the identity of the instruments as much as possible and thus circumvent the potential impact of visual information on judgment while ensuring a certain level of comfort for the musicians, as well as safety for the instruments. To avoid the potential problems of using a common bow across all participants (e.g., musicians being uncomfortable with a bow they are not familiar with, what defines a “good” bow?), violinists were asked to carry out the evaluation tasks using their own bow. The experimental sessions took place in diffuse rooms to help minimize the effects of room reflections on the direct sound from the violins. 7.1.1 Player reliability Study 1 examined intra-player consistency and inter-player agreement in violin preference judgments. In a first session, skilled violinists freely played a set of different violins and
7.1 Summary and contributions
139
ordered them by preference. They repeated the ranking task five times and returned for a second, identical session three to seven days after having completed the first session. It was shown that violinists are self-consistent in assessing violin quality but a significant lack of agreement between musicians is observed. Study 2 subsequently investigated the origin of inter-individual differences in the preference for violins and measured the extent to which different attributes of the instrument influence preference. Experienced violin players freely played a set of different instruments and rated them according to ease of playing, response, richness, balance (across all strings), dynamic range and preference (one violin on all scales at a time, in three blocks of repetitions). Results showed that the perception of the same violin attributes widely varied between individual players and corroborated the large inter-individual differences in the preference for the violins observed in Study 1. Importantly, despite the variability in the evaluation of both preference and violin attributes, an association between preference ratings and ratings on two violin attributes was present: violinists appeared to strongly agree on their preference for violins with a rich sound and, to a lesser extent, a broad dynamic range. Study 3 examined player reliability in violin ratings-rankings from constrained (violinists rated-ranked different instruments by playing only certain notes in certain registers) versus unconstrained (the violins were rated-ranked by playing a certain excerpt from the repertoire) evaluation tasks for the cases of richness and dynamic range (as they had been found to be highly correlated with violin preference in Study 2), as well as preference (unconstrained task only). Results suggested that specifying the musical material and technique removes a significant amount of inter-individual variability: the more focused the task, the more self-consistent violinists are and the more they agree with each other. The perception of richness from playing versus listening (using recorded sounds from the constrained-playing task) tasks was also examined. Results indicated that the evaluation of richness may be based on different criteria and/or perceptual processes between playing and listening conditions for some violin players, but perhaps not for others. In summary, the results of the present work demonstrate very low agreement between players in assessing violin quality, with no relationship to price or age of the instrument. Thus, these findings are important in helping players “come to terms” with a violin purchase and should diminish to some extent the societal expectations that only the old and expensive violins are of great quality. The strong correlation of violin preference with sound richness and, to a smaller degree, dynamic range signifies that what makes a violin good might, to a
140
Conclusions
certain extent, lie in the ears and hands of the performer not because different performers prefer violins with largely different qualities, but because the perceptual evaluation of violin attributes widely considered to be important for a good violin vary across individuals. This important conclusion may explain the limited success of previous studies at quantifying the differences between good and bad violins from vibrational measurements. The main results of Studies 1 and 2 have been published in a leading scientific journal on acoustics (Saitis et al., 2012). This research may constitute one of the first contributions toward better knowledge of how violinists perceptually evaluate the quality of a violin. This is a critical aspect of violin acoustics that has only recently been considered essential in developing an understanding of what distinguishes one instrument from another (e.g., Fritz et al., 2007; Bissinger, 2008). Notably, no previously published work has systematically investigated the extent to which violinists are consistent at assessing violins and whether there is agreement between violinists to begin with. 7.1.2 Player verbalization Another novelty of the research presented here is that the constant comparison analysis from grounded theory was used to identify and categorize emerging concepts of violin quality in verbal descriptions by experienced performers. A concept map grounded in free-format responses collected during Studies 1 and 2 was developed, which can be useful for future studies aimed at assessing violin qualities (see Fig. 6.1). Expanding on the work of Fritz et al. (2010a), a psycholinguistic analysis of the qualitydescriptive lexicon used by violinists further revealed a variety of linguistic devices (mainly deverbal and denominal adjectives, nominal suffices and relative clauses) referring to either the sound of a violin or to the violin itself as the cognitive objects. Adjectives are largely borrowed from four semantic fields related to texture-temperature (smooth vs. rough), action-presence (resonant vs. muted ), size-volume (deep vs. flat) and light (dark vs. bright). These semantic fields indicate what type of dimensions may explain the perception of violin timbre, contributing to the area of violin acoustics research (see Fig. 6.6) as well as to the broader area of timbre research. In summary, the results of the content and psycholinguistic analyses provide novel insights into the perception of violin qualities by performers. To describe the timbre of a violin, violinists appear to focus on the number of harmonics in the sound (conceptualized as
7.2 Future directions
141
richness and related to the semantic field of size-volume) and the distribution of harmonic energy across the spectrum (conceptualized as texture and related to the semantic field of texture-temperature). To describe the capacity of a particular violin to produce sound, musicians refer to the amount of harmonic energy (conceptualized as power and related to the semantic field of size-volume), as well as to the vibrational sensation they experience when playing the instrument (conceptualized as resonance and related to the semantic field of action-presence). However, a “good” sound is dependent on the amount of effort required to obtain it (conceptualized as ease and speed of response), with different musical or subjective situations leading to different degrees of compromise between sound quality and playability. Finally, a “good” violin sound also has an aesthetic-evaluative dimension grounded in musical and emotional situations relevant to the violinist. Two final considerations are necessary about the interpretation of these results and thus their importance. First, the proposed analysis of verbal data adopted a situated approach: the verbal descriptions of violin quality were extracted from open-ended responses of performers collected in a playing test. Rather than simply listening to and verbally tagging recorded sounds, violinists described quality inside a more involved experience. Second, the acoustical correlates proposed for some of the identified concepts and semantic fields (e.g., number of harmonics related to perceived richness) are interpretations based on prior knowledge and experience of the author. They should be treated with caution by the reader as no rigorous investigations were carried out.
7.2 Future directions Starting from the question of how to assess projection of a violin, the perception of which is arguably difficult to judge reliably simply by playing, an important way of extending the current work would be to collect paired judgments from two violin players in perceptual tasks that combine active playing with passive listening contexts (i.e., when one participant plays, the other listens). How different would the perceptions of the radiated sound, not only in projection but in general, between the two musicians be? In further studies it would be interesting to inspect which perceptual features of violin sound quality specifically relate to the attack, “steady” part, and decay or reverberation of played notes. In particular, transients in bowed string attacks are critical to violin playing because they determine how fast and easy Helmholtz motion is created (Guettler,
142
Conclusions
2002). From the current analyses, it seems that the concepts of response and clarity are the ones most closely associated with the attack of a violin note, the concept of timbre refers to the sustained sound, and the concept of capacity relates to both the steady part and reverberation. Another challenge lies in teasing apart the effects of the playing skills of different instrumentalists by focusing on motor control in bowing. Different violinists may use different configurations of bowing parameters (bow force, bow velocity and bow-bridge distance) when playing, each producing a fundamentally different behavior of the instrument for a certain perceptual characteristic. For example, player A may use less bow force than player B and thus produce a more “rich” timbre. These configurations are less relevant to perceptual and cognitive processes but more connected to biomechanical constraints in bowing (Schoonderwaldt, 2009b). The perceptual characteristic of richness emerged as a key factor in how violinists conceptualize instrument quality, supporting the observations in Study 2 wherein richness was found to be highly correlated with preference. In fact, an analogy may be drawn between the importance of richness in violin sound quality and that of brightness in brass instrument sound quality. The potential correlation of spectral centroid and tristimulus with the perception of richness was explored. Whereas no conclusions can be drawn about any of the tristimulus ratios at this point, increased power at lower frequencies (i.e, a lower value of spectral centroid) appears to indicate a rich sound. Spectral correlates of perceived richness in the sound of a violin need be further investigated, with attention given to experimental conditions that are ecologically and musically relevant to the performer. Following the work conducted in this thesis, a corpus of verbal definitions of richness collected in Study 3 and in an online survey will be analyzed with psycholinguistic methods to explore how violinists semantically use “richness” when evaluating violin sound quality. The use of quality-descriptive words from semantic fields associated with material object properties such as size, texture and light has given rise to some interesting questions concerning the perceptual and cognitive origins of such frameworks for the verbal description of violin sound—and musical sound in general (see, e.g., Eitan and Timmers, 2010; Eitan and Rothschild, 2011, for their work on tactile metaphors for musical sound). It would be interesting to conduct a cross-modal investigation of musical sound tagging, that is the ways in which the visual (e.g., big object) and tactile (e.g., velvety surface) modalities influence hearing (e.g., big noise, velvety sound).
7.2 Future directions
143
With these perspectives the dissertation concludes. It is hoped that a better understanding of the challenges in the perceptual evaluation of violins has been given, even though not all aspects have been possible to take into account. The long-term goal is to better understand what distinguishes one violin from another, what criteria are considered most important to the quality of an instrument, and how these are related to its dynamic behavior. Such knowledge can be used to refine the design of violins, inform luthiers on ways to fix problems with existing instruments, and potentially help improve sound synthesis models.
144
145
Appendix: Original verbal responses and coding scheme
[Color guide and key]
Projection
affective reactions
Ease
Power & Volume
musical & emotive potential
Speed & Articulation
Texture
balance across strings
design & comfort
Richness
S
Subject
Resonance
Timbre-abstract
T
Trial
sound-generic
clarity
V
Violin
Study 1 A1: How and based on which criteria did you make your ranking?
S1/T1
Session 1
Session 2
sound; string differentials; how they
how the sound comes out of each string
responded in the highest position
and the relation between the strings, the colour
S2/T1
responsiveness, silkiness of sound, power
ease of playing: the feel of the instrument and the responsiveness of the strings; the color of the sound, not their power continued on next page
146
Appendix: Original verbal responses and coding scheme
continued from previous page
S2/T2
Session 1
Session 2
the feel of the instrument; the smoothness
The instrument’s weight and shape are
vs rawness of tone
also factors. For instance, the one I think I keep ranking seventh seems to me too light-weight. The 4th to 6th and the 8th feel too big, bulky somehow.
S2/T3
feel of the instrument: bulk, lightness; power, ease
S2/T5
my general satisfaction of a common melodic line
S3/T1
S4/T1
Colour of the sound, projection of that
Beauty of tone, An open, free,
sound, vibrancy of the sound, playability
unconstrained, projection of that tone.
(ease and response)
Evenness across the strings.
My ranking is based on responsiveness
I choose for resonance and interesting
(resonance) and interest and/or
sound
pleasantness and/or fascination of sound. S5/T1
amplitude harmonique (riche en
facilite de jeu, confort, egalite dans som
harmoniques), facilite d’emission, pouvoir
ensemble et surtout une voix qui “parle";
expressif et son riche
de plus je recherche un son qui puisse “porter" meme dans le pianissimo
S6/T1 1. Tone quality; 2. Evenness throughout
1. Overall quality of sound; 2. Ease of
the whole instrument; 3. Perceived power
playability; 3. Resonance; 4. Evenness
of projection (as best I can judge under
throughout the instrument
my ear); 3. Ease of playing S6/T2
My judgements were based on the overall quality of the instruments. Tone quality, evenness throughout all registers, perceived projection, ease of playing. continued on next page
Appendix: Original verbal responses and coding scheme
147
continued from previous page
S7/T1
Session 1
Session 2
the color of the sound; the balance of all 4
Beauty of the sound—the color, the
strings; easy to get the sound in piano, in
possibility to create different nuances; easy
forte, using vibrato or without; problems
to respond to the articulation issues;
of the sonority—wolfs, sand, metallic of
volume of the sound—ability to fill the
kettle effects.
room; Own problems of the instrument—wolfs, missing of the tuning
S7/T2
For the second trial I was looking at the A and D strings abilities in the piano. It’s one of the most difficult parts of tuning the violin and for the violinist to be satisfied of this criteria.
S7/T3
My third try is to put the instruments in evaluating them by the sonority of the E-string
S8/T1
Essentially I was looking for richness of
Once again, I was looking for a rich,
tone, power, "flexibility" (ie the ease with
velvety tone that also had power and
which I could produce a variety of different
clarity. Furthermore, I wanted to hear a
sounds and timbres) and a kind of
resonance in the instrument that lasted
resonance that seems to last well beyond
longer than the note I played, and I
each note. Beyond that, balance across all
wanted to hear this quality within every
the strings is also important (ie the timbre
register. Thus a violin with a powerful
and power remain even across all the
e-string that had a flat sounding G-string
strings)
might have been ranked lower than a violin that had less power on the E, but was more well balanced soundwise. Lastly, perhaps because I have an affinity for the viola, violins with a darker sound tend to get ranked higher than brighter sounding ones. continued on next page
148
Appendix: Original verbal responses and coding scheme
continued from previous page Session 1 S8/T5
Session 2
I found myself changing my prioritization of my criteria throughout the course of these evaluations. Sometimes opting for a clear and present tone, other times for a more complex and perhaps less powerful one.
S9/T1 The most important characteristic for me
As before, a strong, rich tone that was
was ease of response in the instrument,
easily producible was what I was looking
especially jumping larger intervals on a
for. All the violins produced a fairly even
single string, and especially jumping to
tone, but some were far more resonant
and from an open string. After that,
than others. There were one or two that
clarity of tone at registeral extremes was
stood out as being very easy to produce a
important, and evenness of tone from one
strong, resonant tone on. I also searched
string to the next. After that, I looked for
for notes that didn’t speak as well in the
a clean tone in the higher positions on
upper positions on the G string, and I
each string, especially on the G string,
similarly paid attention to how resonant
looking out for any notes that didn’t speak
the higher notes on the E string were.
as well as others.
Some instruments were quite resonant on the upper notes of the E string, but they were too resonant and sounded rather strident, which I found less desirable.
S9/T3
I played the instruments somewhat more aggressively on this third ordering, trying to see how loud they could be played and to really focus on how well they resonated. Again, ease of response and evenness of tone were extremely important. continued on next page
Appendix: Original verbal responses and coding scheme
149
continued from previous page Session 1 S10/T1 la sonorite: beaute et richesse sonore et
Session 2 j’ai cherche a avoir une bonne puissance et
harmonique autant dans le grave que les
un instrument qui parle et articule bien.
aigue; la maniabilite: est-ce que
[also clarity] Les consonnes d’un
l’instrument est facile a jouer; egalite et
instrument sont tres importantes
focus du son: egalite entre les cordes
(l’articulation des debut de notes). Le focus d’un instrument est aussi tres important. Je veux un instrument qui se joue facilement et qui a une egalite entre les cordes. Je cherche finalement un instrument avec une richesse harmonique.
S11/T1 I made my ranking by playing each violin
I did an initial sorting based on quick
in its highest and lowest registers, and
playing in the upper register, looking for
examining how clear and rich the tone was
playability and clarity of tone. [also
at both ends. I examined the violins at
clarity] Then I played slowly in the
different volumes for consistent playability
lower register, listening for depth of
and tone. I played a chord with open
harmonics and emotive possibilities of the
strings and then stopped playing the violin
instrument. Finally, wherever I was unsure
to evaluate the dominant overtones of the
between two I played a few bars on one
die-away. Finally, I examined the overall
and the same on the other, trying to see
feel of playing the violins, looking for
which violin I preferred, based on overall
response, liveliness, fullness of tone and
impression.
clarity of the notes. S11/T2 Fullness and pleasingness of sound as well as playability. continued on next page
150
Appendix: Original verbal responses and coding scheme
continued from previous page Session 1 S12/T1 My most preferred instruments had a clear
Session 2 I tried to judge clarity and responsiveness
and rich sound at the mid-high range
when making my ranking. When it was
(D-A-E strings) and I looked for
difficult to distinguish between
instruments that played quickly on the G
instruments I also judged by how well the
string. I would say that clarity was the
resonated or how well the sound sustained
most important of all criteria and the
in the body of the violin.
instruments with tinny-scratchy sounds I ranked lowest. I was also looking for a sound that was open, I don’t know how to describe this, but sometimes an instrument can sound tight or squeezed. The open feeling is there whether it’s a mellower or sweeter sound, and I feel like I have a lot of versatility in terms of style and ensemble on an instrument with that quality. S12/T3 After three ranking sessions I feel much more confident about my favorite and least favorite violins. All-in-all, I prefer a mellow and clear instrument with good range to the brighter sounding violins, which don’t feel as good on the lower strings. After playing the violin that I thought had a “good feel” in terms of shape, size, etc, I prefer it less and less each ranking session to the others with good sound. continued on next page
Appendix: Original verbal responses and coding scheme
151
continued from previous page Session 1 S13/T1 liberty of sound production, curvature of
Session 2 natural sound quality is the first and
the instrument, namely the finger board,
foremost valued criterion, as each violin
back piece of the violin body (if it’s whole
has individual potential and is more or less
piece or split), sound stability, weight of
suitable for certain sounds and expressions.
the instrument. I started by tuning and
Then would be ease to play and the
simple open strings, which provides a basis
physical built of each instrument, along
for how each instrument would perform
with the dynamics range of each
acoustically. Then, I started with some
instrument and their flexibility. I used
scales on the preferred violins, moved onto
scales at first to test a larger range of
certain pieces for different responses of
pitch, with two different stroke styles, then
dynamics and such. The less preferred
tested excerpts from 1-2 concertos on all
instruments were tested with concerto
the instruments. For the instruments that
excerpts only, and they did indeed produce
I liked more, I also tried harmonics.
a less stable sound range. S13/T3 Most of the criteria were congruent, now
Tried to play etudes on all of them, and
that I am more familiar with all the
the differences were less distinguishable
instruments, it’s easier and more
especially when it comes flexibility. But
important to put liberty and control of
the instruments that I preferred more were
sound as a priority. Some instruments
much easier to work with in terms of
were not as flexible as others.
reflecting techniques.
S13/T5 To add to the previous forms I’ve written,
resonance, especially during chords.
sound consistency also was taken into
Sustained notes and Bach can be good
consideration. I’ve kept one or two pieces
indications and comparison tools.
to played every time to see if performance from each instrument for those consistent pieces are more or less consistent. continued on next page
152
Appendix: Original verbal responses and coding scheme
continued from previous page Session 1 S14/T1 J’ai ecoutee la force du sons du violon tous
Session 2 toujours en écoutant le son du violon et sa
d’abord et regardee la reponse qu’il
resonnance et aussi sur la facilite de sortir
donnait face a mes mouvements et mes
un bon du violon. De plus j’observais
coups d’archet; j’ai aussi ecouter
comment le violon reagis face a des coups
l’equilibre entre les cordes
d’archet plus doux ou plus fort.
S15/T1 L’ouverture du son. Les cordes ouvertes sont les meilleurs indices. S15/T3 Selon la profondeur du son dans le registre grave. S16/T1 Premiere fois le son et apres la facilitee de
resonnance; la rondeur du son; projection de l’instrument Avec le registre les plus bas, et le registre le plus haut. le son et la facilitee de le jouer
le jouer S17/T1 overtones, sound quality (not too muffled), Rich overtones, good basic sound (in playability, color range.
different registers), [also balance] layers of color (in different registers), [also balance] playability of the instrument, first impression on potential for sound projection.
S17/T2 There is also a first impression for projection (which might not be the same in a concert hall). S18/T1 I made my ranking based on sound quality, I made my ranking based on general projection, and consistency across the
quality/uniqueness of sound, consistency
range of the instrument. How easy it is to
across strings, and ability to project.
get around the instrument may have also influenced my decision. continued on next page
Appendix: Original verbal responses and coding scheme
153
continued from previous page Session 1 S19/T1 Based on the sound, how easy/difficult it was to play. I also tried to see if they had
Session 2 Based on the sound and how comfortable is to play on.
any "wolves" and if the sound of the strings was even. S19/T4 This time is based on the sound preference only. S20/T1 I evaluated the violins based on the
I listened for instruments that had a
brightness of their sound (I prefer violins
ringing tone to it but without any kind of
that have a brighter sound to them as
a buzz. I wanted something that really
opposed to a more muted sound) and the
projected from the lower strings and
general feel of the instrument. I looked for
deeper notes but was warm, especially in
something that was light in weight yet
the higher register. I also listened for a
carried a lot of sound. I also looked for a
muddy sound. Some of the less well made
violin that was warm for both the high
violins have this sort of blurry sound,
and the low notes.
where even if you play notes quickly they meld together, while the instruments with the brighter sound seem to sound clearer. [also Speed ] I also looked for responsiveness when changing bow strokes (thought this could be just as related to the strings as well).
S20/T3
I also started playing in higher positions on the lower strings, and the nicer the violin was, the better the sound it produced in higher registers.
154
Appendix: Original verbal responses and coding scheme
A2: Considering the violin you ranked as “most preferred," can you say why?
S1/T1
V
Session 1
V
Session 2
B
the strings harmonized best; pleasant
B
timbre of the strings and relation
sound S2/T1
G
smooth, silky sound
between them C
this violin seemed the easiest to play and its sound was silkier than the others
S2/T2
F
a good physical fit, making it easy to play; a responsive and silky sound
S2/T3
F
I’ve used the word silk, but now I prefer the word mellow.
S3/T1
S3/T3
D
D
I have a preference for a darker colour
D
I liked the tone quality of my first
of sound, with a kind of paradoxical
choice. It had a dark mellow sound
mellowness of tone (i.e without a hard
that is fairly rare in a violin - almost
edge to the sounds) combined with
reminiscent of a viola tone. Since
open powerful projection.
rarity has value I went with it..
I have to say, after playing the instruments several times, I began to notice my ranking of least preferred to most preferred was actually just a ranking of brightest to darkest sounding - which I guess reflects my own preference for darker sounding instruments. (I think darker sounding instruments are also somewhat more of a rarer commodity. The violin that I believe I always ranked as my favourite has a fairly unique type of dark sound - almost similar to a viola type of sound) continued on next page
Appendix: Original verbal responses and coding scheme
155
continued from previous page
S4/T1
V
Session 1
V
Session 2
F
It had the most interesting sound in
F
It was those most interesting sound of
that I felt that I could explore many
all eight although it was lacking in
different tonalities within a single
some other qualities
note duration. [also potential] Although it was not the loudest of all the violins I felt that it would be a nice experience to continue to play it. S5/T1
C
facile a jouer, tres expressif meme
C
il correspond aux qualitees citees plus
dans les nuances piano, tres
haut; facilite de jeu, voix riche et non
confortable a jouer et un son qui
grossiere, confort de jeu
voyage sans forcer S6/T1
G
It was not the most beautiful
D
The violin I liked best was easy to
sounding, nor the most projecting,
play, very even (sounded good
but it had a directness of sound and
consistently), and reacted the way I
power, as well as a pleasing quality of
expected it to at any given point.
sound, and it was comfortable. I thought it was the best all-round. S7/T1
F
It has a beautiful warm sound well
E
My most preferred is different from
balanced when playing the phrases on
that one has been chosen last week. It
all 4 strings. The G-string is full all
has a big round sound, well adjusted
the long to the highest position. This
and balanced from G-string till
violin won’t need any pressure to get
E-string. The color and ability of that
the sound. I liked the response of this
instrument is pleasant for the ears. It
instrument. Beautiful warm piano
responds well to my hands.
even without vibrato, rich and brilliant E-string. continued on next page
156
Appendix: Original verbal responses and coding scheme
continued from previous page V
Session 1
S7/T2
V
Session 2
E
My most preferred violin has a natural beauty of those strings and has an ability to work, to choose, to vary, to look for different nuances of the piano, this violin takes my attention, I would like to continue trying and experimenting on it.
S7/T3
E
Rich, soft, responding to piano and forte
S8/T1
E
It had a deep tone and seemed to
G
The violin I most preferred had a rich,
project well. Frankly, however, I am
powerful and resonant tone. Once
not 100% certain of my choice.
again, I felt as though it was a little too harsh, but in comparison with the rest, I thought it won out.
S8/T3
B
I am not really that crazy about my most preferred choice. But somehow, this time around (in the third trial), it seemed the most balanced and resonant.
S9/T1
D
The “most preferred” violin was by far
D
The “most preferred” violin was the
the most responsive of the
easiest to produce a rich, clear tone
instruments. Each string responded
on. It was perhaps a little softer in
easily with a rich, beautiful, singing
tone than some of the others, but the
tone. Open strings come out clearly
tone was very even over the range of
and easily without being strident, and
the instrument, and it felt great to
it has a very thick sound in the lower
play on this violin.
register. continued on next page
Appendix: Original verbal responses and coding scheme
157
continued from previous page
S9/T3
V
Session 1
D
I am fairly certain that the right-most
V
Session 2
A
Il a un gros son, Il parle tres
violin from this third ordering is the same as that of my first ordering, though I can’t be so positive about the second ordering. Again, the easily-producible singing quality of this instrument made it stand out from the others. S10/T1 C
Belle facilite a jouer et sonorite riche sans etre trop grave ni trop aigue
facilement et les consonnes du violon sont tres articules. Il a une tres bonne richesse harmonique.
S11/T1 C
The violin I most preferred was the
C
The violin I most preferred was the
one that sounded most clear and
one that I most enjoyed playing. I
straightforward to me. The harmonics
speculate that this is so because of its
overtones were neither muted nor
low, quick action, light weight and
overbearing, and the violin was quick
clear, smooth tone.
and fun to play. S11/T2 C
It was the clearest without sounding harsh, and the most harmonic without sounding muddy or hollow.
S12/T1 D
I liked my most preferred violin for its
D
The violin I most preferred has a
mellowness at the mid-range. I can
smooth and mellow sound. It’s not as
also feel the whole body of the
clear and sweet as some of the others,
instrument resonating when I play it,
but the instrument plays well in all
the sound lasts after the bow is lifted.
ranges and does not sound compressed or tinny anywhere. I enjoy playing it the most. continued on next page
158
Appendix: Original verbal responses and coding scheme
continued from previous page V S13/T1 F
Session 1
V
Session 2
tone is the richest and it’s easy to
A
Naturally rich sound quality, very
control. My most preferred has a
easy to manoeuvre on the instrument
good capacity to produce different
and easy to adapt to, the instrument
sound qualities with just enough ease
feels nicely finished. It can be easily
and enough room for control. Unlike
manipulated for different styles and it
some other instruments, sound
gives a powerful performance
doesn’t get trapped inside. S13/T2
F
Easy to apply and concentrate on techniques on playing on that instrument, don’t have to worry too much other things at the same time.
S13/T3 F
The most preferred is the most flexible with what it can perform.
S13/T5 F
extremely easy to handle, among other things such as tone quality
S14/T1 E
Parce qu’il repond bien au mouvement des doigts il n’est pas trop gros et aussi parce qu’il a une tres bonne resonnance
S15/T1 E
A cause de la brillance du son. Tres
E
naturel.
Je pourrais dire que c’est un instrument jeune, mais avec le plus grand potentiel. Dans quelques annees, ce sera un bon instrument.
S15/T3 E
le plus complet.
S16/T1 E
Il y as une bonne reponse dans le son et il est facile a jouer
E
Facile a jouer. Reponse tres vite. Egale sur tout le cordes. continued on next page
Appendix: Original verbal responses and coding scheme
159
continued from previous page V S17/T1 F
Session 1
V
Session 2
It has the overtones over the body of
H
It has a good basic sound and
sound.
somewhat richer in overtones than the others.
S17/T2 A
there is also the evenness of each note.
S17/T5 A
Violin #1 has become the clearer choice now as I am starting to notice some limits in terms of sound color in violin #3.
S18/T1 G
It has a beautiful tone, good
E
It has a beautiful, rich, open sound.
C
The strings seemed the most even and
projection, and is easy to play on. S19/T1 F
It had the nicest sound for me, and it was easiest to play. Projection was
it was easy to play on. The vibrato
very good and the sound was really
projected well.
deep on G string and really nice and clear on E string. S19/T2 C
I really like the size of the instrument. It’s not big and it’s really easy to play.
S19/T4
C
It has the nicest sound for me but I got troubled by its size. It seemed much smaller than the other violins. continued on next page
160
Appendix: Original verbal responses and coding scheme
continued from previous page V S20/T1 A
Session 1
V
Session 2
The sound was bright but each note
E
It had a very clear and projecting
seemed to have a weight behind it.
sound, while at the same time was
The timbre was warm and still bright,
very warm. The higher notes didn’t
and this did not change despite
sound shrill and buzzing, and the
changing strings. The low notes
lower notes were warm and deep. I
projected well while the high notes
found the instrument to be very
did not seem to be too bright. The
responsive, at no point did I feel like I
instrument itself was light so it felt
“fighting” with it to produce the kind
comfortable in my hand.
of sound I want.
A3: Considering the violin you ranked as “least preferred," can you say why?
S1/T1
V
Session 1
V
Session 2
E
one or more strings less responsive
C
the bass timber not beautiful; the
than the others [also Speed ]
high positions (from 4th on) don’t have good color; the sound between strings not even
S2/T1
A
rough edge
D
rough in the G-string and muted, up high especially
S2/T2 S2/T3
G
raw tone H
To distinguish it from the other big violins, the sound of this one is rawer. continued on next page
Appendix: Original verbal responses and coding scheme
161
continued from previous page
S3/T1
V
Session 1
V
Session 2
A
There were several violins I liked less
B
There were at least half of the eight
and it all had to do with a lack of
violins that I didn’t particularly like,
purity in the sound. There was often
and to be honest I had difficulty
extraneous noise (whistles, scratches,
ranking them. No one in particular
buzzes) surrounding the sound rather
stood out as being worse or better
than pure tone. Also most of them
than the others. They had similar
were uneven across the four strings. A
disadvantages - unevenness across the
great E string for example, but then a
strings, a hoarse kind of sound (as if
weak D string or a G string that was
the violin was speaking with a sore
lacking in focus.
throat). The sound of these instrument was also rather constrained, rather than free and open and vibrant.
S4/T1
B
It had a limited colour palette and
C
although it was adequately loud it
It was the most irritating sound. I could not play it for long.
was a little irritating. S5/T1
D
inconfort de jeu, son ample mais sans
D
interet et donc inexpressif, sons sans
une voix sourde, terne qui empeche de voyager, son impersonnel
bcp d’harmoniques S6/T1
A
It sounded tinny and couldn’t take
A
The least preferred instrument
that much weight from the bow. It
sounded tinnier than the others, and
also seemed to lack overtones in the
the sound was difficult to control.
bottom register. It produced overall an unpleasant sound and seemed weak in projection. S6/T2
A
It was the most unpleasant to my ear, and also it didn’t give me much back. I couldn’t control the sound easily. continued on next page
162
Appendix: Original verbal responses and coding scheme
continued from previous page
S7/T1
V
Session 1
V
Session 2
D
Very simple almost colorless sound,
H
The sound has kind of sand in the
demanding a lot of efforts to make it
palette, kind of sore throat color.
sound. Kind of a wolf or sore throat
There is a wolf some where at the
sound when playing piano without
high G-string.
vibrato. [also Speed ] S7/T2
D
The last one just doesn’t respond to what is piano for me
S7/T3
G
I didn’t find an exceptional beauty of E-string on last 3 instruments
S8/T1
B
It didn’t seem to stand up to what I
H
I felt as though the tone was beautiful
was giving it. The tone was somewhat
but muted. This was a tricky decision
flat on the G string and stringy on
as I remember from my last session
the E string.
that (I think it was this instrument) somewhere during the session I changed my mind about it. If I were trying it out in real life, I would simply get someone else to play it for me to see how it sounds away from the ear (in comparison with, say, my first choice). I suspect it is a good instrument that perhaps needs some adjustments made to it.
S9/T1
E
This violin had the thinnest of all the
H
The tone of this violin was weaker
sounds, especially on the A and E
than the rest, especially in the higher
strings. Some parts of the instrument
register of the E string, and there
had a very "tinny" sound, and open
were some notes on the G string,
strings were sometimes slow to
particularly around C5, which didn’t
respond with a settled tone.
speak very clearly or evenly. continued on next page
Appendix: Original verbal responses and coding scheme
163
continued from previous page V S10/T1 E
Session 1
V
Session 2
manque d’egalite entre les graves et
E
Il etait un peu naziare et assez inegal.
les aigues; corde de mi tres acide
La corde de mi n’avait aucune chaleur.
(brillant); manque de focus dans le
Elle etait plutot tres acide.
grave S11/T1 D
S11/T2 A
The violin I least preferred was the
D
The violin I least preferred was the
one that sounded the muddiest to me.
one that I felt had the most hollow
It was somewhat slower to play and
sound. It was muddy in the lower
as the notes were not very defined it
register, and in the upper register the
was not as enjoyable to play for me as
overtones took over. [also clarity] It
some of the other violins. [also
played relatively well, but its sound
clarity]
does not appeal to me.
It was grating in the upper register, despite being clear in the lower register it seemed hollow. This time I chose it as less preferred than the more muddy sounding one. [also clarity and affect]
S12/T1 C
The least preferred violin had a tinny
C
The violin I least preferred has a
sound and was a little scratchy. It felt
compressed and tinny sound, does not
less resonant.
resonate, and sounds a bit rough when played. Rough is the best way I can describe it–it’s not scratchy and it doesn’t feel like it comes from the bow, but it’s more like the sound is like a poor quality recording.
S12/T3 C
I would still describe the worst instruments as tinny and tight sounding, especially on the lower strings. continued on next page
164
Appendix: Original verbal responses and coding scheme
continued from previous page V S13/T1 B
S13/T3 D
Session 1
V
Session 2
It’s hard to play first of all, and I
D
Sound is very muted, especially the
especially didn’t like how the upper
higher pitches. This was my main
strings don’t seem to respond well
concern and picking it as the least
and sounded more "dormant" than
preferred. It takes a little more effort
the other violins.
to produce dynamics.
Least preferred lacked not only ability but also it’s rigid and it takes a lot more effort to produce the exact thing I want
S13/T4
D
Sound is too dry and muted, the least preferred sounds too controlled and mechanic
S14/T1 H
Les cordes etaient mal equilibre
D
Il sonne vraiment éteint il n’a pas de
(beaucoup de force pour la corde la et
volume dans le son par contre il etait
mi mais peu pour la corde sol et re).
facile a controler.
De plus il avait un son tres mince et etouffer S14/T4 B
parce que ce violon n’a aucun tonus il ne vibre pas son sons est tres éteint
S15/T1 F
Le son etait étouffe. petit.
H
Ce violon est a son maximum. pas beaucoup de couleurs sonores a offrir. continued on next page
Appendix: Original verbal responses and coding scheme
165
continued from previous page V S16/T1 C
Session 1
V
Session 2
le son est fermee et trop petit mais
F
Son tres ferme. Il n’y as pas de
peut etre je me trompe a cause de la
vibration.
resonance de la salle. Ca peut que dans une salle avec bonne resonance ca va sonner beaucoup mieux. Je sais aussi que proche de nous l’instrument il peut repondre facile mais a une certain distance il ne sonne pas du tout. S17/T1 D
It is muffled and sounded almost
D
mute. S17/T4 D
It sounds muffled and colorless, and has no overtones
The last one remains clear. The penultimate one becomes clear at this point as well because of its harshness in terms of sound quality.
S18/T1 A
It has a boring, generic sound and I
F
don’t think it would project very well
It is flat-sounding, and not as versatile as the better instruments
in a hall. S19/T1 B
It was really hard to play, the sound
D
It didn’t project as well and didn’t
was very harsh and uneven. It had
like the sound. Also, the neck seemed
few wolves on G string which I really
very big and it made it uncomfortable
didn’t like. It was also hard to make
to play on. The vibrato sound was
nice vibrato on that instrument.
very labored, I had to work hard to hear any waves coming out.
S19/T2 E
It was really hard to play, it felt like a block of wood. Was really heavy and uncomfortable. continued on next page
166
Appendix: Original verbal responses and coding scheme
continued from previous page V S20/T1 H
Session 1
V
Session 2
The sound did not seem to carry well. D
The sound was muted but also had a
When I played it, the notes hardly
buzzing quality to it. Notes played
seemed to leave the instrument. The
quickly sounded blurred and
timbre itself was not very warm, it
unrecognizable [also clarity] and
was more tinny and even a bit
bow changes all felt much less
scratchy. The notes on the E string
responsive. Besides being muted, I
sounded scratchy and the notes on
also found the sound to be a bit
the G and D string seemed muted
scratchy.
and flat. The instrument was heavy and felt awkward to manipulate. S20/T4 D
The violin I ranked least preferred, and any of those around it, actually had a slight buzzing noise, especially when playing the A and E strings. I began to listen to that when determining how to rank the instruments.
B2: More generally, what is a very good violin for you?
S1
Session 1
Session 2
when I play a scale, the timbre of the notes
timbre
and the way they lead into the next S2
smooth and silky sound; the four strings are
The sound has to have substance, depth. It
equal
has to be easy to play, responsive. It has to feel right. continued on next page
Appendix: Original verbal responses and coding scheme
167
continued from previous page
S3
Session 1
Session 2
A very good violin has the same qualities as
Clean open, pure, vibrant, unrestrained
a very good violinist. Full, easy projection
sound, unique colour to that sound, no
of a beautiful sound with a unique colour,
whistles scratches or hoarseness, evenness
without any whistles, scratches, unevenness, across the strings. or harshness. A good violin also has some paradoxical qualities - sweetness and mellowness combined with power and projection. A weaker violin well tend to sound as if there is something inhibiting the sound - the sound will sound strangled or will break or scratch under bow weight. [also clarity] S4
A good violin is a tool that is good for a
The sound must inspire ...it must resonate
specific job. I look for an instrument that
and project
does not require me to work too hard to overcome its personality but lets me play my own. I also look for an instrument that will inspire me to play, will make me want to play more. S5
un violon profond avec une grande palette
un violon offrand le plus de possibilitees
de couleurs et une voix qui porte au loin
differentes ... texture , timbre , dinamiques
sans forcer (meme dans le pianissimo) S6
An instrument that is good needs to feel
A good instrument is easy to play, responds
comfortable, sound interesting and round,
in a predictable way to my gestures, sounds
with enough complexity in the sound (ie:
beautiful, and is even throughout all
overtones) that I can get a variety of sounds
registers. It needs to have good projection
with ease. Also, I am looking for an
as well.
instrument that has a quick response, where the beginning of the sound is very clear. [also clarity] continued on next page
168
Appendix: Original verbal responses and coding scheme
continued from previous page
S7
Session 1
Session 2
As I wrote in the first block of questions -
As my criteria: beautiful rich sound; easy
big spectrum of colors of the sound, rich
respond; well balanced from G to E; no
and powerful G, golden E, easy articulation, issue like wolfs well balanced strings, possibility to vary my vibrato and bow pressure for my musical needs. S8
There is a certain velvety quality to the
A fiddle that is well balanced, powerful, has
tone of really excellent instruments. If an
a rich velvety tone and a deep resonance is
instrument has that, but remains powerful,
what characterises a good instrument in my
can be manipulated to play in a wide range
opinion.
of timbres, and is balanced across strings and register then it is, in my estimation, a very good violin. S9
I like a violin that puts out a good volume
A good violin for me is one that combines
of sound, responds well, and allows for very
an even, resonant, singing tone with good
clear articulation. [also Speed ]
sound production. I often play fiddle and rock music, and although a good sound is always important, I also need to be able to play loudly.
S10 un instrument qui est tres egale entre les
harmoniques tres riches (en general un
haute frequences et les basses. Un
violon plus age donnera de meilleurs
instrument qui a beaucoup de puissance
resultats en considerant que la facture
sonore et qui a un large spectre harmonique
originelle etait excellente), bonne puissance
et qui peut donc degager beaucoup de
sonore et facilite a jouer.
chaleur. Finalement un instrument qui est facile a jouer ( tres important) continued on next page
Appendix: Original verbal responses and coding scheme
169
continued from previous page Session 1 S11 For me, a very good violin is one which acts
Session 2 To me, a very good violin is one which can
merely as amplification for what the player
respond emotionally and dramatically to my
is attempting to convey. It is responsive to
playing, one that is clear and full in tone
changes in dynamic and in mood but
and easy and quick to play. It should also
consistent in playability and tone.
be light, and interesting-looking.
S12 I think something light, quick, and sweet
After spending so much time playing these
would be an ideal violin for me. This is not
8, I think it would take a long time to suss
to say I have that kind of violin, but it’s one
out exactly what is right for me, but I think
that I would like to have, if price wasn’t an
I would want a violin that’s both sweet and
issue. These sound/feeling combinations
resonant, especially on the lower strings.
suit the kind of music I want to play on the violin. S13 1. easy to handle, this must be done
naturally rich tone is the strongest asset, it
through design and material. A fit bridge is
needs to have good physical architecture to
also very important. 2. light enough but not
be convenient to handle, it needs have a
too light in weight. I noticed that since all
light weight but at the same time very
the shoulder rests were the same, some
powerful. Sound must be very rich and
instruments were heavier than others. 3.
strong, and the violin should have a
rich tone, fit for soloists 4. reflexible
relatively good flexibility when it comes to
responses and easy controls. 5. powerful
range.
resonance. S14 Il resonne fort, la touche est agreable, il n’est pas trop lourd, les quatres cordes sont
Par le son la legerete la solidite et la facilite a jouer sur la touche.
de force egale [also Power ] et finalement il a un beau sons. S15 Le violon doit offrir plusieurs possiblites de creer differentes couleurs.
Le violon doit posseder une variete de couleur dans les graves et les aigues. continued on next page
170
Appendix: Original verbal responses and coding scheme
continued from previous page Session 1 S16 je pense que il y as plusieurs criterie pour definir une bonne violon. Mais ca depend de
Session 2 Ca depand beaucoup le son parce que je suis violoniste
notre gout et aussi de quelle sorte (genre) de musique on joue. S17 A good violin would have a good depth of
Rich in overtones, bright (but not harsh)
sound with a lot of overtones. It would also
and "cushioned" e-string, deep but open
show many different shades within one
g-string, ringing a- and d-strings. Its sound
single note.
and sound quality must carry in big concert hall. It also has to be well-made in terms of craftsmanship.
S18 A very good violin is versatile—it has a
A very good violin can do anything you
warm, sweet sound but can also project and
want it to. It is versatile, has a unique
be bright when you need it to be. It is also
sound, and can fill a hall.
easy to play. S19 It has to project well and it needs a nice, round sound. I look also for the type of
Great, warm sound, good projection, even sound. It has to be comfortable to play too.
instrument that would be good for small chamber ensembles and for playing solo. S20 For me, a particularly good violin is one
It was a fairly good violin. I would still have
that is light (this helps to keep tension
wanted something with a slightly warmer
down when playing b/c I feel I have more
sound, so it would not have been my ideal
control with my arm) and one that is bright
choice. I really like the shape and size of it,
for all strings but not tinny, especially when
though. There was still a slight bit of
playing the top two. And of course I want
shrillness to the sound, but it was much
one that has no buzzing sound, which some
much less so than some of the other
appears to have.
instruments.
Study 2 B2: More generally, what is a very good violin for you?
Appendix: Original verbal responses and coding scheme
S1
171
I love violins with warm, dark tone. They need to be well balanced (mine is NOT!) and need to respond easily (mine does NOT!). Generally the easier to play the better, but some violins need time to open up to a player and I’m willing to figure out how to play a certain instrument as long as I can tell from the beginning that it will respond to me.
S2
It is a very subjective thing: first, the feeling of the instrument itself; how it responds to my playing..how I respond to it. Feeling a healthy contact with the bow on the strings, and feeling a resonance with the instrument; then there is a sound that I look for. I can’t exactly explain it, but I can tell you that I know when it is there, and when it isn’t
S3
Tone is very important - warm sound, that is even across all strings. The clarity of tone is also very important. Other factors include how easy it is for me to perform on the instrument and the looks of it.
S4
Le violon ideal n’existant pas, un tres bon violon doit ressembler a son possesseur. Un bon equilibre entre couleur de son et une bonne projection. Il doit repondre au quart de tour et etre maniable. Il doit pouvoir offrir de chercher davantage.
S5
Something powerful with lots of different colours to explore. Something bright sounding on top. Something that is easy to project on.
S6
pleasant/interesting sound, ease of playing, good dynamic range
S7
C est un melange subtil de rondeur, de coupant et de puissance dans le son et aussi des possibilites dynamiques qui permettent de colorer. Pas necessairement un violon facile a jouer mais qui permette d exploiter sa complexite au maximum.
S8
I like a rich, yet bright sound. I seem to prefer smaller violins with lower action than some of the violins I played today. I have never played on new violins before, so this was a good experiment for me. I like a violin that has a loud and easy-to-produce sound.
S9
One that speaks clearly, with many colours. Many of the instruments presented spoke nicely and sounded clear under the ear, but they lacked a variety of colours that are more difficult to come across.
S10 Something that is very responsive to both the bow and the fingers, with a rich yet bright and clear tone. There is no buzzing or extra noise besides clear and good harmonics. continued on next page
172
Appendix: Original verbal responses and coding scheme
continued from previous page S11 I am not as concerned with quick response as I am with the result – I’d happily work hard for a great sound in an instrument. I want something with a complex sound that can cut across a hall but not to such an extreme that it sounds shaved on the top. S12 Un instrument qui projette effectivement au niveau du volume, qui offre une gamme de couleurs interessantes au niveau du timbre, qui réagit resonablement facilement, qui a un son disctintivement “beau”. . . que ce soit un instrument ancien ou moderne. S13 Something that has a real character. It doesn’t need to be perfect across the board, but it needs to respond interestingly to different approaches.
173
Bibliography Alonso Moral, J. and Jansson, E. V. (1982). “Input admittance, eigenmodes and quality of violins”, Technical Report STL-QPSR 2-3, Dept. for Speech, Music and Hearing, KTH. Askenfelt, A. (1989). “Measurement of the bowing parameters in violin playing. II: Bowbridge distance, dynamic range, and limits of bow force”, J. Acoust. Soc. Am. 86, 503–516. Askenfelt, A. and Jansson, E. V. (1992). “On vibration sensation and finger touch in stringed instrument playing”, Music Percept. 9, 311–350. Bernays, M. and Traube, C. (2011). “Verbal expression of piano timbre: Multidimensional semantic space of adjectival descriptors”, in Proc. Int. Symp. Perf. Sci. (ISPS 2011), edited by A. Williamon, D. Edwards, and L. Bartel, 299–304 (European Association of Conservatoires (AEC), Toronto, Ontario, Canada). Bissinger, G. (1995). “Some mechanical and acoustical consequences of the violin soundpost”, Journal of Acoustical Society of America 97, 3154–3164. Bissinger, G. (2005). “A unified materials-normal mode approach to violin acoustics”, Acust. Acta Acust. 91, 214–228. Bissinger, G. (2006). “The violin bridge as filter”, Journal of Acoustical Society of America 120, 482–491. Bissinger, G. (2008). “Structural acoustics of good and bad violins”, J. Acoust. Soc. Am. 124, 1764–1773. Bissinger, G. and Gearhart, F. (1998). “A standardized qualitative violin evaluation procedure?”, Catgut Acoust. Soc. J. (Series II) 3, 44–45.
174
Bibliography
Bissinger, G. and Gregorian, A. (2003). “Relating normal mode properties of violins to overall quality: Part I: Signature modes”, Catgut Acoust. Soc. J. (Series II) 4, 37–45. Bissinger, G. and Kuntao, Y. (2000). “Automated hammer-impact modal analysis with a scanning laser vibrometer: Working example—a violin”, in Proc. 18th Int. Modal Analysis Conf., 943–949 (San Antonio TX). Boutard, G. (2013). “Preserving the intelligibility of digital archives of contemporary music with live electronics: a theoretical and practical framework”, Ph.D. thesis, School of Information Studies, McGill University, Montreal, Quebec, Canada. Boyden, D. D. (1965). History of violin making from its origins to 1761 and its relationship to the violin and violin music (Oxford University Press, London; New York). Boyden, D. D., Walls, P., Holman, P., Moens, K., Stowell, R., Barnett, A., Glaser, M., Shipton, A., Cooke, P., Dick, A., and Goertzen, C. (online). “Violin”, in Grove Music Online, Oxford Music Online (Oxford University Press), http://www.oxfordmusiconline.com/ subscriber/article/grove/music/41161pg1, accessed May 9, 2013. Brown, H. M. and Jones, S. S. (online). “Lira da braccio”, in Grove Music Online, Oxford Music Online (Oxford University Press), http://www.oxfordmusiconline.com/ subscriber/article/grove/music/16742, accessed May 9, 2013. Campbell, M., Greated, C., and Myers, A. (2004). Musical instruments: History, technology, and performance of instruments of western music (Oxford University Press). Caussé, R., Maigret, J. P., Dichtel, C., and Bensoam, J. (2001). “Study of violin bow quality”, in Proc. 2001 Int. Symp. Music. Acoust. (Perugia, Italy). Cheminée, P. (2009). “Est-ce bien clair ? Stabilité, instabilité et polysémie d’une forme lexicale en contexte”, in Le sentir et le dire: Concepts et méthodes en psychologie et linguistique cognitives, edited by D. Dubois (L’Harmattan, Paris). Coggins, A. (2007). “Blind faith”, The Strad 118, 52–55. Cremer, L. (1984). The Physics of the Violin (The MIT Press, Cambridge MA). Curtin, J. and Schleske, M. (2003). “Can you hear me?”, The Strad 114, 1103–1110.
Bibliography
175
Demoucron, M. (2008). “On the control of virtual violins: Physical modelling and control of bowed string instruments”, Ph.D. thesis, Université Pierre et Marie Curie (UPMC), Paris, France, and Royal Institute of Technology (KTH), Stockholm, Sweden. Dubois, D. (2000). “Categories as acts of meaning: The case of categories in olfaction and audition”, Cognitive Science Quaterly 1, 35–68. Dünnwald, H. (1991). “Deduction of objective quality parameters on old and new violins”, Catgut Acoust. Soc. J. (Series II) 1, 1–5. Eitan, Z. and Rothschild, I. (2011). “How music touches: Musical parameters and listeners’ audio-tactile metaphorical mappings”, Psychology of Music 39, 449–467. Eitan, Z. and Timmers, R. (2010). “Beethoven’s last piano sonata and those who follow crocodiles: Cross-domain mappings of auditory pitch in a musical context”, Cognition 114, 405–422. Fletcher, N. H. and Rossing, T. D. (1998). The Physics of Musical Instruments, second edition (Springer, New York). Fritz, C., Blackwell, A. F., Cross, I., Moore, B. C. J., and Woodhouse, J. (2008). “Investigating English violin timbre descriptors”, in Proc. 10th Int. Conf. Music Percept. Cogn. (Sapporo, Japan). Fritz, C., Blackwell, A. F., Cross, I., Woodhouse, J., and Moore, B. C. J. (2012a). “Exploring violin sound quality: Investigating English timbre descriptors and correlating resynthesized acoustical modifications with perceptual properties”, J. Acoust. Soc. Am. 131, 783–794. Fritz, C., Cross, I., Moore, B. C. J., and Woodhouse, J. (2007). “Perceptual thresholds for detecting modifications applied to the acoustical properties of a violin”, J. Acoust. Soc. Am. 122, 3640–3650. Fritz, C., Curtin, J., Poitevineau, J., Morrel-Samuels, P., and Tao, F.-C. (2012b). “Player preferences among new and old violins”, Proc. Nat. Acad. Sci. USA 109, 760–763. Fritz, C., Muslewski, A., and Dubois, D. (2010a). “A situated and cognitive approach of violin quality”, in Proc. 2010 Int. Symp. Music. Acoust. (Sydney and Katoomba, Australia).
176
Bibliography
Fritz, C., Woodhouse, J., Cheng, F. P.-H., Cross, I., Blackwell, A. F., and Moore, B. C. J. (2010b). “Perceptual studies of violin body damping and vibrato”, J. Acoust. Soc. Am. 127, 513–524. Gabrielsson, A. and Jansson, E. V. (1979). “Long-time-average-spectra and rated qualities of twenty-two violins”, Acustica 42, 47–55. Giordano, B. L., Susini, P., and Bresin, R. (2012). “Perceptual evaluation of sound-producing objects”, in Sonic Interaction Design, edited by K. Franinovic and S. Serafin, 151–197 (MIT Press, Boston, MA). Glaser, B. G. and Strauss, A. L. (1967). The discovery of grounded theory: Strategies for qualitative research (Aldine Publishing, Chicago, IL). Gough, C. (2007). “The violin: chladni patterns, plates, shells and sounds”, European Physical Journal Special Topics 145, 77–101. Grey, J. M. (1977). “Multidimensional perceptual scaling of musical timbres”, J. Acoust. Soc. Am. 61, 1270–1277. Grey, J. M. and Gordon, J. W. (1978). “Perceptual effects of spectral modifications on musical timbres”, J. Acoust. Soc. Am. 63, 1493–1500. Guettler, K. (2002). “The bowed string: On the development of Helmholtz motion and on the creation of anomalous low frequencies”, Ph.D. thesis, Dept. of Speech, Music and Hearing, Royal Institute of Technology (KTH), Stockholm, Sweden. Hargreaves, D. J. and Colman, A. M. (1981). “The dimensions of aesthetic reactions to music”, Psychology of Music 9, 15–20. Helmholtz, H. (1863). Die Lehre von den Tonempfindungen als physiologische Grundlage für die Theorie der Musik (On the sensations of tone as a physiological basis for the theory of music), original edition (Vieweg, Braunschweig). Helmholtz, H. (1954). On the sensations of tone, 2nd edition (Dover, New York). Hutchins, C. M., ed. (1975). Musical acoustics, Part I: Violin family components, volume 5 of Benchmark Papers in Acoustics (Dowden, Hutchinson & Ross, Stroudsburg PA).
Bibliography
177
Hutchins, C. M., ed. (1976). Musical acoustics, Part II: Violin family functions, volume 6 of Benchmark Papers in Acoustics (Dowden, Hutchinson & Ross, Stroudsburg PA). Hutchins, C. M. (1983). “A history of violin research”, J. Acoust. Soc. Am. 73, 1421–1440. Hutchins, C. M. (1989). “A measurable controlling factor in the tone and playing qualities of violins”, Catgut Acoust. Soc. J. (Series II) 1, 10–15. Hutchins, C. M. and Benade, V., eds. (1997). Research Papers in Violin Acoustics 1975-1993 (Acoustical Society of America). Inta, R., Smith, J., and Wolfe, J. (2005). “Measurement of the effect on violins of ageing and playing”, Acoust. Australia 33, 25–29. Jansson, E. V. (1997). “Admittance measurements of 25 high quality violins”, Acust. Acta Acust. 83, 337–341. Jansson, E. V. (2002). Acoustics for violin and guitar makers (KTH Department of Speech, Music and Hearing, Stockholm, Sweden). Jansson, E. V. and Niewczyk, B. K. (1999). “On the acoustics of the violin: bridge or body hill”, Catgut Acoust. Soc. J. (Series II) 3, 23–27. Kendall, M. G. (1962). Rank correlation methods, 3rd edition (Hafner Pub. Co., New York). Knott, G. A., Shin, Y. S., and Chargin, M. (1989). “A modal analysis of the violin”, Finite Elements in Analysis and Design 5, 269–279. Lin, L. I. (1989). “A concordance correlation coefficient to evaluate reproducibility.”, Biometrics 45, 255–268. Loos, U. (1995). “Untersuchungen zur Tragfähigkeit von Geigentönen (Studies on the projection of violin tones)”, Ph.D. thesis, Dept. of Media, University of Applied Sciences, Düsseldorf, Germany. Łukasik, E. (2003). “AMATI - Multimedia database of violin sounds”, in Proc. Stockholm Music Acoust. Conf., 79–82.
178
Bibliography
Łukasik, E. (2005). “Towards timbre-driven semantic retrieval of violins”, in Proc. 5th Int. Conf. Intellig. Syst. Des. Applicat., 55–60. Marshall, K. D. (1985). “Modal analysis of a violin”, J. Acoust. Soc. Am. 77, 695–709. McIntyre, M. E. and Woodhouse, J. (1978). “The acoustics of stringed musical instruments”, Interdiscip. Sci. Rev. 3, 157–173. Meinel, H. F. (1957). “Regarding the sound quality of violins and a scientific basis for violin construction”, J. Acoust. Soc. Am. 29, 817–822. Miller, R. G. (1981). Simultaneous statistical inference, Springer series in statistics, 2nd edition (Springer-Verlag, New York). Moya, H. and Piper, T. (1916). Violin tone and violin makers (Chatto & Windus, London). Nichols, C. (2003). “The vbow: An expressive musical controller haptic human-computer interface”, Ph.D. thesis, Stanford University, Stanford CA. Oliver, D. E., Palan, V., Bissinger, G., and Rowe, D. (2007). “3-Dimensional laser Doppler vibration analysis of a stradivarious violin”, in Proc. 25th Int. Modal Analysis Conf., Soc. for Exp. Mechanics (Bethel CT). Peeters, G., Giordano, B. L., Susini, P., Misdariis, N., and McAdams, S. (2011). “The Timbre Toolbox: Extracting audio descriptors from musical signals”, J. Acoust. Soc. Am. 130, 2902–2916. Petiot, J.-F. and Caussé, R. (2007). “Perceptual differences between cellos: A subjective/objective study”, in Proc. 2007 Int. Symp. Music. Acoust. (Barcelona, Spain). Pio, S. (2011). Viol and lute makers of Venice 1490 - 1630 (Venice Research, Venice, Italy). Pollard, H. and Jansson, E. V. (1982). “A tristimulus method for the specification of musical timbre”, Acustica 51, 162–171. Raman, C. V. (1918). “On the mechanical theory of the vibration of bowed strings and of musical instruments of the violin family, with experimental verification of results: Part I”, Bulletin of the Indian Association for the Cultivation of Science 15, 1–158.
Bibliography
179
Roberts, G. W. (1986). “Finite element analysis of the violin”, in Research Papers in Violin Acoustics 1975-1993, edited by C. M. Hutchins and V. Benade, 575–590 (Acoustical Society of America, 1997), extract from PhD thesis. Rodgers, O. E. and Anderson, P. (2001). “Finite element analysis of a violin corpus”, Catgut Acoust. Soc. J. (Series II) 4, 13–26. Rossing, T. D. (1982). The science of sound (Addison-Wesley, Reading MA). Rossing, T. D. (2007). “Observing and labeling resonances of violins”, in Proc. 2007 Int. Symp. Music. Acoust. (Barcelona, Spain). Rossing, T. D., ed. (2010). The science of string instruments (Springer, New York). Saitis, C., Giordano, B. L., Fritz, C., and Scavone, G. P. (2012). “Perceptual evaluation of violins: A quantitative analysis of preference judgements by experienced players”, J. Acoust. Soc. Am. 132, 4002–4012. Saunders, F. A. (1937). “The mechanical action of violins”, Journal of Acoustical Society of America 9, 81–98. Saunders, F. A. (1946). “The mechanical action of instruments of the violin family”, Journal of Acoustical Society of America 17, 169–186. Schelleng, J. C. (1971). “The action of the soundpost”, Catgut Acoust. Soc. Newsl. 16, 11–15. Schleske, M. (2002). “Empirical tools in contemporary violin making: Part I. Analysis of design, materials, varnish, and normal modes”, Catgut Acoust. Soc. J. (Series II) 4, 50–64. Schoonderwaldt, E. (2009a). “Mechanics and acoustics of violin bowing: Freedom, constraints and control in performance”, Ph.D. thesis, School Comput. Sci. Commun., Royal Institute of Technology (KTH), Stockholm, Sweden. Schoonderwaldt, E. (2009b). “The player and the bowed string: Coordination of bowing parameters in violin and viola performance”, J. Acoust. Soc. Am. 126, 2709–2720. Schoonderwaldt, E. (2009c). “The violinist’s sound palette: Spectral centroid, pitch flattening and anomalous low frequencies”, Acust. Acta Acust. 95, 901–914.
180
Bibliography
Schoonderwaldt, E., Guettler, K., and Askenfelt, A. (2008). “An empirical investigation of bow-force limits in the Schelleng diagram”, Acust. Acta Acust. 94, 604–622. Schubert, E. and Wolfe, J. (2006). “Does timbral brightness scale with frequency and spectral centroid?”, Acust. Acta Acust. 92, 820–825. Strauss, A. L. and Corbin, J. M. (1998). Basics of qualitative research: Techniques and procedures for developing grounded theory, 2nd edition (Sage Publications Inc., Thousand Oaks, CA). Sundberg, J. (1977). “The acoustics of the singing voice”, Scientific American 236, 82–91. Traube, C. (2004). “An interdisciplinary study of the timbre of the classical guitar”, Ph.D. thesis, Dept. of Music Research, McGill University, Montreal, Quebec, Canada. ˘ epánek, J. (2002). “Evaluation of timbre of violin tones according to selected verbal St˘ attributes”, in Proc. 32nd Int. Acoust. Conf., Eur. Acoust. Assoc. (EAA) Symp. “ACOUS˘ TICS BANSKÁ STIAVNICA, 129–132 (Slovakia). ˘ epánek, J. and Ot˘cená˘sek, Z. (1999). “Rustle as an attribute of timbre of stationary violin St˘ tones”, Catgut Acoust. Soc. J. (Series II) 3, 32–38. ˘ epánek, J., Ot˘cená˘sek, Z., and Melka, A. (1999). “Comparison of five perceptual timbre St˘ spaces of violin tones of different pitches”, J. Acoust. Soc. Am. 105, 1330. von Bismarck, G. (1974). “Timbre of steady tones: A factorial investigation of its verbal attributes”, Acustica 30, 146–159. Weinreich, G. (1997). “Directional tone color”, J. Acoust. Soc. Am. 101, 2338–2346. Willgoss, R. and Walker, R. (2007). “Discernment of the sound of a violin”, in Proc. 8th WSEAS Int. Conf. Acoust. & Music: Theory & Applicat., 1–6 (Vancouver, Canada). Wollman, I., Fritz, C., and McAdams, S. (2012). “The role of auditory and tactile modalities in violin quality evaluation”, in Proc. 12th Int. Conf. Music Percept. Cogn., 1135 (Thessaloniki, Greece).
Bibliography
181
Woodfield, I. and Robinson, L. (online). “Viol”, in Grove Music Online, Oxford Music Online (Oxford University Press), http://www.oxfordmusiconline.com/subscriber/ article/grove/music/29435, accessed May 9, 2013. Woodhouse, J. (1993a). “On the playability of violins. part I: Reflection functions”, Acustica 78, 125–136. Woodhouse, J. (1993b). “On the playability of violins. part II: Minimum bow force and transients”, Acustica 78, 137–153. Woodhouse, J. and Langley, R. S. (2012). “Interpreting the input admittance of violins and guitars”, Acust. Acta Acust. 98, 611–628. Wright, H. (1996). “The acoustics and psychoacoustics of the guitar”, Ph.D. thesis, Dept. of Physics and Astronomy, University of Wales, Cardiff, UK. Zacharakis, A. (2013). “Musical timbre: Bridging perception with semantics”, Ph.D. thesis, Queen Mary University of London, London, UK. Zajonc, R. B. (1968). “Attitudinal effects of mere exposure”, J. Pers. Soc. Psychol. 9, 1–27.