well known castles repeatedly, although highly relevant, the user may never find out about castles from ..... Melbourne, Australia, 1998. ACM. 4. Charles L.A. ...
Evaluation and User Preference Study on Spatial Diversity Jiayu Tang, Mark Sanderson Department of Information Studies, University of Sheffield, UK {j.tang, m.sanderson}@sheffield.ac.uk
Abstract. Spatial diversity is a relatively new branch of research in the context of spatial information retrieval. Although the assumption that spatially diversified results may meet users’ needs better seems reasonable, there has been little hard evidence in the literature indicating so. In this paper, we will show the potentials of spatial diversity by not only the traditional evaluation metrics (precision and cluster recall), but also through a user preference study using Amazon Mechanical Turk. The encouraging results from the latter prove that users do have strong preference on spatially diversified results.
1
Introduction
In information retrieval, users’ needs seem to be multi-dimensional. For example, a potential buyer searching for images of a particular camera is not only interested in image of “this” camera (first dimension, relevance), but also interested in images taken from different directions (second dimension, visual diversity [7]). A person who submitted the query “Castles in the UK” is perhaps interested in all kinds of castles from the whole UK. If the search system only shows a few well known castles repeatedly, although highly relevant, the user may never find out about castles from other places that would also interest him. Thus, a search result that is not only relevant (first dimension, relevance) but also covers many different places (second dimension, spatial diversity [9]) will perhaps meet users’ needs better. The research in this paper will be focused on spatial diversity. Although in spatial information retrieval, the assumption that users would prefer spatially diversified results seems to be reasonable, to the best of our knowledge there has been little hard evidence in the literature indicating so. Therefore, We have conducted a user experiment in Amazon Mechanical Turk (MTurk), to investigate whether such an assumption stands. The results are encouraging. Details of the experiment will be presented in this paper, as well as evaluation results on precision and cluster recall.
2 2.1
Background Related Work on Diversity
By avoiding duplicated and near duplicated documents, diversity featured search systems try to meet different users’ information needs by generating a more di-
verse list of results. Carbonell and Goldstein’s work [3] is probably the first to identify the need for diversity in IR. Their Maximal Marginal Relevance (MMR) algorithm realized diversity by selecting documents that are both relevant and the least similar to the documents already chosen. More recently, Zhai et al. [14] adopted language models to measure the novelty contained in documents and then tried to increase diversity by bringing more novelty. Zhang et al. [15] invented Affinity Ranking to improve the diversity in web search. Information richness scores are calculated from an affinity graph which models the asymmetric similarities between every pair of documents, and then used for re-ranking. Deselaers et al. [7] proposed a method to diversify image search results so that the top images are more diverse visually. While most of the research on diversity in IR is concerned with the semantics of documents or the visual content of images, some other researchers raised the importance of another dimension of diversity - spatial diversity [13, 5, 9]. The work in [13] is perhaps the first to bring diversity to spatial information retrieval. Their geographical distributed ranking algorithms are effectively algorithms for diversifying results spatially. Later on, Paramita et al. [9] proposed two spatial diversity algorithms and evaluated them using a formal test data-set. However, both studies did not give a theoretical explanation on spatial diversity, rather they tackled the problem by selecting documents that are not only relevant but also geographically the furthest from previous ones. 2.2
Diversity Evaluation
The most popular evaluation metric for diversity is probably sub-topic recall (also known as S-recall or cluster recall) [14]. Sub-topic is analogous to the idea of “information nugget” [4] that is becoming popular in the summarization and question answering community. Clarke et al. [4] modeled the user’s information needs as a set of nuggets u ⊆ N , here N = {n1 , ..., nm } is the space of possbile nuggets. A document is regarded as relevant if it has one or more nuggets that also exist in user’s information need. Following this perspective, it is probably fair to say that the goal of a diversity approach is to generate a list of documents that cover as many different information nuggets, which exist in the user information needs, as possible. Sub-topic recall [14], which calculates the percentage of subtopics covered, is effectively a measure of how well different information nuggets are covered. S-recall at rank K is computed as follows S-recall at K =
| ∪K i=1 subtopics(di )| nA
(1)
where nA represents the total number of sub-topic in the given topic, and subtopics(di ) denotes the set of sub-topics to which document di is relevant. Therefore, S-recall at K represents the percentage of retrieved sub-topics in the top K documents. In the recent campaign, ImageCLEFPhoto 2008, participants were encouraged to implement diversity in the retrieval process [2]. The relevant images of
each test collection topic were manually grouped into topic clusters (i.e. subtopics) by the organizers. For example, in geographic query, different clusters were represented by different places of where the images were captured. The organisers also used S-recall [14] for their diversity evaluation. 2.3
Amazon Mechanical Turk (MTurk)
Amazon Mechanical Turk (also known as MTurk) is an increasingly popular crowdsourcing Internet service. It provides a platform for collecting human intelligence for tasks which can not be done by computers. A task is called a HIT (Human Intelligence Task), in which two parties are involved, the requester and the worker. Requesters are people who submit the HIT, and workers (also called providers) are people who complete the HIT and receive a monetary payment from the requester. MTurk has been used by researchers for many different tasks, such as image region annotation [11], retrieval relevance assessment [1] and extracting document facets [6]. However, the main problem for using MTurk is how to ensure the quality of results, because it is argued that some workers will give random answers in order to complete the tasks quickly. MTurk provides a number of quality control mechanisms, such as a minimal approval rate which allows only workers who have an overall approval rate that is above the minimal to work on the task, and pre-task assessment questions which can be applied to filter out workers who cannot pass them. Unfortunately, these methods still can not solve the problem completely. A user who passed the pre-task assessment questions can still give random answers when he actually did the HIT. Researchers have proposed some other approaches to tackle the problem. [11] and [1] suggest to collect multiple results from each HIT and remove those deviating from the majority of workers. Furthermore, [1] proposed to calculate a weighted overall score for a HIT from multiple results, which may be calculated by giving more weight to workers are considered as more reputable (e.g. a high approval rate). Finally, [11] suggest to insert some “gold standard data” into the tasks to identify malicious workers. Those who gave too many wrong answers to the gold standard are more likely to add noise to the overall results and thus can be filtered out.
3
What is Spatial Diversity?
Spatial diversity refers to diversity in the geographical dimension of spatial information retrieval, which normally contains other dimensions such as the semantics of text. A good result should be relevant not only semantically, but also geographically. For example, for the query “castles in UK”, relevant documents are those describing “castles” and meanwhile located in “UK”. In this work, a document takes the form of a photo annotated with text and the GPS location of where it was taken. Whilst diversity can also be applied to other dimensions, our research is focused on the geographical/spatial dimension.
In the work of [13], the phrase “high spreading” is used to express the notion of spatial diversity. The explanation of high spreading was “points further away from already ranked points are favored”. Here, “points” denote geographical locations, and “further away” refers to distances. Paramita et al. [9], on the other hand, described spatial diversity as “a way to present diverse results to users by presenting documents from as many different locations as possible”. However, neither of the two studies have given a clear definition. [12] attempted to define spatial diversity from a more theoretical perspective. They used the information nugget idea [4] to analyze users’ spatial information needs in queries that use “in” as the spatial relationship, e.g. “castles in UK”. It is assumed that a user who issued an “in” query is generally interested in semantically relevant documents from all or a subset of the locations within the area of interest (e.g. UK). Thus, every location is regarded as a spatial information nugget and the whole collection of nuggets (i.e. locations) constitute the user’s spatial information needs. When the user is shown a document from location A, his spatial information needs on A is met to some extent. It is therefore better to show him documents from other locations. However, documents from very close locations are intuitively unfavorable. For example, having seen a photo taken from the left side of a castle, despite that they are all from different locations, the user may not be as interested in a photo taken from the right side as in a totally different castle. Or in a more upper level, having seen a photo of a castle in England, the user may now become more interested in Scottish castles than English ones. This was explained by [12]’s assumption that “in spatial information retrieval, each document has a certain level of coverage of its neighboring locations”. The word “coverage” refers to the assumption that every document has some influence on not only the exact location it comes from, but also on its neighboring ones. In other words, having seen a document from a location A, the user’s spatial information needs on the neighboring locations of A are also partially met. The intensity of coverage generally decreases as the distance increases. Then, [12] defined spatial diversity as “a measure of location coverage”. The more locations that are covered and more intense the coverage is, the better spatial diversity a list of documents achieves, which may satisfy users better.
4
Spatial Diversity Techniques
In this section, we will briefly introduce the three spatial diversity algorithms used in our experiments, namely Geometric Mean (GM) from [9], and SC-1 and SC-2 from [12]. They all work by re-ranking the standard search results so that documents from different locations are promoted to the top of the list, while trying to maintain the precision. Thus, two factors need to be taken into account - semantic relevance and spatial diversity. 4.1
The Geometric Mean (GM) Algorithm.
The GM diversity algorithm [9] is an iterative re-ranking method inspired by the GMAP algorithm of [10] used for aggregating scores across topics. In each
iteration, it chooses the document with the highest diversity score from the remaining list and appends it to the re-ranked list. Diversity score is updated in each iteration and takes into account both the relevance score of the document and it’s distances from already chosen documents. A document that is not only relevant but also far away from previous ones will get a high diversity score. See [9] for more details. 4.2
The SC-1 and SC-2 Algorithms
The SC-1 and SC-2 algorithms [12] are built on the notion of spatial coverage (SC), or location coverage as referred in Section 3. The two have the same underlying statistical model, but differ in how spatial coverage is approximated.The underlying model is a greedy iterative algorithm. In each iteration, it chooses the document that ranks highest according to the sum of its semantic relevance rank and spatial diversity rank. The former is simply generated by a standard search engine, while the latter is measured by how well the location of a new document is covered by those already in the re-ranked list. If a document is from a location that is not covered or only slightly covered by previous documents, it will get a high spatial diversity rank, because the user is likely to have higher interest in such locations than those already covered. See [12] for more details. Table 1. 22 Geographical Topics ID Query 0 church with more than two towers 1 straight road in the USA 2 destinations in Venezuela 3 black and white photos of Russia 4 exterior view of school building 5 night shots of cathedrals 6 lighthouse at the sea 7 sport stadium outside Australia 8 exterior view of sport stadium 9 accommodation provided by host families 10 snowcapped building in Europe 11 cathedral in Ecuador 12 group picture on a beach 13 tourist destinations in bad weather 14 winter landscape in South America 15 sunset over water 16 mountains on mainland Australia 17 indoor photos of a church or cathedral 18 views of walls with unsymmetric stones 19 famous television (and telecommunication) towers 20 drawings in Peruvian deserts 21 seals near water
5
Experiments
5.1
Data-set
We have chosen the image collection that has been used in the ImageCLEFPhoto 2008 campaign [2], for our experiment. The data-set, known as the IAPR TC12 image collection [8], is comprised of 20,000 images. Each image comes with a XML meta-data file which contains annotations describing the image content and the location name where the image was taken. Gazetteers were used for relating a location name to a pair of latitude and longitude, following the procedure described in [9] and [12]. Table 2. Cluster Recall at Different Ranks (∗ p < 0.05,∗∗ p < 0.01)
CR@5 CR@10 CR@20 CR@30
5.2
Std 0.172 0.268 0.417 0.480
GM 0.274∗ 0.395∗∗ 0.496∗ 0.523
SC-1 0.262∗ 0.345∗ 0.469 0.533∗∗
Table 3. Precision at Different Ranks (∗ p < 0.05,∗∗ p < 0.01)
SC-2 0.288∗∗ 0.404∗∗ 0.486∗∗ 0.538∗∗
P@5 P@10 P@20 P@30
Std 0.482 0.496 0.468 0.452
GM 0.427 0.423∗ 0.418 0.391
SC-1 0.436 0.409∗ 0.414 0.408
SC-2 0.446 0.450 0.396 0.394
Results on Precision and S-recall
Firstly, we use Lucene as the full text search engine to generate the document list for each of the 22 topics listed in Table 1. Secondly, the three diversity algorithms are applied to re-rank each document list. Finally, average precision and S-recall over the 22 topics are calculated for each algorithm, using the “golden standard” assessment file [2]. The number of top documents used for re-ranking is varied, from 20 to 100 with an increment of 20. Precision and cluster recall (S-recall), as used in ImageCLEFPhoto 2008, have been calculated. Precision calculates the percentage of relevant documents in the top N , while S-recall is calculated as in Equation 1. Due to limited space, only the results (averaged over the 22 topics) from re-ranking the top 60 documents are presented (Table 2 and 3). As can be seen, all the three spatial diversity algorithms achieved better diversity than the standard search, but slightly worse precision. Significance test using paired t-test has also been conducted to see if the the difference is significant. As shown in Table 2 and 3, overall the improvement in diversity is significant but the decrease in precision is not. Among the three algorithms, SC-2 seems to achieve the best performance. 5.3
User Preference Study on Spatial Diversity
In order to investigate if users actually favor spatially diversified results over standard results, we have run a user preference study in MTurk. The idea is
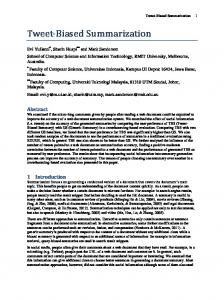
Fig. 1. One example of preference judgement unit (PJU) in spatial diversity user study. See the HIT description for more details.
simple - by showing two maps (one is the standard and the other is the spatially diversified) in which search results are depicted, we ask the workers to decide which one they prefer based on the corresponding query. Specifically, we compared each of the three spatial diversity algorithms described in Section 4 with the standard search. For each of the 22 topics, we generated two maps. One map was plotted with the top 10 results from the standard search, and the other was plotted with the top 10 results from one of the spatial diversity algorithms. Search results were plotted on the locations where the photos were taken. It should be noted that documents were represented as red circles rather than the actual images. There are several reasons for such a choice: 1) to make the task as simple as possible for the workers; 2) to focus on only the spatial dimension, i.e. spatial diversity and spatial relevance. By placing the two maps side by side and showing the query based on which the maps were generated, we gave the worker three options to choose from: 1) the left map is better; 2) no preference/similar; 3) the right map is better. We call this a preference judgement unit (PJU). Figure 1 shows the PJU for the query “exterior view of school building”. The left map is generated by SC-2, and the right one is from standard search (This information is of course hidden from the workers). For quality control purpose, we used a combination of the methods mentioned in Section 2.3. Firstly, we required the workers to have a minimal approval rate of 90% if they want to work on our HITs. Secondly, we randomly inserted some “trap” PJUs into each HIT. A “trap” is a manually constructed PJU in which the preference of two maps is so obvious that every genuine worker should be able to tell easily and correctly. For example, two maps are exactly the same, or one is apparently better than the other (e.g. one shows 10 results and the other shows only 1 result). Each HIT is comprised of 10 PJUs (or topics), including 7 or 8 real PJUs, and 3 or 2 trap ones. In other words, we divided the 22 topics into 3 groups, with 7, 7 and 8 topics respectively, and then added 2 or 3 trap PJUs to
each group so that the total number of PJU per group is 10. Every comparison between one spatial diversity algorithm and the standard search generated 3 HITs, resulting in 9 HITs in total. In MTurk, one worker can only work on the same HIT once, so no duplicate work is allowed. We have requested 50 workers for each HIT, meaning that each topic is set to be judged by 50 different workers. Therefore, the total number of HITs submitted to MTurk is 450. Each HIT was paid $0.02, and the task was available for 7 days. However, by the time when the pre-set deadline is reached, only 301 HITs (about 2/3 of the total requested) have been finished. As for quality control, we only use submissions from workers who have correctly answered all the trap PJUs of a HIT. If a worker gave wrong answer to any of the trap PJUs, his work on this HIT will be filtered out. As a result, 186 HITs (about 20 judgements per topic) were accepted and used for further analysis. It is also worth mentioning that in order to conduct a fair experiment, we have randomized not only the order of topics, but also the order of the two maps in each PJU. Therefore, the position of traps in each HIT, and the order of the standard search map and the spatially diversified map, are all unpredictable. The following two paragraphs are the descriptions we provided in each HIT about what the workers are expected to do. As can be seen, in order to void biasing the workers’ judgement, we did not give any mention of the notion or the word “diversity” in the task description. INTRODUCTION This is a searching results preference survey. There are 10 queries. Each query is a short sentence issued by a user who wants to find the relevant photos via an image search engine. The results (i.e. photos) are returned to the user as small red circles on a geographical map and on the locations where the photos were taken. Inside every circle, a number (from 1 to 10) is shown to indicate how many photos are included the circle. Photos that belong to the same circle are taken from the same or very close geographical locations. For every query, two different maps (the left map and the right map) are shown, each containing a maximum of 10 results (photos). TASK Now, imagine you were the user who issued the query, as the searching result, which map do you prefer? the left one, the right one, or there’s no apparent difference? HIT Description Shown to the Worker
5.4
Results on User Preference Study
A three level preference scheme has been applied. For each topic, if the diversified map is favored, a preference value of 1 is assigned to this topic. If the standard one is favored, -1 is assigned. If the worker decided there’s no difference between the two, 0 is assigned. All the workers’ choices on each topic is averaged to give an overall preference value, which has been shown in Figure 2. Error bars indicate the standard error of mean.
User Preference Study on Spatial Diversity 1 0.8 0.6
Preference
0.4 0.2 GM 0
SC-1 14
17
8
13
1
12
0
19
21
2
3
4
7
9
5
6
18
20
15
10
11
16 SC-2
-0.2 -0.4 -0.6 -0.8 -1 Topics
Fig. 2. The results of user preference study on spatial diversity. Topics ordered by the preference value of the GM method. Preference value equals to 1 if the users prefer spatially diversified results, -1 if they prefer the standard results.
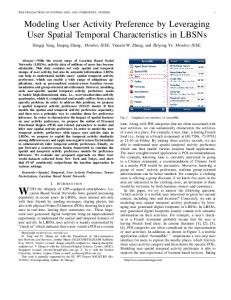
As can be seen, users have shown a strong preference to spatially diversified results on most of the topics (17 out of the 22). The rest of the topics can be categorized into three groups: 1. Diversity algorithms failed to achieve apparent improvement in diversity. Topics fall into this kind are topic 10 and 15. As shown in Figure 2, there is no apparent preference (either to the standard or to the diverse result) on these two topics. Manual inspection implies one reason is that the standard one is diverse already. 2. Diversity algorithms caused apparent damage to precision. Topics fall into this kind is topic 16. Users exhibited high preference to results with higher precision. For topic 16, “mountains on mainland Australia”, the diversified map did not achieve higher diversity but has one less document in “mainland Australia” than the standard one (spatial relevance). As a result, users favored the standard results. This however is more of a problem of the search engine, because it did not manage to restrict the returned documents to be actually in “mainland Australia”. 3. Diversity algorithms performed differently. Some improved the standard result without apparent reduction in precision, but some compromised precision too much. Topics fall into this kind are topic 11 and 19. Intuitively, topics with higher diversity scores (i.e. cluster recall) will receive stronger user preferences. In order to verify this, we have chosen to use scatter plots. The horizontal axis is the improvement (as in absolute value of difference) in cluster recall by each diversity algorithm over the standard results. The vertical axis is the average preference value of all workers on a particular topic. Each point represents a topic. In Figure 3(a), we have depicted all the topics, but the correlation is not clear. This is due to the fact that our user study is only concerned with spatial diversity, without any relevance judgement. Therefore, the workers probably assumed all documents (shown as circles) are relevant. As a result, diversified results with a very low precision (e.g. 0) will still get a high preference as long as it is “diverse” enough to the worker. We have then filtered
out topics with a precision at rank 10 (denoted as P@10) that is less than 0.5. The new scatter plot is shown in Figure 3(b). As can be seen, the correlation becomes more clear. In general, the more improvement in diversity, the higher preference score it achieves. Figure 3(c) and 3(d) used precision threshold value of 0.7 and 0.9. It can probably be claimed that cluster recall is a reasonable metric for evaluating users’ preference in diversity.
Topics with P@10>=0.5
All Topics 1.2
1.2
1
1 0.8
0.6 0.4 0.2 0 -0.3
-0.2
-0.1
-0.2
0
0.1
0.2
0.3
0.4
0.5
0.6
0.7
-0.4
User Preference
User Preference
0.8
0.6 0.4 0.2 0 -0.2
-0.8
0.8 GM SC-1 SC-2
(b) P@10>=0.5 Topics with P@10>=0.9
Topics with P@10>=0.7 1.2
1.2
1
1
0.6 0.4 0.2 0 0.2
0.3
0.4
0.5
0.6
0.7 GM SC-1 SC-3
-0.4 -0.6
User Preference
0.8 User Preference
0.6
Increase in Cluster Recall
(a) All Topics
0.1
0.4
-0.6
Increase in Cluster Recall
0
0.2
-0.4
-1
-0.2
0 -0.2
GM SC-1 SC-2
-0.6
GM SC-1 SC-2
0.8 0.6 0.4 0.2 0 0
0.2
0.4
0.6
0.8
-0.2 -0.4
Increase in Cluster Recall
(c) P@10>=0.7
Increase in Cluster Recall
(d) P@10>=0.9
Fig. 3. Scatter Plot of User Preference vs. Increase in Cluster Recall
To compare the three diversity algorithms, we have also generated a chart of the average preference value for each algorithm at different cut-off precision thresholds. The horizontal axis is the cut-off precision value. For example, at a threshold of 0.6, topics with P@10 less than 0.6 are filtered out. The vertical axis is the average preference of the remaining topics (e.g. P@10>=0.6) for a particular algorithm. Overall, SC-1 gained the least average preference. GM and SC-2, however, are comparable. SC-2 is better in the middle range, but worse on both ends. When the threshold is reduced from 1 to 0.7, the average preference of GM decreased rapidly. This is probably because GM brought more spatially irrelevant documents in, which is not surprise considering that GM works by choosing documents as far away as possible from existing ones. It can probably be concluded that GM tends to produce more spatially diverse results than SC2, but risk bringing in more spatially irrelevant ones. SC-2, on the other hand, tends to perform more stably over all topics. However, another reason for the
0.8
Average Preference
0.7 0.6 0.5 0.4 0.3 0.2
GM SC-1 SC-2
0.1 0 0
0.1
0.2
0.3
0.4
0.5
0.6
0.7
0.8
0.9
1
Precision Threshold
Fig. 4. Comparison of average preference at different cut-off precision thresholds.
dramatic changes at high thresholds might be due to the small number of topics with a high precision. To sum up, our study via MTurk has shown that users do have apparent preference to spatially diversified results. Although 5 of the topics exhibited different behaviours, they all seem to be caused by either no apparent diversity improvement or an apparent precision decrease. Given that the precision can be maintained, we believe spatially diversified results will meet users’ needs better.
6
Conclusions and Future Work
Three spatial diversity algorithms have been utilized to re-rank the document list generated by a standard search engine. According to evaluations based on precision, cluster recall and significance test, the three algorithms seem to be able to improve diversity significantly while keeping an insignificant decrease in precision. Moreover, a user preference study has been conducted in MTurk to investigate whether users do favor spatially diversified results. Statistics calculated from the user study submissions, which had been filtered by several quality control methods, showed users’ strong preference to spatial diversity. On the other hand, the correlation experiment on user preference and cluster recall showed that there is a positive correlation between them. The higher the cluster recall score is, the stronger preference exhibited by users. We plan to do the experiments on another data-set with more documents and topics. In addition, using other diversity metrics and investigating the correlation to user preference will be interesting.
7
Acknowledgements
Work undertaken in this paper is supported by the EU-funded Tripod project (Contract No. 045335).
References 1. Omar Alonso, Daniel E. Rose, and Benjamin Stewart. Crowdsourcing for relevance evaluation. SIGIR Forum, 42(2):9–15, 2008. 2. T. Arni, J. Tang, M. Sanderson, and P. Clough. Creating a test collection to evaluate diversity in image retrieval. In Proceedings of the Workshop on Beyond Binary Relevance: Preferences, Diversity, and Set-Level Judgments, held at SIGIR, 2008. 3. Jaime G. Carbonell and Jade Goldstein. The use of mmr, diversity-based reranking for reordering documents and producing summaries. In SIGIR ’98, pages 335–336, Melbourne, Australia, 1998. ACM. 4. Charles L.A. Clarke, Maheedhar Kolla, Gordon V. Cormack, Olga Vechtomova, Azin Ashkan, Stefan B¨ uttcher, and Ian MacKinnon. Novelty and diversity in information retrieval evaluation. In SIGIR ’08: Proceedings of the 31st annual international ACM SIGIR conference on Research and development in information retrieval, pages 659–666, Singapore, 2008. ACM. 5. Paul Clough, Hideo Joho, and Ross Purves. Judging the spatial relevance of documents for gir. In ECIR, pages 548–552, 2006. 6. W. Dakka and P. G. Ipeirotis. Automatic extraction of useful facet hierarchies from text databases. In IEEE 24th International Conference on Data Engineering (ICDE 2008), pages 466–475. IEEE, April 2008. 7. Thomas Deselaers, Tobias Gass, Philippe Dreuw, and Hermann Ney. Jointly optimising relevance and diversity in image retrieval. In ACM International Conference on Image and Video Retrieval 2009 (CIVR 2009), Santorini, Greece, 08/07/2009 2009. ACM, ACM. 8. M. Grubinger, P. Clough, H. Mller, and T. Deselaers. The iapr tc-12 benchmark: A new evaluation resource for visual information systems. In International Workshop OntoImage’2006 Language Resources for Content-Based Image Retrieval, pages 13–23, held in conjunction with LREC’06 Genoa, Italy, 2006. 9. Monica Lestari Paramita, Jiayu Tang, and Mark Sanderson. Generic and spatial approaches to image search results diversification. In 31st European Conference on Information Retrieval (ECIR), pages 603–610, 2009. 10. Stephen Robertson. On gmap: and other transformations. In Conference on Information and Knowledge Management, pages 78–83, Virginia, USA, 2006. 11. Alexander Sorokin and David Forsyth. Utility data annotation with amazon mechanical turk. In Proceedings of the First IEEE Workshop on Internet Vision at CVPR 08, pages 1–8, 2008. 12. Jiayu Tang and Mark Sanderson. The tripod project technical report - modeling diversity in spatial information retrieval using spatial coverage. Technical report, University of Sheffield, 2009. 13. M. van Kreveld, I. Reinbacher, A. Arampatzis, and R. van Zwol. Distributed ranking methods for geographic information retrieval. In Proceedings of the 20th European Workshop on Computational Geometry, pages 231–243, 2004. 14. Cheng Xiang Zhai, William W. Cohen, and John Lafferty. Beyond independent relevance: Methods and evaluation metrics for subtopic retrieval. In SIGIR ’06, pages 10 – 17, Toronto, Canada, 2003. 15. Benyu Zhang, Hua Li, Yi Liu, Lei Ji, Wensi Xi, Weiguo Fan, Zheng Chen, and Wei-Ying Ma. Improving web search results using affinity graph. In SIGIR ’05, pages 504–511, New York, NY, USA, 2005. ACM.