International Journal of
Environmental Research and Public Health Article
Evaluation of a Pilot Implementation to Integrate Alcohol-Related Care within Primary Care Jennifer F. Bobb 1, *,† , Amy K. Lee 1, *,† , Gwen T. Lapham 1 , Malia Oliver 1 , Evette Ludman 1 , Carol Achtmeyer 1,2 , Rebecca Parrish 3 , Ryan M. Caldeiro 3 , Paula Lozano 1 , Julie E. Richards 1 and Katharine A. Bradley 1 1
2 3
* †
Kaiser Permanente Washington Health Research Institute, 1730 Minor Ave, Ste 1600, Seattle, WA 98101, USA;
[email protected] (G.T.L.);
[email protected] (M.O.);
[email protected] (E.L.);
[email protected] (C.A.);
[email protected] (P.L.);
[email protected] (J.E.R.);
[email protected] (K.A.B.) Center of Excellence in Substance Abuse Treatment and Education, VA Puget Sound Health Care System 1660 S. Columbian Way, Seattle, WA 98108, USA Kaiser Permanente Washington, 1200 SW 27th St., Renton, WA 98057, USA;
[email protected] (R.P.);
[email protected] (R.M.C.) Correspondence:
[email protected] (J.F.B.);
[email protected] (A.K.L.); Tel.: +1-206-287-2190 (J.F.B.) Contributed equally to the conceptualization and writing of this manuscript.
Received: 19 July 2017; Accepted: 30 August 2017; Published: 8 September 2017
Abstract: Alcohol use is a major cause of disability and death worldwide. To improve prevention and treatment addressing unhealthy alcohol use, experts recommend that alcohol-related care be integrated into primary care (PC). However, few healthcare systems do so. To address this gap, implementation researchers and clinical leaders at Kaiser Permanente Washington partnered to design a high-quality Program of Sustained Patient-centered Alcohol-related Care (SPARC). Here, we describe the SPARC pilot implementation, evaluate its effectiveness within three large pilot sites, and describe the qualitative findings on barriers and facilitators. Across the three sites (N = 74,225 PC patients), alcohol screening increased from 8.9% of patients pre-implementation to 62% post-implementation (p < 0.0001), with a corresponding increase in assessment for alcohol use disorders (AUD) from 1.2 to 75 patients per 10,000 seen (p < 0.0001). Increases were sustained over a year later, with screening at 84.5% and an assessment rate of 81 patients per 10,000 seen across all sites. In addition, there was a 50% increase in the number of new AUD diagnoses (p = 0.0002), and a non-statistically significant 54% increase in treatment within 14 days of new diagnoses (p = 0.083). The pilot informed an ongoing stepped-wedge trial in the remaining 22 PC sites. Keywords: alcohol drinking; prevention; alcohol use disorders; primary care
1. Introduction Alcohol use accounts for 3.6% of mortality and 4.6% of disability worldwide [1]. Unhealthy alcohol use includes a spectrum from drinking above recommended limits to alcohol use disorders (AUD) [2], and can result in multiple severe health problems, including trauma, cirrhosis, cancer, and poor management of other chronic diseases [1,3,4]. Several options for evidence-based prevention and treatment are available to address unhealthy alcohol use. Routine alcohol screening and brief alcohol counseling (“brief intervention”) for patients who screen positive for unhealthy alcohol use decrease drinking and have been found to be cost effective [5–12]. For AUD treatment, evidence and guidelines support medications and counseling (e.g., motivational enhancement therapy, cognitive behavioral therapy), and specialty alcohol treatment [13–23]. However, most patients do not receive alcohol screening and brief intervention [24] because sustained implementation has been challenging. Further, most patients Int. J. Environ. Res. Public Health 2017, 14, 1030; doi:10.3390/ijerph14091030
www.mdpi.com/journal/ijerph
Int. J. Environ. Res. Public Health 2017, 14, 1030
2 of 18
with AUD never receive treatment either because AUDs remain unrecognized or because they do not accept referral [25], and they are less likely to receive appropriate treatment than patients with any other common chronic disease [26]. To address this gap, experts recommend that alcohol-related care be integrated into primary care (PC) similar to care for other common chronic conditions, such as diabetes and depression [27–30]. Yet, despite several exceptions [31–34], few healthcare systems have successfully implemented alcohol screening: screening rates are low (2–26%) and poorly maintained over time [35]. Providing high-quality, population-based alcohol-related medical care is challenging due to several barriers, including stigma, a lack of training, not having alcohol use on the agenda of prevention topics in PC, not seeing AUDs as within the scope of conditions treatable within PC, and the perception of a single treatment option for AUD in the U.S.; namely, abstinence-oriented, group-based rehabilitation based on the 12 steps of Alcoholics Anonymous (AA) [36–39]. The Program of Sustained Patient-centered Alcohol-related Care (SPARC) was designed to address these barriers. Implementation researchers and clinical leaders at Kaiser Permanente (KP) Washington partnered to design the SPARC program in 2013 in response to a call for research proposals focused on the sustainable implementation of evidence-based practices from the U.S. Agency for Healthcare Quality and Research (AHRQ). The SPARC implementation strategy was built on the successes and limitations learned from implementing alcohol screening and brief intervention across 21 Veterans Affairs networks in over 900 clinical sites nationwide [31,40]. Despite widespread implementation, there were marked gaps in the quality of alcohol screening [41], and documented brief interventions increased more than patient-reported alcohol-related counseling [42,43]. SPARC applied state-of-the-art quality improvement approaches with a participatory design to increase provider and staff engagement, used patient self-report on paper screens to increase the quality of screening, and focused on increasing provider comfort in providing alcohol-related care by explicitly addressing stigma, a critical barrier to evidence-based alcohol-related care. The partnership between researchers and clinical leaders began in 2012, when health system leaders invited researchers to conduct an evaluation of the current state of addictions care. The evaluation identified important gaps in the access to and coordination of care for alcohol and other substance use disorders, and increased the motivation of health system leaders to address the gaps. The resulting SPARC program aimed to implement sustained, high-quality alcohol-related care in all 25 PC sites in KP Washington. After the proposal was funded by AHRQ, KP Washington leaders requested that the grant be used to support the integration of behavioral health care more broadly into PC. Behavioral Health Integration (BHI) included the screening, assessment, diagnosis, treatment, and monitoring of depression symptoms [44–46], unhealthy alcohol use [47], cannabis use, [48], illicit drug use, and/or non-medical use of prescription medication [49]. A pilot in three large PC sites (SPARC pilot) was conducted before proceeding to conduct a full stepped-wedge pragmatic trial in the remaining 22 sites (SPARC trial). In this paper, we provide an overview of the SPARC pilot and the implementation strategies used to integrate alcohol-related care within PC. We quantitatively evaluate the effectiveness of the SPARC implementation by comparing the outcomes before versus after implementation within the three pilot sites. We hypothesized that the introduction of SPARC would be associated with increased rates of screening for unhealthy alcohol use, the assessment for AUD, and the new diagnosis and treatment of AUD. Additionally, we qualitatively describe barriers and facilitators to providing alcohol-related care that were encountered during the SPARC pilot, which led to changes in SPARC implementation strategies for the subsequent full pragmatic trial. 2. Materials and Methods 2.1. Setting The SPARC pilot took place at three PC sites in KP Washington, an integrated health care delivery system and insurance plan in Washington State (formerly Group Health Cooperative in Washington
Int. J. Environ. Res. Public Health 2017, 14, 1030
3 of 18
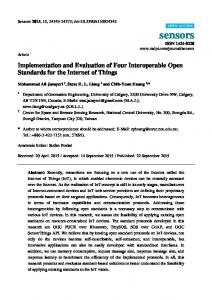
State, USA). These three sites were selected by health system leaders due to site leaders’ receptivity to Int. J. Environ.health Res. Public Health 2017,and 14, 1030 18 behavioral integration geographic representation in western Washington. They were3 of large outpatient medical centers, with two to four separate PC clinics at each site, located in different wings specialty mental health clinics site.an Our studycare population of 1alland patients 18 or older) or floors of the building. Site 1onhad urgent clinic onconsisted site. Sites 2 had(ages specialty mental who had an in-person visit to a PC provider in one of the three pilot sites during the study health clinics on site. Our study population consisted of all patients (ages 18 or older) pilot who had an period. The pilot study period (see timeline in Figure 1) was from 3 October 2014, 5 months prior to in-person visit to a PC provider in one of the three pilot sites during the pilot study period. The pilot the official launch of SPARC the first site,from until3completion of pilot activities onto 1 April 2016, when study period (see timeline in at Figure 1) was October 2014, 5 months prior the official launch the roll-out of the SPARC program began in a pragmatic stepped-wedge trial in the other 22 KP of SPARC at the first site, until completion of pilot activities on 1 April 2016, when the roll-out of the Washington PC sites. SPARC program began in a pragmatic stepped-wedge trial in the other 22 KP Washington PC sites.
Figure 1. Pre- and post-implementation post-implementationperiods periodsfor forSites Sites1–3. 1–3.
2.2.The The SPARC SPARCProgram Program 2.2. SPARCincluded includedevidence-based evidence-based alcohol-related prevention [5,6] SPARC [5,6]and andtreatment treatment[13–23]. [13–23].The Thetarget target was to screen 80% of PC patients annually for unhealthy alcohol use with the validated Alcohol Use was to screen 80% of PC patients annually for unhealthy alcohol use with the validated Alcohol Disorders Identification Test–Consumption questionnaire (AUDIT-C), offer brief to 80%to Use Disorders Identification Test–Consumption questionnaire (AUDIT-C), offer intervention brief intervention of patients who screened positive, including recommendations that patients drink below 80% of patients who screened positive, including recommendations that patients drink belowthe the recommended U.S. U.S. limits limits [50], [50], and and provide provide feedback recommended feedback linking linking unhealthy unhealthyalcohol alcoholuse usetotospecific specifichealth health conditions of of interest interest to insomnia, and breast cancer prevention) [51].[51]. In conditions tothe thepatient patient(e.g., (e.g.,hypertension, hypertension, insomnia, and breast cancer prevention) addition, components of the SPARC program aimed at improving the quality of care for AUD, which In addition, components of the SPARC program aimed at improving the quality of care for AUD, included assessing 80% of patients with high-risk unhealthyunhealthy alcohol use for Diagnostic and Statistical which included assessing 80% of patients with high-risk alcohol use for Diagnostic and Manual of Mental Disorders (DSM-5) AUD symptoms, and the diagnosis and treatment of “new” AUD Statistical Manual of Mental Disorders (DSM-5) AUD symptoms, and the diagnosis and treatment of (not documented in the prior year) Targets at 80% to allow the autonomy “new” AUD (not documented in the[52]. prior year) were [52]. set Targets were set at clinicians 80% to allow clinicians to the prioritize clinical activities in a particular visit and encourage appropriate care when other autonomy to prioritize clinical activities in a particular visit and encourage appropriate careissues whenwere other more important screeningor was not appropriate cognitively impaired patients). issues were moreorimportant screening was not(e.g., appropriate (e.g., cognitively impaired patients). 2.3.SPARC SPARCImplementation Implementation Strategies Strategies 2.3. The approach approach used used to to implement The implement SPARC SPARC addressed addressed several several of of the thebarriers barrierstotohigh-quality high-quality alcohol-related care mentioned above by using three main strategies (Table 1): (1) enabling alcohol-related care mentioned above by using three main strategies (Table 1): (1) enablingPC PC teamstotooffer offer high-quality alcohol-related care by addressing providing training, teams high-quality alcohol-related care by addressing stigma, stigma, providing training, designing designing and implementing workflows to care, deliver the care,buy-in, promoting buy-in, andother addressing and implementing workflows to deliver the promoting and addressing barriers; other barriers; (2) supporting PC teams through electronic health record (EHR) decision support, (2) supporting PC teams through electronic health record (EHR) decision support, including prompts including prompts and EHR tools toofcue theintervention delivery of brief and assessment of and other EHR tools to other cue the delivery brief and intervention assessment of AUD symptoms; AUD symptoms; and (3) systematic performance monitoring of screening and assessment rates and (3) systematic performance monitoring of screening and assessment rates with active feedback with active feedback to clinic leaders and teams. SPARC was implemented with BHI more broadly; to clinic leaders and teams. SPARC was implemented with BHI more broadly; the study supported the study supported the development of EHR tools and performance measures for all elements of the development of EHR tools and performance measures for all elements of BHI. Details are shown BHI. Details are shown in Table 1. in Table 1.
Int. J. Environ. Res. Public Health 2017, 14, 1030
4 of 18
Table 1. The Program of Sustained Patient-centered Alcohol-related Care (SPARC): Components of the Implementation Strategy. Strategy #1: Enabling Primary Care (PC) Teams to Offer High-Quality Alcohol-Related Care Components: • Training of PC teams. Recruited PC provider champions from each site, and trained them with social workers (8 h).
•
• •
•
•
•
Front line design. A 3-day design event led by a KP Washington Lean process improvement consultant involved front line staff—an interdisciplinary local implementation team of PC provider, medical assistant, nurse, and social worker champions—in designing implementation and workflows, with iterative improvement of workflows in days 2 and 3 while piloting in real time with patients. At the end of the design events, local implementation teams, local site leaders, health system leadership, and researchers discussed plans for the next steps of implementation, including needed training and launch dates. Support from practice coaches. An external practice coach worked with PC teams to support implementation and quality improvement. Learning sessions. Every other week, PC provider champions participated in learning sessions: teleconferences with the external practice coach and health system and research experts on screening and brief intervention, alcohol use disorders (AUD) treatment, shared decision-making, and motivational interviewing (MI). Learning sessions encouraged champions to share stories and problem-solve challenges, and supported provider-to-provider exchanges. For patients with AUDIT-C scores of 3–6 (women) or 4–6 (men), brief interventions were framed as brief preventive advice with the use of an alcohol handout (see Supplemental Materials), “for all patients who drink regularly”, where PC providers would review recommended drinking limits, link alcohol to health concerns, and elicit patient response. For patients with AUDIT-C scores of 7–12, PC providers were asked to introduce the patient to an integrated behavioral health clinician (described below) for brief alcohol counseling guided by principles of shared decision-making and results from the AUD Symptom Checklist (described in Section 2.5.2). Addressing stigma. Patient-focused materials, which included a patient handout and video [53] *, were designed to shape staff and patient attitudes by reframing drinking as a health issue and to decrease stigma and educate staff and patients on the spectrum of unhealthy alcohol use, recommended limits, and evidence-based approaches to treating AUD. Focus on shared decision-making. Management of AUD was reframed as shared decision-making, which is a patient-centered approach familiar to PC teams. PC providers and integrated behavioral health clinicians were trained to engage patients in shared decision-making, which included assessing patients’ medical conditions; eliciting patient concerns, goals, values, and perceptions; offering information on options (i.e., counseling, medications, and specialty alcohol treatment); and working with patients to support them in choosing their goals and treatment(s). Integrated behavioral health clinicians. Social workers were trained and supported in the engagement and management of patients with AUD and other substance use disorders, including assessment, MI skills, shared decision-making, and referral to treatment as appropriate [54] *.
Strategy #2: Supporting PC Teams through Electronic Health Record (EHR) Decision Support Components: • EHR prompts for screening. Alerted medical assistants when a patient had not had behavioral health screening within the past year (7-item screening tool, including AUDIT-C). • EHR prompts for brief intervention and AUD assessment. Based on AUDIT-C score, the EHR triggered visual prompts for medical assistants to give providers an alcohol handout and/or to ask the patient to complete a DSM-5 AUD Symptom Checklist (paper 11-item questionnaire). • EHR prompts for missed AUD assessment. If AUD assessment was missed at the prior visit, prompts alerted medical assistants to give patients a DSM-5 AUD Symptom Checklist at their next in-person visit. • Decision support for AUD diagnosis. EHR auto-totaled DSM-5 AUD symptoms and gave interpretive scores (none, mild, moderate, severe) to guide providers’ next steps and help facilitate AUD diagnosis. • EHR prompts to initiate AUD treatment (piloted at Site 3 with three providers). If providers diagnose patients with new AUD (defined in Section 2.5.3 using codes used for U.S. national health plan quality measures) [52], providers were alerted to schedule patients to come back for a follow up visit to initiate care. • EHR prompts AUD monitoring (piloted at two sites for several months). EHR alerts medical assistants to give patients with new AUD a monitoring tool that included the AUDIT-C and prompted providers to address AUD at visit. Strategy #3: Systematic Monitoring and Feedback of Performance Measures Including Alcohol Screening and AUD Assessment Rates Components: • Performance monitoring and quality improvement. Local implementation teams met with practice coaches and reviewed data at Plan-Do-Check-Adjust meetings based on a cadence determined by site leadership: Site 1 met monthly, Site 2 met monthly for 5 months and then every other week, and Site 3 had weekly meetings, dropping to every other week and then monthly meetings as processes stabilized and targets were met. • Quality improvement meetings with leaders. Monthly Plan-Do-Check-Adjust meetings included local implementation teams, practice coaches, local and regional leadership, and behavioral health leaders, and researchers.
* indicates adapted strategies based on early formative evaluation during pilot or additional grant funding (for video).
Int. J. Environ. Res. Public Health 2017, 14, 1030
5 of 18
2.4. Planned Timeline of Implementation Although the three pilot sites originally were expected to implement SPARC at the same time, the timeline was renegotiated due to health system reorganization and leadership transitions, resulting in three separate start dates (Site 1: 3 March 2015; Site 2: 4 August 2015; and Site 3: 17 September 2015). These negotiated start dates were used in the quantitative analyses (described below) as the “official” start dates of the SPARC implementation at each site (see Figure 1). Prior to the implementation start date, each pilot site participated in a 3-day design event to develop, pilot, and refine the workflow for the SPARC trial. The design events occurred within a week before the official start dates at all three pilot sites. 2.5. Quantitative Metrics We evaluated whether the implementation of SPARC led to changes in the rates of: screening for unhealthy alcohol use; assessment with the use of an AUD Symptom Checklist created for this project by clinical leaders; and documentation of new diagnoses and treatment of AUD. All metrics were defined using routinely collected EHR data. Although brief intervention for unhealthy alcohol use was an important aspect of the SPARC pilot, we did not evaluate whether the implementation successfully led to changes in documented brief intervention in the pilot. Clinical leaders decided to encourage brief interventions without specific requirements or monitoring of documentation to focus clinicians on getting comfortable with brief counseling due to concerns about possible “over-documentation” in previous implementation efforts [42]. For each PC site, we identified whether patients were screened, assessed, newly diagnosed with AUD, and treated for new AUD during the pre- and post-implementation pilot periods, using each sites’ negotiated implementation start date. Measures were defined as follows. 2.5.1. Alcohol Screening Prior to the implementation of SPARC, there were several different mechanisms by which a PC patient might have been screened in PC (e.g., through a well-visit questionnaire with the 3-item AUDIT-C or via ad hoc screening when a PC provider was concerned). In addition, the AUDIT-C was a part of a routine questionnaire in behavioral health clinics as well as in urgent care for patients presenting with behavioral health concerns. After implementation of SPARC in the context of BHI, the AUDIT-C could additionally be completed as part of a 7-item behavioral health paper questionnaire filled out by the patient and entered into the EHR by the medical assistant (including also a 2-item depression screen [55] and two items for screening for cannabis and drug use [49]). A screen was positive for unhealthy alcohol use if the AUDIT-C was ≥ 3 for women and ≥ 4 for men, and AUDIT-C scores ≥ 7 indicated high-risk unhealthy alcohol use [56–58] that required assessment with the AUD Symptom Checklist. For each PC visit, we identified whether the patient was screened for unhealthy alcohol use on the day of the visit or within the prior year to reflect the goal that patients would be screened annually. We note that under this metric, if a patient was screened in the pre-implementation period, then that patient is considered as having been compliant for annual screening at any subsequent visit up to one year following the screening event (including visits in the post-implementation period). Because the same screen was used in urgent care and the behavioral health clinic, PC patients were not re-screened if they had already been screened elsewhere. 2.5.2. Assessment for DSM-5 AUD Symptoms As part of SPARC, an 11-item AUD Symptom Checklist, based on DSM-5 AUD [59], was developed for patients to fill out and medical assistants to enter into the EHR. At each PC visit, we first identified the patient’s most recent alcohol screen, either from the day of the visit or from the prior year (if done). An assessment was considered needed if the screening score indicated
Int. J. Environ. Res. Public Health 2017, 14, 1030
6 of 18
high-risk unhealthy alcohol use indicating increased risk for AUD (AUDIT-C score ≥ 7 points) [56–58]. Among patients needing an assessment, we determined whether the patient was assessed for AUD, indicated by EHR documentation of the 11-item Symptom Checklist, within a year prior to the high-risk AUDIT-C or within the time from the high-risk screen up to and including the visit date. As with the screening metric, the assessment could occur anywhere within the health system (not solely within PC). 2.5.3. New AUD Diagnosis and Treatment At each PC visit, we identified whether the patient had a new AUD diagnosis on the date of the visit. A new AUD diagnosis was defined in this study as an AUD diagnosis without any prior AUD diagnosis within the past year, using International Classification of Disease (ICD) codes from the U.S. National Committee for Quality Assurance’s (NCQA’s) Healthcare Effectiveness Data and Information Set (HEDIS) measure for the Initiation and Engagement of Alcohol and Other Drug Dependence Treatment [52]. If the patient had a new AUD diagnosis on that visit, we identified whether the patient was treated for AUD or other substance use disorders within the following 14 days based on data from the EHR or claims for outside care (but not including AA). Treatment was defined as a follow up visit for AUD based on International Classification of Diseases (ICD) codes, again using the HEDIS definition of initiation of AUD treatment [52]. Of note, this pilot study did not obtain data on the exact care provided, which could have ranged from PC counseling or medications for AUDs from PC or mental health clinics, to specialty addictions treatment outside the health system (provided by contracted providers in the community). Our primary time window of interest was 14 days, consistent with NCQA’s HEDIS measure for treatment initiation [52], but we also considered 30-day and 90-day windows to assess whether SPARC implementation increased the treatment of new AUDs over a longer timeframe. 2.6. Statistical Analysis 2.6.1. Descriptive Analyses Only some of the PC clinics within each site implemented Behavioral Health Integration (see Section 3.1 below). Unless otherwise specified, all analyses were restricted to patients who had made visits to PC providers in a PC clinic that implemented BHI. We will refer to these PC providers as BHI providers. We described the demographic characteristics of patients with at least one PC visit to a BHI provider separately within the pre- and post-implementation periods. 2.6.2. Time Series Analyses We conducted time series analyses using week intervals for screening and month intervals for assessment, diagnosis, and treatment. Specifically, we constructed visit-based binary indicators of each outcome and calculated the proportion of all PC visits to BHI providers during an interval (week or month), in which the patient (1) was screened for unhealthy alcohol use, (2) needed an AUD assessment and was assessed, (3) had a new AUD diagnosis, or (4) had a new AUD diagnosis and was treated. These proportions were plotted over the study period, separately for each clinic. Note that all of these main study outcomes have as their denominator the number of PC visits, as opposed to a denominator that could be affected by the implementation, such as patients with positive AUDIT-C screens [60]. This approach was used because the alternative would make the outcome challenging to interpret (since changes to the outcome could be due to changes to the denominator, numerator, or both). For example, integrating routine alcohol-related care likely changes the population of patients who are screened from a selected, high-risk subpopulation to a PC population. Therefore, individuals being screened, assessed, or diagnosed post-implementation would not be comparable to those being screened, assessed, or diagnosed in the pre-implementation period unless all PC patients seen during the time interval are used as the denominator.
Int. J. Environ. Res. Public Health 2017, 14, 1030
7 of 18
2.6.3. Pre-Versus Post-Implementation Analyses We defined the pre-implementation period as the period prior to the official launch date of SPARC care (as part of BHI) within the site, defined above, and the post-implementation period as the period following the official launch date (see Figure 1). Note that these pre- and post-implementation periods were defined a priori and may not correspond to the actual date when providers began implementing BHI. Using the first visit of a patient to a BHI provider within the pre- and post-implementation periods, respectively, as above, we calculated the proportion of patients who (1) were screened for unhealthy alcohol use, (2) needed an AUD assessment and were assessed, (3) had a new AUD diagnosis, and (4) had a new AUD diagnosis and were treated. Below, we report proportions either as percentages (e.g., number of patients screened per 100 seen) or as the number per 10,000 patients seen, as appropriate. We tested whether there was a significant difference in these proportions in the pre- versus post- period while accounting for correlation of repeated visits (if the same patient had a visit in both periods) by using generalized estimating equations (GEE) [61]. Specifically, we fit a separate logistic GEE model for each of the visit-specific binary outcomes (e.g., indicator for whether the patient was screened at that visit) regressed on an indicator for whether the visit occurred in the pre- vs. post-implementation period. We used an independent working covariance structure and the robust sandwich variance estimator; P values were calculated using the Wald test. We interpret P values less than 0.05 as statistically significant. 2.6.4. Sustainability As a measure of sustainability, we also calculated rates of alcohol screening and assessment in April 2017, which was 18, 14, and 13 months after the end of the active pilot implementation at Site 1, Site 2, and Site 3, respectively (see Figure 1). These analyses used the first visit of PC patients to a BHI provider during April 2017 as the denominator. 2.7. Implementation-Focused Formative Evaluation This pilot study did not include formal analyses of qualitative data, but instead we report on the results of the formative evaluation (FE). The two practice coaches interacted with staff in the three pilot PC sites regularly regarding elements of planned implementation that were challenging, and brought information on barriers and facilitators to a weekly implementation-focused FE meeting that included the principal investigator, a co-investigator, and a project manager [62]. This FE meeting, between the coaches and other investigators, was used to identify barriers and facilitators to using the planned implementation strategies and brainstorm approaches to maximize facilitators and overcome barriers. Proposed adaptations were then presented and discussed at the weekly meeting with the entire leadership team: clinical leaders leading BHI and implementation researchers. Detailed minutes of both FE and weekly meetings were taken by a research team member in real-time, for later template coding [63] based on the Greenhalgh model [64]. However, in this report, we summarize those barriers and facilitators that led to changes to the implementation strategies in the subsequent stepped-wedge trial (across the other 22 PC clinics), as well as the resulting changes to implementation strategies (without formal coding of qualitative data). 3. Results 3.1. Pilot Sites Selected by Health System Leaders Because support from integrated behavioral health clinicians was limited and felt to be a key ingredient for success for BHI at all design events (Table 1), local PC leaders at all three pilot sites decided to implement BHI only in some of their PC clinics. This was not originally planned. Site 1 implemented in two of three PC clinics, Site 2 implemented in one of two PC clinics, and Site 3 implemented in two of four PC clinics. The PC providers in the clinics implementing BHI are
Int. J. Environ. Res. Public Health 2017, 14, 1030
8 of 18
referred to as BHI providers below. At each site, about half of the PC providers implemented BHI. Additionally, while most BHI providers at Sites 1 and 3 began implementing BHI within a month of the original start date, BHI providers at Site 2 did not begin implementing BHI until 3 months after the original start date. 3.2. Study Sample There were 53,133 patients with a visit to a BHI provider during the study period, of whom 32,295 had a visit in the pre-implementation period and 39,599 had a visit in the post-implementation period (18,761 had a visit in both periods). The number of visits per patient across the study period ranged from 1 to 69, with a mean (interquartile range (IQR)) of 2.57 (1, 3) visits. Patients with a visit to a BHI provider in the pre-implementation period were predominantly female (62.0%), non-Hispanic (92.2%), white (82.3%), and had a mean (IQR) age of 54.5 (40, 68) years. These demographic characteristics were similar among patients with a visit in the post-implementation period, though statistically significantly different due to large sample sizes (Table 2). Table 2. Demographics of patients with PC visits pre- and post-implementation of Behavioral Health Integration including the Program of Sustained Patient-centered Alcohol-related Care (SPARC). Measure Male * Race ** Asian Black Other/Multiracial White Unknown Hispanic * No Yes Unknown Age ***, mean (IQR)
Pre (%)
Post (%)
(N = 32,295)
(N = 39,599)
38.0
40.1
5.9 2.4 6.9 82.1 2.8
5.1 2.3 6.6 83.1 2.9
92.2 5.1 2.7 54.5 (40, 68)
92.1 4.9 3 55.4 (42, 68)
p Value a < 0.0001 < 0.0001
0.022
< 0.0001
p value obtained from Fisher’s exact test (*), analysis of variance (**), or Wilcoxon rank sum test (***). a Patients with visits in both the Pre and Post periods were excluded from these statistical tests due to these tests’ assumption of independence.
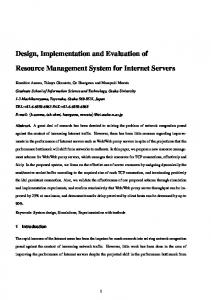
3.3. Quantitative Comparison of Care before versus after Implementation Figures 2–4 show time series plots of the rates of the primary study outcomes over the course of the study period separately in each of the three pilot sites. Table 3 shows the overall rates of these outcomes in theRes. postpre-implementation periods, pooled across the three sites. Int. J. Environ. Publicversus Health 2017, 14, 1030 9 of 18
Figure 2. Screeningfor for unhealthy unhealthy alcohol use:use: percentage (%) of (%) visitsof with screening week, among Figure 2. Screening alcohol percentage visits with by screening by week, providers implementing Behavioral Health Integration including the Sustained Patient-centered among providers implementing Behavioral Health Integration including the Sustained Patient-centered Alcohol-related Care (SPARC) program within three PC sites. Alcohol-related Care (SPARC) program within three PC sites.
Figure 2. Screening for unhealthy alcohol use: percentage (%) of visits with screening by week, among Figure 2. Screening for unhealthy alcohol use: percentage (%) of visits with screening by week, among providers Health Integration including the Sustained Patient-centered Int. J. Environ. Res. implementing Public Health 2017,Behavioral 14, 1030 providers implementing Behavioral Health Integration including the Sustained Patient-centered 9 of 18 Alcohol-related withinthree threePC PCsites. sites. Alcohol-relatedCare Care(SPARC) (SPARC) program program within
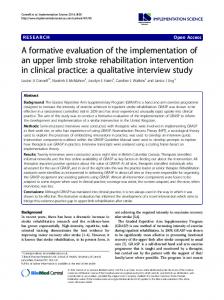
Figure Assessmentfor foralcohol alcoholuse use disorders (AUD): ofof visits with completed AUD Figure 3.3.3. Assessment percentage (%) visits with completed AUD Figure Assessment for alcohol usedisorders disorders(AUD): (AUD):percentage percentage(%) (%) of visits with completed AUD Symptom Checklistbybymonth, month,among amongproviders providers implementing implementing Behavioral Health Integration including Symptom Checklist Behavioral Health Integration including Symptom Checklist by month, among providers implementing Behavioral Health Integration including the SustainedPatient-centered Patient-centered Alcohol-related Care (SPARC) program within three PC PC sites. the program within three sites. theSustained Sustained Patient-centered Alcohol-related Care (SPARC) program within three PC sites.
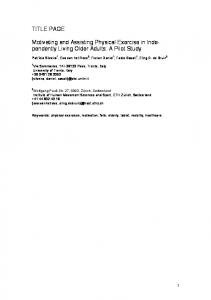
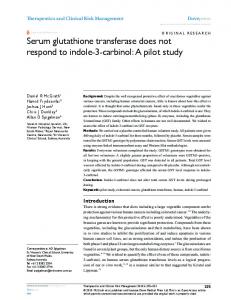
Figure 4. New diagnosis and treatment for alcohol use disorders (AUD): percentage (%) of visits by month, among providers implementing Behavioral Health Integration including the Sustained Figure New diagnosis and treatment alcohol disorders (AUD): percentage (%) of of visits by Figure 4.4. New diagnosis and treatmentfor for alcoholuse use disorders (AUD): percentage (%) visits Patient-centered Alcohol-related Care (SPARC) programHealth within three PC sites.including month, among Behavioral Integration including the the Sustained Sustained by month, amongproviders providersimplementing implementing Behavioral Health Integration
Patient-centeredAlcohol-related Alcohol-relatedCare Care(SPARC) (SPARC)program programwithin withinthree threePC PCsites. sites. Patient-centered Table 3. Changes in rates of alcohol screening, AUD symptom assessment, new diagnosis, and treatment of AUDs Pre- versus Post-Behavioral Health Integration (which includes the SPARC program). Measure Screened for unhealthy alcohol use Positive screen High risk unhealthy alcohol use Assessed for AUDs AUD (2 + symptoms) New AUD diagnosis ** AUD treatment among patients with new AUDs ** Within 14 days Within 30 days Within 90 days
Pre (%)
Post (%)
(N = 32,295)
(N = 39,599)
8.9 2.2 0.31 0.012 0.0062 0.39
62 17 1.4 0.75 0.40 0.58