Geosci. Model Dev., 8, 603–618, 2015 www.geosci-model-dev.net/8/603/2015/ doi:10.5194/gmd-8-603-2015 © Author(s) 2015. CC Attribution 3.0 License.
Regional climate hindcast simulations within EURO-CORDEX: evaluation of a WRF multi-physics ensemble E. Katragkou1 , M. García-Díez2,3 , R. Vautard4 , S. Sobolowski5 , P. Zanis1 , G. Alexandri6 , R. M. Cardoso7 , A. Colette8 , J. Fernandez3 , A. Gobiet9 , K. Goergen10,11,12 , T. Karacostas1 , S. Knist10 , S. Mayer5 , P. M. M. Soares7 , I. Pytharoulis1 , I. Tegoulias1 , A. Tsikerdekis1 , and D. Jacob13 1 Department
of Meteorology and Climatology, School of Geology, Aristotle University of Thessaloniki, Thessaloniki, Greece Dynamics and Impacts Unit, Institut Català de Ciències del Clima, Barcelona, Catalonia, Spain 3 Department of Applied Mathematics and Computer Science, Universidad de Cantabria, Santander, Spain 4 Laboratoire des Sciences du Climat et de l’Environment, IPSL, CEA/CNRS/UVSQ, Gif sur Yvette, France 5 Uni Research Climate & Bjerknes Center for Climate Research, Bergen, Norway 6 Laboratory of Atmospheric Physics, School of Physics, Aristotle University of Thessaloniki, Thessaloniki, Greece 7 Instituto Dom Luiz, Faculdade de Ciências, Universidade de Lisboa, 1749-016 Lisbon, Portugal 8 Institut National de l’ Environment industriel et des risques (INERIS), Verneuil en Halatte, France 9 Wegener Center for Climate and Global Change, University of Graz, Graz, Austria 10 Meteorological Institute, University of Bonn, Bonn, Germany 11 Jülich Supercomputing Centre, Forschungszentrum Jülich GmbH, Jülich, Germany 12 Luxembourg Institute of Science and Technology – former Centre de Recherche Public – Gabriel Lippmann (CRPGL), Belvaux, Luxembourg 13 Climate Service Centre 2, Hamburg, Germany 2 Climate
Correspondence to: E. Katragkou (
[email protected]) Received: 5 September 2014 – Published in Geosci. Model Dev. Discuss.: 2 October 2014 Revised: 31 January 2015 – Accepted: 16 February 2015 – Published: 16 March 2015
Abstract. In the current work we present six hindcast WRF (Weather Research and Forecasting model) simulations for the EURO-CORDEX (European Coordinated Regional Climate Downscaling Experiment) domain with different configurations in microphysics, convection and radiation for the time period 1990–2008. All regional model simulations are forced by the ERA-Interim reanalysis and have the same spatial resolution (0.44◦ ). These simulations are evaluated for surface temperature, precipitation, short- and longwave downward radiation at the surface and total cloud cover. The analysis of the WRF ensemble indicates systematic temperature and precipitation biases, which are linked to different physical mechanisms in the summer and winter seasons. Overestimation of total cloud cover and underestimation of downward shortwave radiation at the surface, mostly linked to the Grell–Devenyi convection and CAM (Community Atmosphere Model) radiation schemes, intensifies the negative bias in summer temperatures over northern Europe
(max −2.5 ◦ C). Conversely, a strong positive bias in downward shortwave radiation in summer over central (40–60 %) and southern Europe mitigates the systematic cold bias over these regions, signifying a typical case of error compensation. Maximum winter cold biases are over northeastern Europe (−2.8 ◦ C); this location suggests that land–atmosphere rather than cloud–radiation interactions are to blame. Precipitation is overestimated in summer by all model configurations, especially the higher quantiles which are associated with summertime deep cumulus convection. The largest precipitation biases are produced by the Kain–Fritsch convection scheme over the Mediterranean. Precipitation biases in winter are lower than those for summer in all model configurations (15–30 %). The results of this study indicate the importance of evaluating not only the basic climatic parameters of interest for climate change applications (temperature and precipitation), but also other components of the energy and water cycle, in order to identify the sources of system-
Published by Copernicus Publications on behalf of the European Geosciences Union.
604
E. Katragkou et al.: Regional climate hindcast simulations within EURO-CORDEX
atic biases, possible compensatory or masking mechanisms and suggest pathways for model improvement.
1
Introduction
Climate models are the primary tools for investigating the response of the climate system to various forcings, making climate predictions on seasonal to decadal timescales and projections of future climate. Regional climate models (RCMs) are applied over limited-area domains with boundary conditions either from global reanalysis or global climate model output. The use of RCMs for dynamical downscaling has grown, their resolution has increased, process descriptions have developed further, new components have been added, and coordinated ensemble experiments have become more widespread (Rummukainen, 2010; Flato et al., 2013). A significant constraint in a comprehensive evaluation of regional downscaling is that available studies often employ different methods, regions, periods and observational data for evaluation. Thus, evaluation results are difficult to generalize. The Coordinated Regional Climate Downscaling Experiment (CORDEX) initiative provides a platform for a joint evaluation of model performance, along with a solid scientific basis for impact assessments and other uses of downscaled climate information (Giorgi et al., 2009). Published work within CORDEX, focusing on the present climate over the European domain (EURO-CORDEX), indicates strengths and deficiencies in the state-of-the-art modelling tools used to downscale the global models of the Coupled Model Intercomparison Project Phase 5 (CMIP5) (Taylor et al., 2012). Kotlarski et al. (2014), in a joint evaluation based on the EURO-CORDEX ensemble, reported bias ranges for temperatures and precipitation comparable to those of the ENSEMBLES simulations (van der Linden et al., 2009), with some improvements and strong influence of model configuration choices on model performance. Vautard et al. (2013) focused on European heatwaves with the EUROCORDEX ensemble and found that high temperatures are primarily sensitive to convection and microphysics. Giorgi et al. (2012) highlighted the sensitivity of model performance to different parameterization schemes and parameter settings in a RegCM4 model study over different CORDEX domains, including Europe. These findings indicate that combining model evaluation with sensitivity studies is necessary in order to investigate recurring and persistent biases, list potential sources of their origin, dissuade/encourage modelers from using particular configurations responsible for systematic errors over specific regions and suggest tracks for model development. Since large model ensemble spreads and present climate biases are potentially linked with future climate uncertainties (Boberg and Christensen, 2012), it is important to understand the contributions of individual processes to the present European climate in order to interpret future climate projections with Geosci. Model Dev., 8, 603–618, 2015
greater confidence and possibly constrain these projections (Hall and Qu, 2006; Stegehuis et al., 2013). In the current work we analyse hindcast simulations of the Weather Research and Forecasting model (WRF) multi-physics ensemble performed within the framework of EURO-CORDEX. Recent research has demonstrated the ability of WRF (Skamarock et al., 2008) to refine global climate modelling output to higher spatial resolutions over Europe (e.g. Soares et al., 2012; Cardoso et al., 2013; WarrachSagi et al., 2013). The aim of this study is to identify systematic biases and areas of large uncertainties in present European climate and relate them to specific physical processes (e.g. cloud–radiation or land–atmosphere interactions). This analysis improves our understanding of WRF as a dynamical downscaling tool for RCM modelling studies and its optimization over this region.
2 2.1
Data and methodology Observations
To evaluate the model simulations we use daily mean, minimum, and maximum temperature and precipitation values from E-OBS version 9.0 (hereafter E-OBS9) covering the area 25–75◦ N and 40◦ W–75◦ E, available on a 0.44◦ rotated pole grid (Haylock et al., 2008). The E-OBS data set is based on the ECA&D (European Climate Assessment and Data) station data set and other archives. Short- and longwave downwelling radiation fluxes at the surface and cloud fraction were evaluated with the International Satellite Cloud Climatology Project (ISCCP) flux data set. The ISCCP radiation fluxes comprise a satellite derived product including shortwave (0.2–5 µm) and longwave (5.0– 200 µm) radiation at Earth’s surface. The radiation estimates come from the synergistic use of the ISCCP cloud data set, satellite data (TOMS, TOVS and SAGE-II), models (NCEP reanalysis, GISS climate model) and climatologies of various tropospheric and stratospheric parameters (aerosols, water vapour, etc). The data set spans from July 1983 to December 2009 with a temporal resolution of 3 h and a spatial resolution 280 km × 280 km (∼ 2.5◦ × 2.5◦ ). Zhang et al. (2004) estimated the uncertainty of the data set at 10–15 W m−2 compared with the ERBE (Earth Radiation Budget Experiment) and (Clouds and the Earth’s Radiant Energy System) CERES data sets. Since the ISCCP radiation data are generated from the complete radiative transfer model from the GISS (Goddard Institute for Space Studies) global climate model with observations of ISCCP surface, atmosphere and cloud physical properties as input, the radiation and cloud data sets are considered fully compatible. For the current analysis, seasonal averages of the ISCCP variables were calculated for the time period 1990–2008 and were compared to the WRF surface downward short- and longwave radiation, after bilinear interpolation to the 2.5◦ × 2.5◦ ISCCP grid. www.geosci-model-dev.net/8/603/2015/
E. Katragkou et al.: Regional climate hindcast simulations within EURO-CORDEX Model cloudiness was validated against the wellestablished cloud product from the ISCCP, obtained from operational sensors aboard geostationary and polar-orbiting satellites (Rossow and Schiffer, 1999). Single pixel observations in the visible (0.6 mm and 1 km resolution) and infrared (11 mm and 1–4 km resolution depending on the instrument) spectral bands are used. Pixels appearing to be colder and/or brighter than clear sky are characterized as cloudy. Pixel-level retrievals are spatially aggregated at an equal area grid with a resolution of 280 km × 280 km, being available 8 times per day. The ISCCP cloud product is in good agreement to the MODIS cloud mask product (Pincus et al., 2012). An additional, higher-resolution, satellite data set was also used for model validation in order to confirm the robustness of the validation findings with ISCCP. Shortwave downward radiation at the surface was obtained from Satellite Application Facilities for Climate Monitoring (CMSAF), which is part of the European Organization for the Exploitation of Meteorological Satellites (EUMETSAT). The spatial resolution of the data is 0.03◦ × 0.03◦ while the temporal resolution is 15 min. There are a total of six MFG satellites (Meteosat 2– 7), providing SSR (surface solar radiation) data from 1983 to 2005. This data set has been validated against homogenized ground-based observations from the Global Energy Balance Archive (GEBA) (Sanchez-Lorenzo et al., 2013) and from the Baseline Surface Radiation Network (BSRN) (Posselt et al., 2012). In this study, seasonal mean solar surface radiation data from CMSAF were re-gridded to the E-OBS 0.44◦ resolution in order to facilitate comparison with the WRF simulations over the 1990–2005 time period. Since this data set does not exactly overlap with the hindcast time slice (1990–2008), we used the higher-resolution data set only as auxiliary material to support the major findings of the model comparison with the coarser ISCCP satellite retrievals. 2.2
Models
In this work we present EURO-CORDEX hindcast climate simulations performed with the WRF/ARW (version 3.3.1) model. The simulations cover the EURO-CORDEX domain with a resolution of 0.44◦ . Some settings are common to all the simulations. The Noah land surface model (NOAH) was the commonly selected land surface model (Chen et al., 1996), the Yonsei University scheme (YSU) was the chosen planetary boundary layer (PBL) scheme (Hong et al., 2006) and MM5 similarity the surface layer option. All simulations were forced by the ERA-Interim reanalysis data set (Dee et al., 2011) at 6-hourly intervals with a spatial resolution of 0.75◦ . The pre-processing and implementation of the forcing fields in the simulations (relaxation zone, method, etc.), the setting of vertical layering, land use databases, and sea surface temperatures were determined by each group separately. In the current ensemble, five different WRF configurations are applied (Table 1). Three convection schemes were www.geosci-model-dev.net/8/603/2015/
605
used, namely the Kain–Fritsch (KF; Kain, 2004), the Grell– Devenyi (GD; Grell and Dévényi, 2002) and the Betts– Miller–Janjic ensemble (BMJ; Janjic, 2000). The radiation physics options tested were the newer version of the Rapid Radiative Transfer Model (RRTMG; Iacono et al., 2008) and the CAM scheme (Community Atmosphere Model; Collins et al., 2004). The selected microphysics options were the WRF single-moment 3 and 5 class schemes (WSM3/WSM5; Hong et al., 2004) and the WRF single-moment 6-class scheme (WSM6; Hong and Lim 2006). The number of points in relaxation zone and type of relaxation are provided in the last column of Table 1. WRF_A configuration is simulated twice with different SSTs (WRF_A and WRF_A_SST). In WRF_A_SST, the SST field was interpolated as provided in the standard 3.3.1 release (METGRID.TBL). This option results in a coarse resolution of the SSTs resulting in a strong temperature perturbation across the European coastline. In other configurations, either a finer interpolation method is used or the SST fields are replaced by skin temperature. Five meteorological variables are evaluated, namely surface temperature, precipitation, total cloud cover, and the short- and longwave downward radiation at the surface. Temperature and precipitation fields were interpolated to the 0.44◦ E-OBS grid and an elevation correction (standard lapse rate of 6 ◦ C km−1 ) was applied to the simulated temperature to account for the difference between E-OBS9 and model orography. Radiation and cloud data were interpolated to a common ISCCP 2.5◦ grid for comparison to the satellite data set. The fractional cloud cover is available in each hybrid level in WRF. In order to compute total cloud cover, an assumption about the overlapping of these fractions is needed. Therefore, we post-processed the fractional cloud cover following the algorithm proposed by Sundqvist et al. (1989). This method assumes maximum overlapping inside cloud layers and random overlapping between them, which is usually summarized as maximum/random overlapping. Radiation parameterizations make their own assumptions to compute cloud effects on radiative fluxes. The overlapping methodology of the CAM radiation parameterization is described in Collins (2001); this is also a maximum/random overlapping approach. The RRTMG parameterization also uses maximum/random overlapping. Therefore, except for small differences in the algorithms, the overlapping assumptions are consistent throughout the parameterizations and postprocessing. 2.3
Methodology
Mean surface temperature, precipitation and solar radiation were calculated for the time period of interest (1990–2008). All simulations used 1 year (1989) as spin-up time. This spinup allows for adjustment of the soil moisture and temperature. The seasons were averaged from June to August (JJA) and December to February (DJF). All seasonal averages were Geosci. Model Dev., 8, 603–618, 2015
606
E. Katragkou et al.: Regional climate hindcast simulations within EURO-CORDEX
Table 1. WRF configurations participating in the study. Label
Institute
Nz/TOA
Microphys.
Cum.
Rad.
Rel. zone
WRF-A WRF-A_SST WRF-C WRF-D WRF-F WRF-G
CRPGL AUTH BCCR IDL IPSL UCAN
50/20 hPa 30/50 hPa 30 m/50 hPa 40/50 hPa 32/50 hPa 30 m/50 hPa
WSM6 WSM6 WSM3 WSM6 WSM5 WSM6
KF KF KF BMJ GD GD
CAM3 CAM3 CAM3 RRTMG RRTMG CAM3
10/exp 5/linear 10/exp 5/exp 5/linear 10/linear
WSM3: single-moment 3 class microphysics scheme, WSM5: double-moment 5 class microphysics scheme, WSM6: double-moment 6 class microphysics scheme, KF: Kain–Fritsch cumulus parameterization, BMJ: Betss–Miller–Janjic cumulus parameterization, GD: Grell–Devenyi cumulus parameterization, CAM3: radiation scheme from the CAM 3 climate model, RRTMG: new Rapid Radiative Transfer Model, exp: exponential, AUTH: Aristotle University of Thessaloniki, BCCR: Bjerknes Centre for Climate Research, CRPGL: Centre de Recherche Public – Gabriel Lippman, IDL: Instituto Dom Luiz, IPSL: Institut Pierre Simon Laplace, UCAN: Universidad de Cantabria.
calculated based on mean monthly values. The analysis is undertaken over the whole European domain and over the following subregions: Alps (AL), British Isles (BI), eastern Europe (EA), France (FR), mid-Europe (ME), Mediterranean (MD), Iberian Peninsula (IP) and Scandinavian Peninsula (SC). These subdomains are described in Christensen and Christensen (2007). Taylor diagrams are used to provide a concise statistical summary of how well observed and simulated patterns match each other in terms of their correlation (R) and normalized standard deviation (NSD) (Taylor, 2001). On a Taylor diagram, R and NSD are all indicated by a single point on a two-dimensional polar coordinate plot. The radial distance from the origin corresponds to NSD while the azimuthal position corresponds to R. In the Taylor diagrams the reference point is also displayed, which has R and NSD equal to one. Thus it is easy to identify locations and analysis regions for which the model performs relatively well, as they lie close to the reference point. Furthermore, in case of deviations from the reference, it is easy to distinguish between errors due to poor simulation of variance or due to incorrect phasing (low correlation). Q–q plots compare the probability distribution of two variables, by representing on a Cartesian plane some quantiles of a variable against those of another variable or a theoretical distribution. In this work we followed the methodology of Garcia-Diez et al. (2012) and compared the distribution of simulated mean temperature and precipitation (y axis) against the observations (x axis), dividing the probability range into 19 pieces (i.e. taking a quantile every 5 %). These representations allow one to easily identify deviations in the probability distribution (as departures from a straight diagonal line), biases (as shifts), differences in the variability (as straight lines with a different slope) or asymmetries (as curved lines). In order to test the statistical significance of differences between models and observations we calculate the quantity t (two-independent sample t test): t = (Xm − Xo )/SQRT((σm2 + σo2 )/n), Geosci. Model Dev., 8, 603–618, 2015
(1)
where Xm and Xo are the arithmetic means of the n = 57 monthly values for one season in the 19-year time slice; σm and σo are the standard deviations of the n values. The modelled and observed values are deemed significantly different at the 95 % level if t > 1.98.
3
Results
3.1 3.1.1
Surface temperature Bias
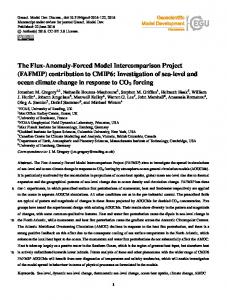
The mean climatological patterns and the annual cycle of temperature are captured quite well by all model configurations and exhibit the spatial characteristics of E-OBS9. This supports the view that major processes governing the surface temperature climatology are represented reasonably by all model configurations. Figure 1 shows the summer and winter mean surface 2 m temperature bias with respect to EOBS9 over Europe averaged over the time slice 1990–2008. Stippling indicates areas where the biases are not statistically significant; over all other regions the models and observations are significantly different at the 95 % level. Table 2 summarizes the E-OBS9 mean seasonal averages of surface temperature over the different subregions, the absolute model bias (model-E-OBS9) of all simulations and the ERA-Interim comparison with E-OBS (ERA-Interim minus E-OBS9). The forcing fields (ERAi) are somewhat warmer (∼ 0.5 ◦ C) over the whole European domain compared to EOBS9 data. Nearly all WRF configurations underestimate winter and summer surface temperatures over the different European subregions. Over southern Europe (MD, IP) the upper quantiles of the JJA mean temperature are overestimated, as indicated by the q–q plots (Fig. S1a in the Supplement). Otherwise, the biases remain systematically negative for all configurations, with no obvious asymmetries or differences in variability, except for the behaviour of WRF-G in summer and WRF-A_SST in winter, which are discussed thoroughly in the following sections. www.geosci-model-dev.net/8/603/2015/
E. Katragkou et al.: Regional climate hindcast simulations within EURO-CORDEX
607
Figure 1. (a) Mean summer and (b) mean winter 1990–2008 surface temperature bias (model-E-OBS9). Stippling indicates areas where the biases are not statistically significant. Mind the differences in colour scales. Table 2a. Means (Mobs) of summer (JJA) surface temperature for observations (E-OBS9) over 1990–2008 in the European subregions and the model mean seasonal bias (Mmod–Mobs). Units are in degrees Celsius.
AL BI EA FR IP MD ME SC
E-OBS9
WRF-A _SST
WRF-C
WRF-A
WRF-D
WRF-F
WRF-G
ERAi
17.1 14.7 18.8 18.8 21.8 21.9 17.5 13.6
−1.0 −2.3 −0.1 −2.1 −0.5 −0.4 −1.6 −2.3
−1.4 −1.2 −0.1 −1.6 −1.5 −1.1 −0.7 −0.7
−0.4 −0.9 0.3 −0.9 0.0 0.0 −0.3 −0.5
−0.2 −0.6 0.5 −0.3 0.9 0.7 −0.2 −0.4
−0.9 −1.2 −0.1 −1.2 0.3 0.5 −1.1 −0.6
−2.1 −2.4 −2.3 −2.9 −1.0 −1.0 −2.8 −2.6
0.7 0.3 0.4 0.2 0.3 0.9 0.3 0.6
A large negative wintertime temperature bias in maximum temperatures (−9 ◦ C) (Fig. S2) over northeastern Europe is apparent in WRF-A_SST and in all other configurations. This feature is more persistent in minimum temperatures (Fig. S3) ranging from −2 ◦ C (WRF-F) to −13 ◦ C (WRFA_SST). In summer, maximum temperatures are reasonably reproduced in most configurations with biases becoming positive over central and eastern Europe. Only the WRF-G configuration exhibits the same persistent negative biases in summer as winter, over northern Europe. Minimum temperatures in summer are relatively well reproduced, with some positive biases mostly seen in WRF-F (< 3 ◦ C). Mooney et al. (2013), in a WRF multi-physics ensemble forced by ERAInterim, reported that summer surface temperature is mostly controlled by the selection of land surface models (LSMs). In www.geosci-model-dev.net/8/603/2015/
their study the NOAH and Rapid Update Cycle (RUC) LSMs were tested, and the use of NOAH yielded more accurate surface temperatures than the use of RUC, however the temperature distributions were shifted towards lower values, especially when combined with the CAM radiation scheme. Our current findings can neither support nor contradict this finding, since all models are using the NOAH LSM. We could speculate, however, that the combination of the NOAH LSM along with the CAM radiation scheme is one possible explanation contributing to the general tendency towards cold biases in the WRF ensemble. Of all our WRF simulations, WRF-G has the largest cold bias in summer (−2.1 ◦ C mean over all European subregions). WRF-G uses the GD convection scheme, which may explain the larger cold bias since the other configuration usGeosci. Model Dev., 8, 603–618, 2015
608
E. Katragkou et al.: Regional climate hindcast simulations within EURO-CORDEX
Table 2b. Same as Table 2a for winter.
AL BI EA FR IP MD ME SC
E-OBS9
WRF-A _SST
WRF-C
WRF-A
WRF-D
WRF-F
WRF-G
ERAi
0.5 4.6 −1.1 5.1 7.0 5.0 1.8 −5.3
−3.6 −3.2 −5.2 −3.1 −2.0 −5.5 −3.8 −7.0
−1.1 −0.1 −2.0 −0.5 −0.9 −1.1 −0.9 −2.8
−0.3 −0.1 −1.3 −0.4 −0.4 −1.0 −0.5 −1.8
−0.4 0.2 −0.2 0.0 −0.1 −0.5 0.2 −1.8
0.3 0.7 0.6 0.7 0.4 −0.1 0.7 −0.9
−0.7 0.1 −1.9 −0.6 −0.7 −0.9 −1.0 −2.2
0.0 0.7 0.2 0.1 0.3 0.6 0.2 0.4
ing the same microphysics (WSM6) and radiation (CAM) as WRF-G, with a different convective scheme (WRF-A with KF scheme), has a smaller bias (−0.3 ◦ C). Analysis of the short- and longwave radiation components further supports this interpretation, as shown below. Negative temperature biases are apparent in winter across all model configurations, especially over northeastern Europe. As indicated by the winter mean temperature q–q plots (Fig. S1b), this underestimation mostly appears in the lower quantiles of the distribution. This finding is not uncommon among different climate simulations including the global models within CMIP5 (e.g. Cattiaux et al., 2013). Mooney et al. (2013) reported that the radiation scheme (especially the longwave component) has a large impact on winter surface temperature, the CAM option being related to a greater negative bias over northeastern Europe relative to RRTMG. Our simulations confirm this finding as WRF-D and WRF-F, which use the RRTMG radiation scheme, exhibit the smallest winter biases over the EA domain (−0.2 and 0.6 ◦ C respectively). The winter bias in Scandinavia ranges from −1 to −3 ◦ C. Interestingly, the same subregions (SC and EA), apart from exhibiting the largest winter bias, are also the areas with the largest spread in temperature (Fig. S4). Moreover, the differences between the observed and model distributions over this area are statistically significant for all model configurations. The wintertime standard deviations are considerably larger than in summertime and are mostly located over northeastern Europe (3–4 ◦ C) with a northeast–southwest gradient. This spatial pattern of higher uncertainty (spread) over northeastern Europe has also been reported in future climate projections for winter temperature, and is related to the role of snow cover in cooling the surface through snow albedo and snow emissivity feedbacks (Déqué et al., 2007). Another issue for consideration is that the working WRF version has known problems in treating surface temperature in snow covered areas1 . Garcia-Diez et al. (2014) show also in their 5-year multi-physics EURO-CORDEX ensemble that snow-covered European regions (Alps, and northeastern Eu1 http://www.atmos.washington.edu/~cliff/WRFWorkshop2013.
ppt
Geosci. Model Dev., 8, 603–618, 2015
rope) overestimate the surface albedo, which may be among the causes of bias. WRF-A_SST has an even colder bias for both seasons in comparison to WRF-A, despite using the same primary parameterizations. This disagreement can be attributed to the SST implementation (coarse resolution along the coastline). This perturbation of SSTs substantially affects the inner part of the domain in winter by lowering the surface temperature, as indicated by additional 1-year long sensitivity studies with the WRF-A_SST modelling system. In the 19-year hindcast simulations this effect is not so pronounced in summer. The southern part of the Scandinavian Peninsula, the UK, and Italy are the areas with the highest temperature differences in winter. This increases the spread in these areas even more and, thus, uncertainty in winter temperature, which has already been shown to be large above northeastern Europe in winter. The causal link between SSTs and land surface temperature is not easy to depict as they both may influence one another and third factors may influence both at the same time. Similar behaviour to that shown here is also reported by Cattiaux et al. (2011) in a North Atlantic SST sensitivity experiment of fall and winter 2006/2007 with a climatological (i.e. colder) SST data set. A similar response in land surface temperature above Europe was showcased, in which anomalous SSTs affected land temperature through upper-air advection of heat and water vapour, which then interacted with radiative fluxes over the continent. This mechanism was found to be more pronounced in autumn and winter, when the pathway is more efficient. 3.1.2
Temporal and spatial agreement
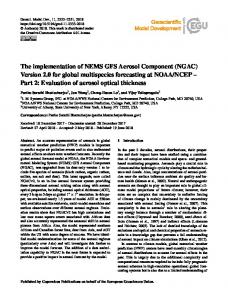
Taylor plots (Taylor, 2001) are used to investigate the temporal agreement between the simulated and observed fields, i.e. the reproduction of interannual variations. With areaaveraged temperature fields, we compare time series of spatially averaged quantities. Figure 2 (upper panel) depicts model performance averaged over the different European subregions, different colours depict the different WRF configurations. Overall, model performance based on average monthly values indicates very high temporal agreement with www.geosci-model-dev.net/8/603/2015/
E. Katragkou et al.: Regional climate hindcast simulations within EURO-CORDEX 3.2 3.2.1
1
2 3
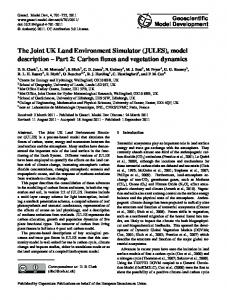
Figure 2 Temporal (upper panel) andpanel) spatial and (bottom panel) Taylor panel) plots forTaylor surface Figure 2. Temporal (upper spatial (bottom
4
temperature averaged overtemperature Europe for summer and winter 1990-2008. plot plots for surface averaged over EuropeUpldated for summer
5
and
winter 1990–2008. Updated plot.
observations (0.95) and amplitude of variability higher than34 the observed (σnorm > 1). Inspection of Taylor plots for each different European subregion (Fig. S5), shows that the largest amplitude of variability in summer is produced by WRFF/WRF-G and the lowest (σnorm slightly below unity) by WRF-C. The worst performance with respect to temporal correlation is found over the Alps in winter and summer (0.7 < R < 0.8); this is most likely due to the coarse resolution of the model set-up which cannot accurately capture the topographic features of the area. The spatial agreement between observations and the models is investigated by comparing the time-averaged spatial fields, i.e. two maps without a temporally varying component. The spatial agreement over the European domain (Fig. 2, bottom) is very high (0.97–0.99), confirming that the spatial representation of surface temperature is captured well. The amplitude of normalized standard deviation (σnorm ) in winter is somewhat higher than unity for all configurations. In summer results are more dispersed compared to in winter, and the WRF-C configuration again gives the lowest and best (unity) σnorm . On a subregional level results appear to have greater spread over inner continental regions (ME, FR, EA) in comparison to coastal areas (IP, SC, MD, IB). www.geosci-model-dev.net/8/603/2015/
609
Precipitation Bias
All models depict observed climatological features, namely the major precipitation maxima over the Alps (smaller in winter) and western Norway and the dry regions over the Mediterranean in summer (Fig. S6). Precipitation is overestimated for both seasons over all subregions, except for the British Isles in winter (−5 to −15 % relative bias depending on the configuration) (Table 3). The precipitation bias is larger in summer, ranging between 25 and 55 % for the different model configurations, than in winter (15–30 %). Figure 3 shows the mean bias in precipitation for all model configurations. The difference between modelled and observed values is statistically significant for all configurations over most subregions. The models show the largest deviation from observations for summer precipitation magnitudes in the Mediterranean area, especially if the KF convective scheme is selected. Convective precipitation along the Dinaric Alps is overestimated in the WRF-C and WRF-A configurations to such a degree that the modelled precipitation is almost double the observed amount. The issue of unrealistically high summer convective precipitation over mountainous regions is also discussed by Torma et al. (2011) and Mystakidis et al. (2013), indicating that the bias improves in higher-resolution simulations by optimizing the convection scheme. Higher precipitation rates (upper quantiles) are overestimated over all subregions for all model configurations (Fig. S7a). Herwehe et al. (2014), in their study over North America, also reported a large overestimation in larger summertime precipitation amounts (> 2.54 cm), attributed to deep cumulus convection. This large overestimation was improved considerably when subgrid-scale cloud–radiation interactions were introduced into the WRF model in the KF convection scheme (Alapaty et al., 2012). The lowest summer precipitation bias is noted when the GD convective scheme is used (about 25–30 % on average), followed by the BMJ (about 35 %). The KF scheme is related to the highest positive precipitation bias over all European subregions except the Scandinavian Peninsula (50–55 % in summer and 20–30 % in winter). Modelled winter precipitation is more comparable to observations: the most problematic area with respect to bias appears to be eastern Europe (50–65 % for different model options) while for all other European subregions the bias is considerably lower (20–30 %). A number of WRF ensemble studies (Evans et al., 2012; Ji et al., 2014; Di Luca et al., 2014) have also reported that the cumulus, along with the PBL, schemes exhibit the strongest influence on precipitation. Evans et al. (2012), in a WRF ensemble study over southeastern Australia, reported that the YSU PBL scheme tends to induce more convection in the KF scheme and leads to an overestimation of precipitation. Precipitation overestimation is not an uncommon feature in WRF simulations (Garcia-Diez et al., 2014) and it often Geosci. Model Dev., 8, 603–618, 2015
610
E. Katragkou et al.: Regional climate hindcast simulations within EURO-CORDEX
Table 3a. Mean (Mobs) of summer (JJA) precipitation for observations (E-OBS9) over 1990–2008 in the European subregions (units in mm day−1 ). Model relative bias (%).
AL BI EA FR IP MD ME SC
E-OBS9
WRF-A_SST
WRF-C
WRF-A
WRF-D
WRF-F
WRF-G
3.20 2.45 2.22 1.75 0.67 0.83 2.35 2.46
8% 15 % 23 % 15 % −6 % −1 % 27 % 26 %
37 % 34 % 41 % 83 % 63 % 102 % 46 % 33 %
28 % 23 % 49 % 47 % 63 % 94 % 42 % 39 %
24 % 27 % 39 % 16 % 25 % 64 % 34 % 54 %
14 % −1 % 36 % 37 % 31 % 40 % 34 % 22 %
21 % 6% 33 % 35 % 15 % 59 % 23 % 7%
E-OBS9
WRF-A _SST
WRF-C
WRF-A
WRF-D
WRF-F
WRF-G
2.53 3.63 1.13 2.15 1.94 1.98 1.92 2.01
16 % −11 % 44 % 45 % 7% −15 % 42 % 4%
14 % −4 % 51 % 33 % 10 % 33 % 23 % 14 %
26 % −4 % 65 % 38 % 11 % 32 % 38 % 24 %
41 % −13 % 59 % 20 % −4 % 14 % 28 % 27 %
17 % −11 % 60 % 18 % −15 % 1% 30 % 22 %
7% −5 % 65 % 24 % −9 % 10 % 31 % 21 %
Table 3b. Same as Table 3a for winter.
AL BI EA FR IP MD ME SC
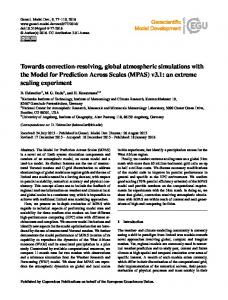
becomes more pronounced at higher resolutions. This systematic error may reflect an unbalanced hydrological cycle, returning moisture from land and/or water bodies to the atmosphere too quickly. Kotlarski et al. (2014) suggest that the wintertime wet bias of WRF is closely related to the distinct negative bias of mean sea-level pressure, indicating a too high intensity of low pressure systems passing over the continent. However, some sensitivity studies performed using WRF-F with spectral nudging for upper air winds, and thereby mitigating this problem, showed little change in bias amplitude (R. Vautard, personal communication, 2014). Sensitivity tests conducted to test alternative choices for convective parameterizations and cloud microphysics are usually not conclusive and none of the options decisively improve the general picture at higher resolutions (Bullock et al., 2014). Figure 4 depicts the annual cycles of all model configurations based on mean monthly values over the selected subregions. The shaded area corresponds to the observational standard deviation. All configurations reproduce the basic characteristics of the seasonal cycle reasonably well, such as the dry summers of southern Europe or the summer maximum over Scandinavia. All simulations have a wet bias, mostly during spring- and summertime and to a lesser extent in autumn and winter. This fact points to smaller-scale circulations and convection being critical components to the large positive bias in precipitation. Higher correlations of the modelled with observed annual cycles are seen over the Mediterranean and the Iberian and Scandinavian peninsulas, despite
Geosci. Model Dev., 8, 603–618, 2015
the large positive bias. Results are more dispersed and less correlated for the Alps and the mid-Europe regions. In a few cases the models have difficulty correctly capturing the seasonal cycle over France (WRF-C, WRF-G, WRF-F). The perturbed SSTs in the WRF-A_SST simulation result in a drier climate throughout the year. The physical reason of this colder and drier climate can be traced to the water holding capacity of the atmosphere, which limits precipitation amounts in colder conditions, assuming a small change in the average relative humidity. Depending on the energetic constraints of a region and its water limitations this relation is modulated accordingly for each season and subregion (Trenberth and Shea, 2005). It should be noted that the reduced precipitation in WRF-A_SST simulations considerably improves the precipitation bias (Table 2) to about 15 % on average for both seasons. However, this is likely just a case of error compensation, based on the predominance of precipitation overestimation as a feature of our WRF simulations. 3.2.2
Temporal and spatial agreement
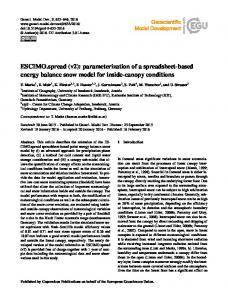
Following the same methodology described above for temperature, we proceed with the analysis for precipitation. The temporal Taylor plots are based on mean monthly values, thus, indicating interannual variability, and are averaged over all European subregions (Fig. 5, upper panel) for precipitation shows that the average JJA temporal correlation is 0.8 for all configurations, with amplitudes of variability being close to unity for WRF-F/WRF-G (GD convection) and somewhat www.geosci-model-dev.net/8/603/2015/
E. Katragkou et al.: Regional climate hindcast simulations within EURO-CORDEX
611
Figure 3. (a) Mean summer and (b) mean winter 1990–2008 precipitation bias (model-E-OBS9) (expressed in mm day−1 ). Stippling indicates areas where the biases are not statistically significant.
higher for all other configurations. The impact of the selection of the convective scheme is clearly seen in the summer season but not in winter. For DJF precipitation, the metrics improve somewhat in comparison to those during the warm period (0.8 < R < 0.9 and σnorm ∼ 1); therefore, it seems that WRF captures the temporal variability better in winter than in summer, apart from having a lower wet bias. The temporal correlation over the Alps is lowest in the subregional analysis (0.3 < R < 0.6) and largest over the Scandinavian Peninsula (0.9 in winter and 0.6–0.8 in summer). With respect to spatial agreement with observations (Fig. 5, bottom), it seems that DJF WRF results are coherent and that the different model parameterizations do not greatly impact the average winter spatial pattern. The average spatial correlation is about 0.7 and the amplitude of variability 1.1–1.2. In summer results are more dispersed with spatial correlations ranging from 0.8 to 0.9 and higher amplitudes of variability (1.2–1.5), indicating that the models overestimate the amplitude of JJA spatial variation. This is a common finding among regional climate model studies, where summer precipitation is mostly controlled by internal convective processes and winter patterns most likely linked to the large-scale circulation and thus the forcing fields (e.g. Rauscher et al., 2010). On a subregional level, the highest spatial correlations are seen over the Scandinavian Peninsula and the British Isles (R = 0.9) in winter and the lowest over France and mid-Europe in summer (R = 0.4). The amplitude of variability is exaggerated by all model configurations in
www.geosci-model-dev.net/8/603/2015/
summer (1.5 < σnorm < 2), with the exception of the British Isles (σnorm close to unity). 3.3
Radiation
The primary driver of latitudinal and seasonal variations in temperature is the seasonally varying pattern of incident sunlight, and a fundamental driver of the circulation of the atmosphere are the local-to-planetary scale imbalances between the shortwave (SW) and longwave (LW) radiation. The impact of the distribution of insolation on temperature can be strongly modified by the distribution of clouds and surface characteristics. In this section we evaluate two radiation components of the WRF model simulations, namely the surface downwelling SW and LW, which are compared to available ISCCP satellite retrievals. The comparison was also performed with the CMSAF satellite data set, available in a higher spatial resolution, but only between 1997 and 2003. 3.3.1
Downward shortwave radiation at the surface
Seasonal average 1990–2008 downward SW radiation components from WRF and ISCCP satellite data are compared over the European domain. Satellite observations exhibit a south–north gradient in summer, with a maximum over the Mediterranean (up to 400 W m−2 ) and minima over northern Europe (about 200 W m−2 on average). All model configurations exhibit this south–north gradient, however, with different characteristics: in some configurations (WRF-A/WRF-C Geosci. Model Dev., 8, 603–618, 2015
612
E. Katragkou et al.: Regional climate hindcast simulations within EURO-CORDEX
1
2 3
Figure 5 Temporal (upper panel) and spatial panel) Taylor plotspanel) for precipitation Figure 5. Temporal (upper panel)(bottom and spatial (bottom Taylor
4
averaged for summeraveraged and winter 1990-2008. Updated plotsover forEurope precipitation over Europe forplot summer
5
and winter
1990–2008.
Figure 4. Mean precipitation annual cycle. The grey area indicates observational standard deviation.
with KF or WRF-D with BMJ convection) the SW radiation gradient is less steep towards the north compared to the satellite data, leading to a positive SW bias of 40–60 % (except for Scandinavia) with a maximum over central Europe (Fig. 6a). For WRF-F and WRF-G (GD convection) the SW radiation decreases very steeply near 40–45◦ , leading to negative bias of SW radiation over northern Europe. This at least partially explains the larger negative summer temperature biases over central and northern Europe for WRF-G and WRF-F, compared to other configurations. The SW radiation bias pattern also resembles the bias pattern of maximum surface temperature (Fig. S2a), indicating a strong dependence of maximum temperatures on the SW radiation component. For the WRFG configuration maximum temperatures are underestimated by up to 8 ◦ C over northern Europe, while biases in minimum temperatures are generally smaller (Fig. S3a) and less correlated with SW radiation. Interestingly, Garcia-Diez et al. (2014) showed that the negative SW radiation bias over central and northern Europe in summer in the WRF-G configuration is not reproduced in a 5-year simulation, where the model simulation restarts daily from the ERA-interim forcing fields with 12 h of spinup. Thus, it appears this radiation bias is related to internal Geosci. Model Dev., 8, 603–618, 2015
physical mechanisms and, eventually, feedbacks, which develop in a years-long climate simulation. As shown later, the underestimation of SW downward radiation at the surface in GD convection can be linked to a 40–50 % overestimation of38 cloudiness. The observational data indicate a maxima of the wintertime SW radiation values at about 160 W m−2 over the southern part of the domain and decreases gradually towards the north. The same spatial pattern is reproduced by all model configurations; however, there is mostly a positive SW radiation bias over the domain, except over the Iberian Peninsula and northern European coasts of France and Benelux (Fig. 6b). The positive bias increases towards the northern and eastern parts of the domain, where it reaches up to 70– 80 %. WRF-C, with different microphysics (WSM3), has an additional feature of a higher positive SW radiation bias over central and eastern Europe (∼ 70 %). 3.3.2
Downward longwave radiation at the surface
Downward LW radiation in summer is higher over southern Europe and decreases towards the north. Comparison with the ISCCP satellite data indicates a negative bias over southern Europe of about 20 % – more pronounced for the KF convective scheme – that becomes positive over northern Europe with larger positive biases with the GD convective scheme www.geosci-model-dev.net/8/603/2015/
E. Katragkou et al.: Regional climate hindcast simulations within EURO-CORDEX
613
Figure 6. (a) Mean summer and (b) mean winter 1990–2008 downward surface shortwave radiation bias (WRF-ISCCP).
(10 %) (Fig. 7a). Comparison of Figs. 6a and 7a (SW and LW components) shows that summer SW and LW biases are generally anticorrelated, in such a way that regions with positive SW bias exhibit a negative LW bias and vice versa. If the magnitude of biases were the same, there would be a cancelling-out of radiation bias and a better agreement with observed temperature would be expected. However, this is not the case. For the WRF-A and WRF-C configurations using the KF convection and CAM radiation schemes there is a strong surplus in downward radiation (SWbias + LWbias > 0) over central and southern Europe, leading to lower cold bias or even small warm biases in southern Europe in comparison to northern Europe (Fig. S8a). The BMJ/RRTMG configuration (WRF-D) has the same features with more enhanced and extended radiation surplus over eastern Europe. The GD/CAM (WRF-G) configuration has a negative summer SW radiation bias over northern Europe and a smaller magnitude positive bias in LW, resulting in a deficit of downward radiation (SWbias + LWbias < 0). Over southern Europe the signs change (positive SW bias/negative LW bias) resulting in a surplus of downward radiation (SWbias + LWbias > 0). This feature helps explain the pronounced cold bias in northern Europe, which becomes lower towards the south. The winter LW climatology (Fig. S9) correlates well spatially with the temperature patterns. It is minimized over northeast Europe and increases towards the southern and western parts of Europe. The winter LW bias is negative over most of Europe for all model configurations (Fig. 7b), with
www.geosci-model-dev.net/8/603/2015/
some smaller or even positive biases along the northwestern coasts (France, Benelux, Denmark, and Baltic countries), which compensates for the SW radiation surplus discussed previously. Since the wintertime SW amounts over northern European are very small, the radiation regime is regulated by the LW radiation component which exhibits a deficit (SWbias + LWbias < 0) over these regions. This deficit decreases or even becomes positive (WRF-G/WRF-F) in southern and southwestern Europe (Fig. S8b). 3.3.3
Total cloud cover
Since cloudiness is a key component in the discussion concerning radiation, we compare our model results with total cloud cover (CC) of the ISCCP satellite retrievals. During the summer season, observations indicate increased CC over the northern and western parts of the domain (CC > 0.8) i.e. the northeastern Atlantic, and the lowest CC in southern Europe (lat < 40◦ ). All WRF configurations have a similar pattern but underestimate CC in southern Europe (Fig. 8a), by more than 50 %. The configurations with the GD convective scheme have an additional positive bias over northeastern Europe. This pattern is well correlated with the SW radiation bias discussed above, indicating that cloudiness and SW radiation biases have opposite signs, as expected. Herwehe et al. (2014), in a climatic application of WRF over North America, also reported an underestimation of summertime cloud fraction over the southeastern part of their domain, which was considerably improved by including the subgridGeosci. Model Dev., 8, 603–618, 2015
614
E. Katragkou et al.: Regional climate hindcast simulations within EURO-CORDEX
Figure 7. (a) Mean summer and (b) mean winter 1990–2008 downward surface longwave radiation bias (WRF-ISCCP).
scale correction in the KF convection scheme. The most pronounced improvement was found in the middle cloud layer (700–500 hPa), which is consistent with the deep summertime convection. The addition of subgrid-scale cloudiness also had the anticipated effect of decreasing the SW downwelling radiation at the surface and, thus, better agreement with satellite data. The impact on the LW radiation component was minor. The observed CC in winter has a more pronounced peak over the northwestern part of the domain over the sea and decreases gradually towards the south, with a secondary maximum over the Black Sea and a minima over the Iberian Peninsula (Fig. S10). The bias pattern in winter (Fig. 8b) is negative over the Mediterranean (−20 to −30 %) (except in configurations with the GD convective scheme) and positive over northern and northeastern parts of Europe (40–50 %). The higher than observed cloudiness over northern Europe reduces the amounts of SW radiation reaching the surface, but the positive SW bias remains. Note, however, that winter SW radiation absolute amounts are very small over northern Europe in winter, so that large relative biases (60–70 %) over this area correspond to small absolute changes, which lie within the uncertainty of the satellite data (Zhang et al., 2004). The positive wintertime bias in cloud cover over northern Europe is accompanied by negative bias in the LW downward radiation at the surface in all model configurations. There is not a straightforward explanation for this feature since increased cloudiness should be associated with increased Geosci. Model Dev., 8, 603–618, 2015
LW radiation. Both model and observational data sets are internally consistent (the cloud and radiation components), since the ISCCP radiation data are derived by the cloud data (see Sect. 2.1), while WRF has its own internally consistent physics. The results appear robust since they are reproduced by Garcia-Diez et al. (2014) in a 5-year multi-physics ensemble with the same parameterizations, validated with a different satellite data set. In order to provide satisfying answers to the questions raised by the modelled cloud and radiation biases, several issues should be investigated, including a more detailed analysis of cloud coverage and the various radiation components, i.e. the types of clouds and their impacts on the radiation budget. It is well known that low clouds are thick and nontransparent, reflecting too much SW radiation back to space (high cloud albedo forcing) and – having almost the same temperature as the surface – not greatly affecting the LW radiation. On the other hand, high thin cirrus clouds are highly transparent to SW radiation but they readily absorb LW radiation. Since they are high and therefore cold, they have a large cloud greenhouse forcing. Finally, the deep convective clouds have a neutral effect since the cloud greenhouse and albedo forcings are almost in balance. It is clear from the current study that an in-depth analysis is necessary, including short- and longwave radiation components, both at the surface and at the top of the atmosphere, as well as various cloud properties which are derived by satellites and are available as output variables in WRF (altitude, optical thickness, and cloud albedo). www.geosci-model-dev.net/8/603/2015/
E. Katragkou et al.: Regional climate hindcast simulations within EURO-CORDEX
615
Figure 8. (a) Mean summer and (b) mean winter 1990–2008 total cloud cover bias (WRF-ISCCP).
4
Conclusions
Analysis of the WRF ensemble within the EURO-CORDEX framework indicates that the model can represent the present climate with a reasonable degree of fidelity. Temperatures are, on average, underestimated and the largest temperature spread and biases are seen in winter over northeastern Europe. Precipitation is overestimated in both seasons but with a larger magnitude in summer. These general conclusions apply to all ensemble members; the biases vary depending on the model configuration and the physical parameterizations selected. The configurations appearing to have a more balanced overall behaviour for both precipitation and temperature are WRF-D and WRF-F. Summer temperatures are characterized by a cold bias, more pronounced in northern Europe for the CAM radiation scheme, and a less pronounced or even slight warm bias for southern Europe for the RRTMG radiation scheme. The coldest mean temperature bias in northern Europe is related to an underestimation of SW radiation at the surface and an overestimation of cloud cover, mostly seen in configurations using the GD convective scheme. The summer cold bias is even more pronounced in maximum temperatures, which are largely controlled by cloud cover and SW radiation. The strong positive SW bias occurs in summer in southern Europe, it is mostly induced by the KF or BMJ convective schemes and contributes to a mitigation of the systematic cold bias in WRF. When a convective scheme does not suffer from a positive SW bias, then temperatures are grossly underestimated (in our case WRF-G configurawww.geosci-model-dev.net/8/603/2015/
tion with GD convection). Winter surface temperatures are affected in snow-covered areas in northeastern Europe, as a result of a too-strong response of temperature to snow cover. This underestimation is even more pronounced in minimum temperatures, exhibiting a bias of up to −9 ◦ C over northeastern Europe in winter, and is obviously sensitive to land– atmosphere interactions. The negative sign in the sum of LW+SW bias over northern Europe contributes to the cold biases in the region. The winter cold bias is reduced under the RRTMG versus the CAM radiation scheme. In addition, note that the ERA-Interim has a small (0.4 ◦ C) positive bias in comparison to our reference E-OBS9 climatology. If the driving fields were to suffer from a persistent cold bias they could deteriorate model performance even further. Precipitation overestimation is reported as a typical WRF behaviour, which remains the same or worsens at higher spatial resolutions (Kotlarski et al., 2014). Our current findings are aligned with this finding, with the KF convective scheme exhibiting the highest biases over the Mediterranean in summer. All ensemble members capture winter precipitation better than summer precipitation, the latter being regionally rather than large–scale controlled. There is no specific configuration that totally alleviates the wet bias of WRF either here or according to the literature. This issue points, among other things, towards weaknesses in the convective schemes. Different model domain configurations and data sets also seem to contribute to the precipitation spread. Our study identifies the implementation of SSTs as one important contributing factor. Erroneously, a coarser resolution of Geosci. Model Dev., 8, 603–618, 2015
616
E. Katragkou et al.: Regional climate hindcast simulations within EURO-CORDEX
implemented SSTs (WRF-A_SST) seemingly “corrects” the average WRF wet bias by shifting the average climatology towards a colder, drier winter climate regime. Concluding, we stress the importance of such coordinated evaluation exercises, which aim to highlight systematic biases in model performance and identify the underlying physical mechanisms. The current work concentrates only on the surface components of the radiation balance and leaves other components such as top of the atmosphere, sensible and latent heat fluxes and cloud properties for future analysis. Future analysis including these parameters is necessary for a more complete understanding of the physical mechanisms that are responsible for the occurrence of temperature and precipitation biases. This work is ongoing within the EUROCORDEX WRF groups.
The Supplement related to this article is available online at doi:10.5194/gmd-8-603-2015-supplement.
Acknowledgements. We acknowledge the E-OBS data set from the EU-FP6 project ENSEMBLES (http://ensembles-eu.metoffice. com) and the data providers in the ECA&D project (http://www. ecad.eu). The Aristotle University of Thessaloniki simulations have been produced using the EGI and HellasGrid infrastructures and supported by the Scientific Computing Center at the Aristotle University of Thessaloniki. E. Katragkou acknowledges financial support from the AUTH-Special Account for Research Funds. The contribution from the Centre de Recherche Public – Gabriel Lippmann (CRPGL) (now Luxembourg Institute of Science and Technology) was funded by the Luxemburg National Research Fund through the grant FNR C09/SR/16 (CLIMPACT). G. Alexandri acknowledges financial support from the QUADIEEMS project which is co-financed by the European Social Fund (ESF) and national resources under the operational programme Education and Lifelong Learning (EdLL) within the framework of the action Supporting Postdoctoral Researchers. The contribution from Universidad de Cantabria was funded by the Spanish R&D programme through projects CORWES (CGL2010-22158-C02-01) and WRF4G (CGL2011-28864), co-funded by the European Regional Development Fund. M. García-Díez acknowledges financial support from the EXTREMBLES (CGL2010-21869) project. Edited by: J. C. Hargreaves
Geosci. Model Dev., 8, 603–618, 2015
References Alapaty, K., Herwehe, J. A., Otte, T. L., Nolte, C. G., Bullock, O. R., Mallard, M. S., Kain, J. S., and Dudhia, J.: Introducing subgrid-scale cloud feedbacks to radiation for regional meteorological and climate modeling, Geophys. Res. Lett., 39, L24808, doi:10.1029/2012GL054031, 2012. Boberg, F. and Christensen, J. H.: Overestimation of Mediterranean summer temperature projections due to model deficiencies, Nat. Clim. Chang., 2, 433–436, doi:10.1038/nclimate1454, 2012. Bullock, O. R., Alapaty, K., Herwehe, J. A., Mallard, M. S., Otte, T. L., Gilliam, R. C., and Nolte, C. G.: An Observation-Based Investigation of Nudging in WRF for Downscaling Surface Climate Information to 12-km Grid Spacing, J. Appl. Meteorol. Climatol., 53, 20–33, doi:10.1175/JAMC-D-13-030.1, 2014. Cardoso, R. M., Soares, P. M. M., Miranda, P. M. A., and BeloPereira, M.: WRF high resolution simulation of Iberian mean and extreme precipitation climate, Int. J. Climatol., 33, 2591–2608, doi:10.1002/joc.3616, 2013. Cattiaux, J., Vautard, R., and Yiou, P.: North-Atlantic SST amplified recent wintertime European land temperature extremes and trends, Clim. Dynam., 36, 2113–2128, 2011. Cattiaux, J., Douville, H., Ribes, A., Chauvin, F., and Plante, C.: Towards a better understanding of changes in wintertime cold extremes over Europe: A pilot study with CNRM and IPSL atmospheric models, Clim. Dynam., 40, 2433–2445, 2013. Chen, F., Mitchell, K., Schaake, J., Xue, Y., Pan, H.-L., Koren, V., Duan, Q. Y., Ek, M., and Betts, A.: Modeling of land surface evaporation by four schemes and comparison with FIFE observations, J. Geophys. Res., 101, 7251, doi:10.1029/95JD02165, 1996. Christensen, J. H. and Christensen, O. B.: A summary of the PRUDENCE model projections of changes in European climate by the end of this century, Clim. Change, 81, 7–30, doi:10.1007/s10584-006-9210-7, 2007. Collins, W. D.: Parameterization of generalized cloud overlap for radiative calculations in general circulation models, J. Atmos. Sci., 58, 3224–3242, 2001. Collins, W. D., Rasch, P. J., Boville, B. A., Hack, J. J., McCaa, J. R., Williamson, D. L., Kiehl, J. T., and Briegleb, B.: Description of the NCAR community atmosphere model (CAM 3.0) NCAR Technical Note, NCAR/TN-464+STR, available at: http://hanson.geog.udel.edu/~hanson/hanson/CLD_ GCM_Experiment_S11_files/description.pdf (last access: 14 August 2014), 2004. Dee, D. P., Uppala, S. M., Simmons, A. J., Berrisford, P., Poli, P., Kobayashi, S., Andrae, U., Balmaseda, M. A., Balsamo, G., Bauer, P., Bechtold, P., Beljaars, A. C. M., van de Berg, L., Bidlot, J., Bormann, N., Delsol, C., Dragani, R., Fuentes, M., Geer, A. J., Haimberger, L., Healy, S. B., Hersbach, H., Hólm, E. V, Isaksen, L., Kållberg, P., Köhler, M., Matricardi, M., McNally, A. P., Monge-Sanz, B. M., Morcrette, J.-J., Park, B.-K., Peubey, C., de Rosnay, P., Tavolato, C., Thépaut, J.-N., and Vitart, F.: The ERA-Interim reanalysis: configuration and performance of the data assimilation system, Q. J. R. Meteorol. Soc., 137, 553–597, doi:10.1002/qj.828, 2011. Déqué, M., Rowell, D. P., Lüthi, D., Giorgi, F., Christensen, J. H., Rockel, B., Jacob, D., Kjellström, E., Castro, M., and Hurk, B.: An intercomparison of regional climate simulations for Europe:
www.geosci-model-dev.net/8/603/2015/
E. Katragkou et al.: Regional climate hindcast simulations within EURO-CORDEX assessing uncertainties in model projections, Clim. Change, 81, 53–70, doi:10.1007/s10584-006-9228-x, 2007. Di Luca, A., Flaounas, E., Drobinski, P., and Brossier, C. L.: The atmospheric component of the Mediterranean Sea water budget in a WRF multi-physics ensemble and observations, Clim. Dynam., 43, 2349–2375, 2014. Evans, J.P., Ekström, M., and Ji, F.: Evaluating the performance of a WRF physics ensemble over South-East Australia, Clim. Dynam., 39, 1241–1258, 2012. Flato, G., Marotzke, J., Abiodun, B., Braconnot, P., Chou, S., Collins, W., Cox, P., Driouech, F., Emori, S., Eyring, V., Forest, C., Glecker, P., Guilyardi, E., Jacob, C., Kattsov, V., Reason, C., and Rummukainen, M.: Evaluation of Climate Models, in: Climate Change 2013: The Physical Science Basis. Contribution of Working Group I to the Fifth Assessment Report of the Intergovernmental Panel on Climate Change, Cambridge University Press, Cambridge, United Kingdom and New York, NY, USA, 2013. García-Díez, M., Fernández, J., Fita, L., and Yague, C.: Seasonal dependence of WRF model biases and sensitivity to PBL schemes over Europe, Q. J. R. Meteorol. Soc., 139, 501–514, doi:10.1002/gj.1976, 2012. García-Díez, Markel, Fernández, J., and Vautard, R.: An RCM Multi-Physics Ensemble over Europe: Multi-Variable Evaluation to Avoid Error Compensation, Clima. Dynam., 1–16. doi:10.1007/s00382-015-2529-x, 2015. Giorgi, F., Jones, C. and Asrar, G. R.: Addressing climate information needs at the regional level?: the CORDEX framework, WMO Bull., 58, 175–183, 2009. Giorgi, F., Coppola, E., Solmon, F., Mariotti, L., Sylla, M., Bi, X., Elguindi, N., Diro, G., Nair, V., Giuliani, G., Turuncoglu, U., Cozzini, S., Güttler, I., O’Brien, T., Tawfik, A., Shalaby, A., Zakey, A., Steiner, A., Stordal, F., Sloan, L. and Brankovic, C.: RegCM4: model description and preliminary tests over multiple CORDEX domains, Clim. Res., 52, 7–29, doi:10.3354/cr01018, 2012. Grell, G. A. and Dévényi, D.: A generalized approach to parameterizing convection combining ensemble and data assimilation techniques, Geophys. Res. Lett., 29, 34–38, doi:10.1029/2002GL015311, 2002. Hall, A. and Qu, X.: Using the current seasonal cycle to constrain snow albedo feedback in future climate change, Geophys. Res. Lett., 33, L03502, doi:10.1029/2005GL025127, 2006. Haylock, M. R., Hofstra, N., Klein Tank, A. M. G., Klok, E. J., Jones, P. D., and New, M.: A European daily highresolution gridded data set of surface temperature and precipitation for 1950–2006, J. Geophys. Res., 113, D20119, doi:10.1029/2008JD010201, 2008. Herwehe, J. A., Alapaty, K., Spero, T. L., and Nolte, C. G.: Increasing the credibility of regional climate simulations by introducing subgrid-scale cloud-radiation interactions, J. Geophys. Res., 119, 5317–5330, 2014. Hong, S. and Lim, J.: The WRF single-moment 6-class microphysics scheme (WSM6), J. Korean Meteor. Soc., available at: http://www.mmm.ucar.edu/wrf/users/docs/WSM6-hong_and_ lim_JKMS.pdf (last access: 14 August 2014), 2006. Hong, S.-Y., Dudhia, J., and Chen, S.-H.: A Revised Approach to Ice Microphysical Processes for the Bulk Parameterization of Clouds and Precipitation, Mon. Weather Rev., 132, 103–120,
www.geosci-model-dev.net/8/603/2015/
617
doi:10.1175/1520-0493(2004)1322.0.CO;2, 2004. Hong, S.-Y., Noh, Y., and Dudhia, J.: A New Vertical Diffusion Package with an Explicit Treatment of Entrainment Processes, Mon. Weather Rev., 134, 2318–2341, doi:10.1175/MWR3199.1, 2006. Iacono, M. J., Delamere, J. S., Mlawer, E. J., Shephard, M. W., Clough, S. A., and Collins, W. D.: Radiative forcing by long-lived greenhouse gases: Calculations with the AER radiative transfer models, J. Geophys. Res., 113, D13103, doi:10.1029/2008JD009944, 2008. Ji, F., Ekström, M., Evans, J. P., and Teng, J.: Evaluating rainfall patterns using physics scheme ensembles from a regional atmospheric model, Theor. Appl. Climatol., 115, 297–304, 2014. Kain, J. S.: The Kain–Fritsch Convective Parameterization: An Update, J. Appl. Meteorol., 43, 170–181, doi:10.1175/15200450(2004)0432.0.CO;2, 2004. Kotlarski, S., Keuler, K., Christensen, O. B., Colette, A., Déqué, M., Gobiet, A., Goergen, K., Jacob, D., Lüthi, D., van Meijgaard, E., Nikulin, G., Schär, C., Teichmann, C., Vautard, R., Warrach-Sagi, K., and Wulfmeyer, V.: Regional climate modeling on European scales: a joint standard evaluation of the EUROCORDEX RCM ensemble, Geosci. Model Dev., 7, 1297–1333, doi:10.5194/gmd-7-1297-2014, 2014. Mooney, P. A., Mulligan, F. J., and Fealy, R.: Evaluation of the sensitivity of the weather research and forecasting model to parameterization schemes for regional climates of europe over the period 1990–95, J. Climate, 26 1002–1017, 2013. Mystakidis, S., Zanis, P., Dogras, C., Katragkou, E., Pytharoulis, I., Melas, D., Anadranistakis, E., and Feidas, H.: Optimization of a Regional Climate Model for High Resolution Simulations over Greece, in: Adv. Meteorol. Climatol. Atmos. Phys., edited by: Helmis, C. G. and Nastos, P. T., SE – 89, Springer Berlin Heidelberg, 623–629, 2013. Pincus, R., Platnick, S., Ackerman, S. A., Hemler, R. S., and Patrick Hofmann, R. J.: Reconciling Simulated and Observed Views of Clouds: MODIS, ISCCP, and the Limits of Instrument Simulators, J. Climate, 25, 4699–4720, doi:10.1175/JCLI-D-1100267.1, 2012. Posselt, R., Mueller, R. W., Stöckli, R., and Trentmann, J.: Remote sensing of solar surface radiation for climate monitoring – the CM-SAF retrieval in international comparison, Remote Sens. Environ., 118, 186–198, doi:10.1016/j.rse.2011.11.016, 2012. Rauscher, S. A., Coppola, E., Piani, C. and Giorgi, F.: Resolution effects on regional climate model simulations of seasonal precipitation over Europe, Clim. Dynam., 35, 685–711, doi:10.1007/s00382-009-0607-7, 2010. Rossow, W. B. and Schiffer, R. A.: Advances in Understanding Clouds from ISCCP, Bull. Am. Meteorol. Soc., 80, 2261–2287, doi:10.1175/1520-0477(1999)0802.0.CO;2, 1999. Rummukainen, M.: State-of-the-art with regional climate models, Wiley Interdiscip, Rev. Clim. Chang., 1, 82–96, doi:10.1002/wcc.8, 2010. Sanchez-Lorenzo, A., Wild, M., and Trentmann, J.: Validation and stability assessment of the monthly mean CM SAF surface solar radiation dataset over Europe against a homogenized surface dataset (1983–2005), Remote Sens. Environ., 134, 355–366, doi:10.1016/j.rse.2013.03.012, 2013.
Geosci. Model Dev., 8, 603–618, 2015
618
E. Katragkou et al.: Regional climate hindcast simulations within EURO-CORDEX
Skamarock, W. C., Klemp, J. B., Dudhia, J., Gill, D. O., Barker, D. M., Duda, M. G., Huang, X.-Y., Wang, W., and Powers, J. G.: A description of the advanced research WRF version 3, available at: http://oai.dtic.mil/oai/oai?verb=getRecord&metadataPrefix= html&identifier=ADA487419 (last access: 14 August 2014), 2008. Soares, P. M. M., Cardoso, R. M., Miranda, P. M. A., Medeiros, J., Belo-Pereira, M., and Espirito-Santo, F.: WRF high resolution dynamical downscaling of ERA-Interim for Portugal, Clim. Dynam., 39, 2497–2522, doi:10.1007/s00382-012-1315-2, 2012. Stegehuis, A. I., Teuling, A. J., Ciais, P., Vautard, R., and Jung, M.: Future European temperature change uncertainties reduced by using land heat flux observations, Geophys. Res. Lett., 40, 2242–2245, doi:10.1002/grl.50404, 2013. Sundqvist, H., Berge, E., and Kristjánsson, J. E.: Condensation and Cloud Parameterization Studies with a Mesoscale Numerica Weather Prediction Model, Mon. Weather Rev., 117, 1641–1657, 1989. Taylor, K. E.: Summarizing multiple aspects of model performance in a single diagram, J. Geophys. Res., 106, 7183, doi:10.1029/2000JD900719, 2001. Taylor, K. E., Stouffer, R. J., and Meehl, G. A.: An overview of CMIP5 and the experiment design, Bull. Am. Meteorol. Soc., 93, 485–498, 2012. Torma, C., Coppola, E., Giorgi, F., Bartholy, J., and Pongrácz, R.: Validation of a high-resolution version of the regional climate model RegCM3 over the Carpathian basin, J. Hydrometeorol., 12, 84–100, doi:10.1175/2010JHM1234.1, 2011.
Geosci. Model Dev., 8, 603–618, 2015
Trenberth, K. E. and Shea, D. J.: Relationships between precipitation and surface temperature, Geophys. Res. Lett., 32, 1–4, 2005. Van der Linder, P.: ENSEMBLES: Climate Change and Its Impacts: Summary of Research and Results from the ENSEMBLES Project, Exeter, 2009. Vautard, R., Gobiet, A., Jacob, D., Belda, M., Colette, A., Déqué, M., Fernández, J., García-Díez, M., Goergen, K., Güttler, I., Halenka, T., Karacostas, T., Katragkou, E., Keuler, K., Kotlarski, S., Mayer, S., Meijgaard, E., Nikulin, G., Patarˇci´c, M., Scinocca, J., Sobolowski, S., Suklitsch, M., Teichmann, C., Warrach-Sagi, K., Wulfmeyer, V., and Yiou, P.: The simulation of European heat waves from an ensemble of regional climate models within the EURO-CORDEX project, Clim. Dynam., 41, 2555–2575, doi:10.1007/s00382-013-1714-z, 2013. Warrach-Sagi, K., Schwitalla, T., Wulfmeyer, V., and Bauer, H.-S.: Evaluation of a climate simulation in Europe based on the WRF– NOAH model system: precipitation in Germany, Clim. Dynam., 41, 755–774, doi:10.1007/s00382-013-1727-7, 2013. Zaviša, I. J.: Comments on “Development and Evaluation of a Convection Scheme for Use in Climate Models”, J. Atmos. Sci., 57, 3686–3686, 2000. Zhang, Y., Rossow, W. B., Lacis, A. A., Oinas, V., and Mishchenko, M. I.: Calculation of radiative fluxes from the surface to top of atmosphere based on ISCCP and other global data sets: Refinements of the radiative transfer model and the input data, J. Geophys. Res., 109, D19105, doi:10.1029/2003JD004457, 2004.
www.geosci-model-dev.net/8/603/2015/