low-cost ADC testing [6]. In order to estimate static errors from spectral analysis, the first part of our work is to investigate whether the dynamic test parameters ...
Evaluation of ADC Static Parameters via the Frequency Domain F. Azaïs, S. Bernard, Y. Bertrand, M. Comte and M. Renovell LIRMM – University of Montpellier 161, rue ADA, 34 392 Montpellier, France {azais, bernard, bertrand, comte, renovell}@lirmm.fr
Keywords:
ADC testing, static parameters, spectral analysis.
and
dynamic
Abstract In order to reduce the cost of the test procedure for ADCs, it would be of great interest to evaluate static performances via the frequency domain. Indeed, estimating static parameters from spectral analysis would permit to extract the complete set of ADC parameters (both static and dynamic) with shorter processing time and reduced hardware resources. Results presented in this paper concern the influence of static errors on the classical dynamic parameters. It is shown that under appropriate test conditions, the dynamic parameters extracted from a standard FFT exhibit significant variations allowing the detection of ADC offset, gain and non-linearity errors.
1 Introduction
Due to the considerable evolution of
Analog-to-Digital Converters (ADC) in terms of resolution and/or speed, testing ADC frequently contributes to half the price of the device itself. Moreover, the whole set of performance features cannot be obtained by a single test. Two kinds of parameters actually define a converter, one related to its transfer function (static parameters), and another that expresses the deformation induced on the converted signal (dynamic parameters). Both require a specific test method [1]: a histogram-based approach (static test) is usually coupled to a spectral analysis (dynamic test). The histogram test technique is based on a statistical analysis of how many times each code appears on the ADC output for a given input signal [2,3]. Comparing and processing the histograms obtained with a real ADC and with an ideal one, it enables the evaluation of static parameters such as offset, gain, and non-linearity errors of the ADC. The main disadvantage of the histogram test technique resides in the high number of samples required to achieved statistically satisfactory results. The required number of samples can become unacceptably large for high resolution converter, especially in presence of noise. Even present day Automated Test Equipment (ATE) has problems with the efficient handling and processing of such large sample sets. On the other hand, spectral analysis of ADC is based on the exploitation of the Fourier transform of the digital samples acquired at the converter output when a pure sine
wave is applied to its input [4]. The resulting spectrum is analyzed to evaluate the following parameters characteristic of the ADC dynamic performances: the SINAD (SIgnal-toNoise And Distortion ratio), the effective number of bits (neff), the THD (Total Harmonic Distortion), the SFDR (Spurious Free Dynamic Range), and the mean noise level (Bm). Since relatively small sample sets are usually sufficient to get good estimates of the ADC dynamic parameters, one great advantage of this technique is clearly the short processing time. However, this testing method presents a lack of information about the transfer function of the ADC and its related static parameters. To summarize, one test technique allows us to determine static parameters while the other one enables to measure dynamic parameters. As these two kinds of parameters define the ADC behavioral performances, they clearly dependent on each other. The objective of this work is to find the relationship between static and dynamic parameters in order to estimate the whole set of ADC parameters from a single test procedure [5]. Concerning the choice of this test procedure, the spectral analysis seems to be preferable to the histogram method because it is more representative of the converter running reality. Moreover, it requires less samples, which means a shorter processing time and reduced storage resources, two major considerations in the perspective of low-cost ADC testing [6]. In order to estimate static errors from spectral analysis, the first part of our work is to investigate whether the dynamic test parameters are sensitive to ADC static errors and under which test conditions. The paper is organized as follows. Section 2 and section 3.1 remind the results previously presented in [7] concerning the influence of test conditions, offset and gain errors on the dynamic parameters measurement. Then, the influence of non-linearity errors is treated in section 3.2. The study of non-linearity errors is more complex than the one of other static errors. Thus, this section is divided in two parts: firstly a study of influence of a single non-linearity on one code, secondly the influence of different shapes of global nonlinearity. Finally, section 4 gives some concluding remarks.
2 Influence of test conditions on the dynamic parameters measurement
The
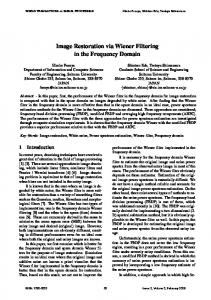
typical test setup for ADC dynamic testing on a classical ATE is illustrated in figure 1. This setup has been implemented using the HP-VEE software programming
interface and a behavioral model of the converter (ideal or affected by offset, gain and non-linearity errors) has been developed. Waveform Synthesizer
stimulus
n bits
ADC analog
010 110 100
Capture Memory
digital
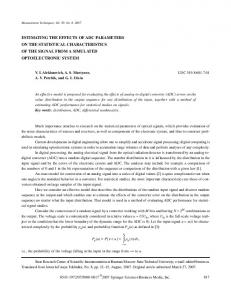
3 Influence of static errors on the dynamic parameters 3.1 Influence of offset and gain errors We study the evolution of the dynamic parameters in presence of an offset error ranging between -2LSB and +2LSB. Results are presented in figure 2 in terms of relative error on the measured parameters SINAD and THD.
Synchronization
2 o ffset (LS B )
0 CPU: Digital Signal Processor
Fig. 1: Typical test setup
The work consists in evaluating the influence of the test conditions on the dynamic parameters. Various experiments have been conducted varying the number of samples considered to perform the Fast Fourier Transform (FFT), the number of periods of the input sine-wave during the acquisition, and the input signal amplitude. It appears that the classical dynamic parameters, i.e. SINAD, SFRD and THD are neither sensitive to the number of samples nor to the number of input periods, demonstrating that the impact of static errors on dynamic parameters can be evaluated independently of these test conditions. In contrast, the dynamic parameters are sensitive to the signal amplitude, especially the THD parameter. For instance, an amplitude deviation of less than 0.1LSB (LSB stands for Least Significant Bit; 1LSB equals the ideal analog variation between two successive codes) might result in a variation of 20dB or more in the measured THD, corresponding to a measurement uncertainty of about 40%. Note that this high sensitivity is actually observed in case of a signal amplitude lower than the full scale (FS) range of the converter, which is the type of signal usually applied in conventional dynamic testing. Applying a signal with an amplitude higher than FS results in a reduced sensitivity. Consequently, the evaluation of the static errors impact on the dynamic parameters has to be conducted with respect to the input signal amplitude. In particular, one should distinguish between the case of a signal amplitude lower or higher than FS, since measurement uncertainty may differ by more than one order of magnitude. As an illustration, table 1 summarizes the variations induced by an amplitude deviation of ±0.1LSB together with the corresponding measurement uncertainty in case of a signal peak-to-peak amplitude 2LSB lower or higher than FS.
SINAD SFDR THD
Ain=FS-2LSB ∆ (dB) ε (%) 0.4 1 1 2 25 40
Ain=FS+2LSB ε (%) ∆ (dB) 0.4 1 0.7 2 0.8 2
Table 1: Measurement uncertainty due to ±0.1LSB deviation of the input signal amplitude
-2 -4 -6 -8 -10
2A =FS-2q
-12
2A =FS+2q
-14 -16 25 20 15 10 5 0 -5 -10 -15 -20 -25 -30
o ffset (LS B )
2A =FS-2q 2A =FS+2q
Fig. 2: Relative deviation of the dynamic parameters SINAD and THD due to an offset error
Analyzing these results, it appears that two different behaviors are observed depending on whether the input signal amplitude is lower or higher than FS. We observe monotonous variation of the dynamic parameters with the offset error when the amplitude is higher than FS, which is not the case for an amplitude lower than FS. Such a monotonous variation is of great interest for the determination without ambiguity of the offset error from the dynamic parameter measurement. In addition, reporting measurement uncertainties (as previously established) on these graphs reveals that offset detection is enabled in a larger range when using a signal amplitude higher than FS. For illustration, the use of an input signal with amplitude higher than FS leads to the detection of offset errors as low as ±0.2LSB (through THD measurement), while the use of an input signal with amplitude lower than FS permits to detect errors only if higher than ±1.4LSB (through SINAD measurement). In the same way, the evolution of the dynamic parameters in presence of a gain error has been investigated. Results are presented in figure 3 in terms of relative error on the measured dynamic parameters.
IN L value (LS B )
15
-25
0 -0,2 0 -0,4 -0,6 -0,8 -1 -1,2 -1,4 -1,6 -1,8 -2
140
6
10 5 g ain (LS B )
0 -5 -10 2A =FS-2q
-15
2A =FS+2q
-20
2A =FS-2q
120
2A =FS+2q
100
5
80
4
60
3
40
0,2
0,4
0,6
0,8
1
2A =FS-2q 2A =FS+2q
2A =FS-2q 2A =FS+2q
2
20 g ain (LS B )
0
1
-20
0
IN L value (LS B )
-40
0
0,2
0,4
0,6
0,8
1
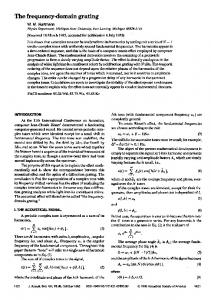
Fig. 3: Relative deviation of the dynamic parameters SINAD and THD due to a gain error
Fig. 4: Relative deviation of the dynamic parameters SINAD and THD due to a unique INL on the tenth code.
As for the detection of an offset error, it appears more performing to use an input signal with amplitude higher than FS which permits the detection of gain errors as low as ±0.2LSB, while the use of an input signal with amplitude lower than FS only allows to detect errors if higher than -2.5LSB.
The analysis of these results reveals a relatively different behavior of the dynamic parameters than when considering offset or gain errors. Indeed, we observe in this case a monotonic variation of the dynamic parameters both for a signal amplitude lower and higher than FS, but with a higher sensitivity for a signal amplitude lower than FS. Introducing the measurement uncertainty in the analysis, it arises that the use of a signal amplitude lower than FS leads to better detection results for the dynamic parameters. Hence, in contrast with offset or gain detection results, it appears more performing to use an input signal with amplitude lower than FS. Further simulations considering more complex shapes of INL enable to generalize this observation to any INL influence. Far from making up an impediment to the evaluation of static parameters from the deviation of the dynamic parameters deviation, this increased sensitivity upon static faults under different conditions may outline a test strategy. Indeed, it would be of great interest to take advantage of both test conditions in terms of input signal amplitude to determine as precisely as possible each distinct static influence. Though the THD is more sensitive to nonlinearity error, it would be preferable to consider only the SINAD in the case of an amplitude lower than FS. Indeed, under this test condition, the THD measurement uncertainty is considerable and that prevents to determine precisely static influence. Afterwards, we will only consider the SINAD parameter variation.
3.2 Influence of non-linearity errors Once the influence of offset and gain errors estimated, the evolution of the dynamic parameters in presence of nonlinearity errors has been investigated. While offset and gain errors can be clearly and fully defined by a value, non-linearity errors require to be cautiously considered. Indeed, only the maximal value of the non-linearity among the ADC codes is usually taken into account, but several types of non-linearity errors may be expressed by the same maximal value. Restricting the description of a nonlinearity to its maximum value leads to a lack of information, insofar as different types of non-linearity errors with the same peak values will not have the same impact on the dynamic parameters. Therefore, various cases of non-linearity have been considered. To begin with, an unique integral non-linearity (INL) has been introduced in the transfer curve of the ADC model, on each code of a 6 bit ADC successively. For illustration, figure 4 gives the results observed for an increasing positive INL value located exclusively on the tenth code. The study is restricted to INL values comprised between 0 and 1LSB insofar as a greatest value would imply a missing code.
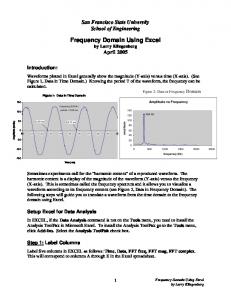
Comparing the respective impact of an integral nonlinearity on each code successively, a weighting effect appears depending on which code is affected. In particular, the presence of a non-linearity on an extreme code (one of the first or one of the last codes) induces a much more noticeable relative error on the extracted dynamic parameters than an INL of the same value located on a middle code. Figure 5 shows the influence of an isolated INL on the SINAD measurement of a 6 bit ADC with respect to the introduced INL value with an input signal amplitude 2LSB lower than FS. Each curve corresponds to a different INL position, varying from code 1 to code 32. Note that a unique INL, with a value inferior to 1LSB, leads to a minor global non-linearity. Therefore, the relative errors observed in this study case remain in a hardly detectable range. We will see hereafter that a more realistic INL model leads to more significant error values.
1,1 m ax 0.1LS B
1 0,9
m ax 0.3LS B
0,8 0,7
m ax 0.4LS B
0,6 0,5
m ax 0.6LS B
0,4 0,3
m ax 0.8LS B
0,2 0,1
m ax 1LS B
-0,5 0
0,2
0,4
0,6
0,8
A D C code
m ax IN L value (LS B )
0 -2
0,2
0,4
0,6
0,8
1
-4 -6 -8
2A =FS-2q 2A =FS+2q
Fig. 6: Parabolic INL & its influence on the SINAD
-2,5
-4
0
-12
-2
-4,5
m ax 0.9LS B
1
-1,5
-3,5
m ax 0.7LS B
-10
-1
-3
m ax 0.5LS B
0
IN L value (LS B )
0
m ax 0.2LS B
Code 4 Code 3 Code 2 Code 1
-5
Fig. 5: Relative deviation of the SINAD due to an INL affecting a unique code, from code 1 to code 32.
The greatest deviation of the SINAD parameter is observed when an INL is introduced on code 1, and the impact of a given INL decreases according to its location in the ADC transfer curve up to code 32. The sensitivity of the dynamic parameters to the INL influence, depending on the position of the affected code, is linked to the input signal sinusoidal shape. Indeed, due to the steepest slope nearby the signal mean value, the middle codes less affect the ADC response than the other codes. This explains why their impact on the ADC output spectrum and the related dynamic parameters is lessen in comparison with the influence of the other codes. The second part of the non-linearity influence study takes into consideration some realistic INL types. Any shape of INL along the ADC codes can be modeled with a polynomial expression. We consider that the second order of the polynomial form dominates higher orders. Consequently, we analyze in a first time a parabolic INL, with a maximum value ranging between 0 and 1LSB. The INL error and the induced relative error on the dynamic parameters are shown figure 6.
As already observed in the case of a unique INL isolated on one code, the sensitivity of the measured parameters is higher when the input signal amplitude is inferior to the ADC full scale. This result can be generalized to all the INL shapes. Comparing the relative deviation of the SINAD induced by a single non-linearity on a code with the one corresponding to an ADC affected by a parabolic INL, it is obvious that we should not take into account only the maximal value to describe an INL in the perspective of non-linearity detection. Indeed, if the maximal value was a data complete enough to describe an INL, we should obtain the same SINAD deviation, at an given maximal INL value, in case of a unique INL as in case of a parabolic one. On the contrary, we can clearly see that the different INL values along the ADC codes have a cumulative effect on the dynamic parameters. In order to illustrate this phenomenon, several INL shapes have been studied to get clues to define the cumulative system of INL values that would enable to estimate the influence of any INL type on the SINAD parameter. Figure 7 represents some INL shapes and the relative deviation they induce on the SINAD .
INL value (LSB) 0
ADC codes
1
INL value (LSB) 0
INL value (LSB) 0
2 ADC codes
INL value (LSB) 0 ADC codes
ADC codes 4
3
5 m a x IN L v a l u e ( LS B )
0 0
0 ,2
0 ,4
0 ,6
0 ,8
1
-5
3 -1 0
1 2
-1 5
4 -2 0
Fig. 7: Several INL shapes and their influence on SINAD
These results are coherent with the observations made in the case of a parabolic INL. The cumulative effect of the INL contributions at the code level induce different SINAD deviations for the same maximal INL value with respect to the global INL shape. Consequently, we investigated whether a weighted system of the INL values along the codes could be found to deduce the extracted parameters deviation of any INL shape from each code INL value. Trivial weighted systems consist in associating a weighting coefficient to each contribution, and enable linear operations. Consequently, when each contribution is multiplied by two, so is the weighted sum of the contributions. The SINAD relative deviation is not a linear weighted sum of each code INL. Indeed, the SINAD deviation is not multiplied by two when the maximal INL value, and therefore each elementary INL value, is twice higher. More generally, the SINAD relative error is not a linear function of the INL contributions. The correlation function linking every code contribution in terms of INL to the global INL shape is not obvious, and deeper investigations are being performed.
4 Conclusion
In this study, we have evaluated the influence of ADC static errors on the dynamic parameters extracted from a classical FFT. The objective is to determine whether spectral analysis could enable the characterization of both static and dynamic behavior of an ADC under test. This would permit to avoid the histogram-based approach classically used for static evaluation, resulting in a lowcost test procedure for ADCs.
In the first part of the study, the influence of the experimental setup on the measurement of the dynamic parameters have been investigated. It appears that the dynamic parameters are not sensitive to the number of samples or the number of input periods but to the signal amplitude. This is particularly true for the THD measurement in case of a classical input signal with an amplitude slightly lower than FS. A measurement uncertainty has been associated to each dynamic parameter taking into account that it is extremely difficult to precisely adjust the signal amplitude in a real environment. The second part of the study has been dedicated to the influence of static errors on the measurement of the dynamic parameters. It appears that under appropriate test conditions, the dynamic parameters exhibit significant variations against static errors, allowing the detection of errors as low as some few tenths of LSB. In particular, it has been established that, although conventional testing uses an input signal with amplitude slightly lower than FS, the use of an input signal with amplitude slightly higher than FS enhances the detection of both offset and gain errors. At the opposite, the detection of non-linearity errors is more performing using an input signal with amplitude lower than FS. Concerning the study of a single INL error, it appears that the INL influence depends on the affected code. Consequently, in a case of global INL , we should take into account the weight of each code in order to define a relationship between a INL shape and its influence on the dynamic parameter value.
5 References [1] J. Doernberg, H.S. Lee, D.A. Hodges, "Full-Speed Testing of A/D Converters", IEEE Journal of Solid State Circuits, Vol 19., No. 6, pp. 820-827, 1984. [2] M. Mahoney, "DSP-Based Testing of Analog and Mixed-Signal Circuits", IEEE Computer Society Press, ISBN 0-8186-0785-8, 1987. [3] T. Kuyel, "Linearity Testing Issues of Analog to Digital Converters", Proc. International Test Conference, pp. 747-756, 1999. [4] Y. Yenq, "Measuring Harmonic Distortion and Noise Floor of an A/D Converter Using Spectral Averaging", IEEE Transactions on Instrumentation and Measurement, Vol37. pp 525-528, 1988. [5] H.S. Mendonça, J.M. Silva, J.S. Matos, "A Comparison of ADC Dynamic Test Methods", Proc. Design of Circuits and Integrated Systems Conference, pp. 102107, 2000. [6] N. Csizmadia, A.J.E.M. Janssen, "Estimating the Integral Non-Linearity of AD-Converters via the Frequency Domain", Proc. International Test Conference, pp. 757-762, 1999. [7] F. Azaïs, S. Bernard, M. Comte, Y. Bertrand and M. Renovell, "Estimating Static Parameters of A-to-D Converters from Spectral Analysis", Proc. IEEE Latin American Test Workshop, pp. 51-57, 2002.