PRODUCT APPLICATION FOCUS
Evaluation of arrayed primer extension for TP53 mutation detection in breast and ovarian carcinomas Pedro Kringen1, Anna Bergamaschi1, Eldri Undlien Due1, Yun Wang1, Elda Tagliabue2, Jahn M. Nesland1, Aune Nehman3, Neeme Tönisson3, and Anne-Lise Børresen-Dale1 BioTechniques 39:755-761 (November 2005) doi 10.2144/000112000
Mutations in the tumor suppressor gene TP53 are associated with a wide range of different cancers and may have prognostic and therapeutic implications. Methods for rapid and sensitive detection of mutations in this gene are therefore required. In order to make screening more effective, a commercially available TP53 genotyping microarray from Asper Biotech has been constructed by arrayed primer extension (APEX). The present study is the first report that blindly evaluates the efficiency of the second generation APEX TP53 genotype chip outside the Asper laboratory and compares it to temporal temperature gradient electrophoresis (TTGE) and sequencing of TP53 for mutation detection in ovarian and breast cancer samples. All nucleotides in the TP53 gene from exon 2–9 are included on the chip by synthesis and application of sequence-specific oligonucleotides. The chip was validated by screening 48 breast and 11 ovarian cancer cases, all of which had previously been analyzed by TTGE and sequencing. APEX scored 17 of 20 sequence variants, missing one deletion, one insertion, and a missense mutation. Resequencing efficiency using APEX was 92% for both DNA strands and 99.5% for sense and/or antisense strand. We conclude that the APEX TP53 microarray is a robust, rapid, and comprehensive screening tool for sequence alterations in tumors.
INTRODUCTION Somatic alterations in the tumor suppressor gene TP53 are the most frequent findings in a wide range of different cancers. In breast tumors, around 30% of the cases are found to have a mutated TP53 gene (1), and the presence of an alteration has been associated with unfavorable prognosis (2–4). It has also been shown that breast cancer patients with specific TP53 mutations have different responses to therapy (5–10). Thus, screening and identification of mutations in this gene may have important implications for prognosis and cancer treatment. A variety of screening methods are currently in use, all of which have limitations regarding sensitivity, specificity, cost, or amount of work needed for detection of mutations (11,12). Screening of the TP53 gene is a laborious task, as many of the tumor samples have low amount of mutated cells caused by infiltrating nontumor cells or large clonal variation within the tumor. Mutations that affect TP53 activity may therefore easily be missed. This leads to an incomplete knowledge of the effect of these mutations on tumor aggressiveness and chemoresistance. It is important to detect these mutations as early as possible during tumor formation in order to select the proper therapy. This implies that methods that are fast, 1The
reliable, cost-effective, and have a high sensitivity should be applied. In the current study, we used an arrayed primer extension (APEX) assay to identify mutations in the TP53 gene in 48 cases with primary breast cancer. The arrays are commercially available and were designed by Asper Biotech (www. asperbio.com; Tartu, Estonia). All samples were screened blindly and compared with the results obtained from temporal temperature gradient electrophoresis (TTGE) followed by direct sequencing of the aberrant migrating bands. Eleven late-stage high-grade ovarian cancer cases positive for p53 immunohistochemistry (IHC) staining but negative after an initial TTGE screening were also included in this study and screened by APEX followed by sequencing and a second TTGE. MATERIALS AND METHODS Patient Material Tumor samples in this study came from 48 primary breast carcinomas and 11 patients with advanced ovarian carcinomas. All patients had primary surgery, and tumor tissues
Norwegian Radium Hospital, Oslo, Norway, 2Istituto Nazionale per lo Studio e la Cura dei Tumori, Milano, Italy, and of Tartu, Tartu, Estonia
3University
Vol. 39, No. 5 (2005)
BioTechniques 755
PRODUCT APPLICATION FOCUS obtained immediately after surgery were snap-frozen in liquid nitrogen. Formalin-fixed paraffin-embedded tissue from each patient was used for IHC. All tumors had been classified and graded based on World Health Organization (WHO) criteria. Hematoxylin and eosin-stained sections were used to evaluate the percentage of tumor cells. The range of tumor cells in the breast cancer samples was from a few percent to 100% with a median of 60%, and the range of ovarian tumor cells was from 20% to 90% with a median of 70%. DNA was isolated from tumor tissue using chloroform/phenol extraction followed by ethanol precipitation (Model 340A nucleic acid extractor; Applied Biosystems, Foster City, CA, USA) according to standard procedures. DNA Arrays The APEX assay is performed in two dimensions on a glass array of oligonucleotides immobilized via the 5′ end. The oligonucleotides are attached to the surface of the slide in a grid, and each nucleotide of exon 2–9 in the TP53 gene is identified by two unique 25-mer oligonucleotides, one each for the sense and the antisense strand. PCR products are denatured and annealed to the oligonucleotide primers flanking the nucleotides to be identified. The primers are extended by DNA polymerase using four different fluorescent-labeled terminator nucleotides. Each of the terminators identifies one base in the target sequence (for more information go to www.asperbio.com/APEX.htm). PCR and DNA Fragmentation Exon 2–9 of the TP53 gene were amplified from genomic DNA in three products using PCR. The 25-μL PCR contained 10× PCR buffer [800 mM Tris-HCl, pH 9.4–9.5, 200 mM (NH4)2SO4, 0.2% Tween® 20; Solis Biodyne, Tartu, Estonia], 2.5 mM MgCl2, dNTP-mixture (2.5 mM dATP, dCTP, dGTP, 2.0 mM dTTP, and 0.5 mM dUTP; Applied Biosystems), 1 U Hot FirePol® DNA polymerase (Solis Biodyne), 50–100 ng genomic DNA, and 20–50 pmol of each primer. For more information about primers and product size, see Table 1. All PCRs were performed with an initial step of DNA polymerase activation for 15 min at 95°C, followed by 35 cycles of 95°C for 20 s, 62°C for 30 s, and 72°C for 40 s. A final elongation step for 10 min at 72°C was added. The products were purified using Jet Quick Spin Columns (GenoMed, St. Louis, MO, USA). Inactivation of unincorporated dNTPs and fragmentation of the products were performed by adding 1 U shrimp alkaline phosphatase (United States Biochemical, Cleveland, OH, USA) and 2 U thermolabile uracil N-glycosylase (UNG; Epicenter Technologies, Madison, WI, USA) and heated at 37°C for 60 min followed by UNG inactivation at 95°C for 10 min (13). Resequencing by APEX The arrays were pretreated before use by a quick dip in 95°C Milli-Q® water (Millipore, Billerica, MA, USA) followed by a 100 mM NaOH wash for 10 min and three final washes in 95°C Milli-Q water for 2 min. The APEX reaction 756 BioTechniques
Table 1. Primers Used for the APEX Method Primer Exon 5′-TGGAAGTGTCTCATGCTGGA-3′ 5′-ATACGGCCAGGCATTGAAGT-3′ 5′-TCTGTCTCCTTCCTCTTCCT-3′ 5′-CACTGACAACCACCCTTAAC-3′ 5′-CCTGCTTGCCACAGGTCT-3′ 5′-GCCCCAATTGCAGGTAAAAC-3′
Size Strand (bp)
Two - 4
704
Five - 6
456
Seven - 9 1020
Sense Antisense Sense Antisense Sense Antisense
APEX, arrayed primer extension.
consisted of 21–25 μL Milli-Q water, 6–10 μL fragmented DNA, 5 U (35 U/μL) Thermo Sequenase™ DNA polymerase (Amersham Biosciences, Little Chalfont, Buckinghamshire, UK) diluted in 4 μL 10× Thermo Sequenase reaction buffer (supplied with the DNA polymerase), and 1 μL (50 μM) of each fluorescent labeled ddNTP: Texas Red®, ddATP; Cy™3, ddCTP; fluorescein, ddGTP; and Cy5, ddUTP (Amersham Biosciences). The DNA/water mixture was denatured at 95°C for 10 min. Enzyme, dye terminators, and buffer were added immediately to the other components and applied to the prewarmed arrays on a heat-plate. The arrays were covered with coverslips, wet paper, and a lid to prevent desiccation. The hybridization and APEX reaction were performed at 58°C for 15 min and terminated by washing at 95°C for 1 min in Milli-Q water, followed by washing for 3 min in 0.5% Alconox® solution (Alconox, White Plains, NY, USA). Alconox was removed by washing the arrays two times for 1 min with 95°C Milli-Q water. To reduce bleaching, 16 μL Molecular Probes™ SlowFade® antifade reagent (Invitrogen, Carlsbad, CA, USA) were applied to the slide. The arrays were scanned with the Genorama® imaging system (Asper Biotech) at 20 μm resolution. All samples were successfully analyzed at least twice with identical results. Normalization of Samples The current analysis software supports signal normalization in APEX in three different ways. All the three different ways of signal normalization were used in this study, and they primarily affect the visual intensity of the dots and amount of background. The first and simplest way to normalize is by the signal maximum value. The most intense signal in each of the images is given the same value (1000), and the values of the remaining signals are proportionally multiplied or divided by the same factor. This gives the highest amount of visual sensitivity but also the highest background. The second way of normalizing the samples is by the weakest nucleotide. The hundred most intense signals from each of the images are selected as a reference for comparison. The average values for this set of signals are compared, and all signals from three images (except the one with the smallest average value) will be divided by the variable from the comparison of the 100 most intense signals. Normalization by distribution of signals is the third way and assumes that the signal intensity histograms must Vol. 39, No. 5 (2005)
of abberrant bands from TTGE was performed.
Table 2. Mutations Scored by APEX and TTGE in 48 Breast Cancer Samples Mutation Sample ID
Exon
Nucleotide Change
Scored by Amino Acid Change
TTGE APEX
Tumor p53 Cells Statusa (%)
Immunohistochemistry
For breast carcinomas samples, immunohistochemical staining for ITAM 198 4 207delT Ala69fs + 70 p53 was performed on tumor samples, using 4-μm-thick sections from ITAM 339 5 402insT Phe134fs + 10 formalin-fixed paraffin-embedded ITAM 402 5 Val157Phe + 80 ++ 469G>T material upon heat-induced epitope ITAM 151 5 Ser166X + + 60 retrieval. Slides were incubated with 497C>A primary antibody mouse monoclonal His178_ ITAM 345 5 533_538del5 + + 80 DO-7 (Dako, Glostrup, Denmark) His179fs at a 1:100 dilution overnight. The ITAM 059 5 535C>T His179Tyr + + 80 +++ immunoreaction was enhanced by ITAM 164 6 Arg213Arg + + 20 639A>G the streptavidin-biotin-peroxidase technique, followed by counterITAM 185 6 Arg213Arg + + 40 639A>G staining with Carazzi hematoxylin. ITAM 347 7 Ser241Cys + 40 +++ 722C>G Immunostaining was assessed using ITAM 259 8 Cys275Phe + + 70 +++ 824G>T light microscopy. Diffuse or dot-like nuclear reactivity in >10% of the ITAM 136 8 Pro278Ala + + 70 ++ 832C>G tumor cells was considered positive 6 Arg213Arg + + 639A>G staining. ITAM 119 8 Arg306X + 5 916C>T Ovarian sample sections for IHC were stained using the Dako IHC, immunohistochemistry; APEX, arrayed primer extension; TTGE, temporal temperature gradient electrophoresis. EnVision™ + System, peroxidase aIHC staining for p53 (percentage of cells positive for p53): -, no staining; +, 50%. the Dako autostainer (all from DakoCytomation, Carpinteria, CA, USA). Only distinct nuclear staining was considered positive. Four semiquantitative classes were be equal between different images. All signals from each used to describe the number of positively stained tumor cells: image are rated (1st, 2nd, 3rd, etc.). Signals with the same (-) none, (+) less than 10% of the cells, (++) 10%–50% of the number in the sequence are compared, and the more intense cells, and (+++) more than 50% of the cells. Tumors were signal values adjusted to the level of the signal value from defined as positive if more than 10% of the cells were positive the weakest image (e.g., the second strongest signal from for p53. the A, C, and T images must have the same value as the second strongest from the G image). This gives the lowest background, but also shows a lower intensity in weak spots RESULTS (Genorama Genotyping Software Guide; additional questions on the software can be addressed to
[email protected] or www.asperbio.com). Breast Cancer Cases ITAM 036
4
108G>A
Pro36Pro
+
TTGE and Sequencing Amplification of exons 2–9 of the TP53 gene for analyses by TTGE was performed according to previously published protocols (14). All samples showing aberrant migrating bands were sequenced starting from the new PCR product. Primers and conditions for both TTGE and sequencing were as described by Sørlie et al. (14). Sequencing of the ovarian cancer samples was performed using the PCR products generated according to the APEX protocol. The sequence reaction was carried out using a dideoxy-sequencing reaction and Dye Terminator Cycle Sequencing kit with AmpliTaq® FS and analyzed on an ABI Prism® 377 DNA Sequencer or an ABI Prism 310 Genetic Analyzer (all from Applied Biosystems) according to the manufacturer’s protocol. When the mutated versus wild-type DNA ratio was low, sequencing Vol. 39, No. 5 (2005)
+
10
+
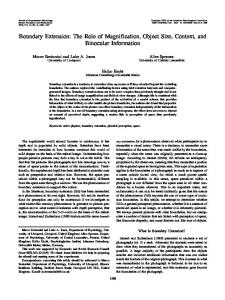
The breast carcinoma samples were screened in parallel in blinded experiments using the described APEX method and the TTGE method, followed by direct sequencing of aberrant migrating bands. The results from the two methods were then compared. A total of 14 genetic alterations were scored in 13 of the 48 breast cancer cases giving a frequency of 27% (Table 2). Five missense mutations, four silent mutations (3 in codon 213), one 5-bp deletion, one 1-bp deletion, one 1bp insertion, and two nonsense mutations were identified. Twelve cases had one sequence change, and one case had two changes (sample ITAM 136). One missense and one nonsense mutation identified by APEX were not detected by TTGE. Three mutations (a deletion, an insertion, and a missense mutation) were not scored by APEX (Table 2 and Figure 1). The codon 72 polymorphisms (CGC to CCC, Arg to Pro) were detected by both methods; 19 of the samples BioTechniques 757
PRODUCT APPLICATION FOCUS were heterozygous and 5 were hemior homozygous for the rare Pro allele. All sequence changes were confirmed by sequencing. Ovarian Cancer Cases
Table 3. Mutations Scored by APEX in 11 Ovarian Cancer Samples Mutation Sample Identification
Exon
cDNA Nucleotides
Amino Acid Change
TTGEa
APEX
Tumor Cells (%)
Ov 3917
5
467G>C
Arg156Pro
-
+
35
Ov 3618
6
578A>G
His193Arg
+
+
65
Eleven advanced ovarian carciOv 4589a 6 Ile195Asn + 584T>A nomas positive for p53 by IHC, but negative after an initial TTGE Ov 3581 6 Tyr220Cys + + 659A>G screening, were also included in this Ov 3447 8 784delG Gly262fs + study. These cases were screened Gly262_ by APEX followed by dideoxy Ov 4713b 8 783_809del + + Phe270del sequencing of exon 2–9, both APEX, arrayed primer extension; TTGE, temporal temperature gradient electrophoresis. sense and antisense strand, as well aResults from second screening. All mutations confirmed by sequencing. bHemi- or homozygous sequence changes. as a second TTGE. A total of six sequence alterations—four missense mutations, one in-frame deletion, and one frameshift deletion—were identified in six cases (Table 3). Rescreening by TTGE showed aberrant migrating Table 4. An Overview of IHC Positive Breast Related to Mutation Status bands in two samples with missense mutations and in one sample with an in-frame deletion, but failed to identify one Mutation Statusa of the two sequence alterations that were present in a hemi+ or homozygote state and two mutations residing close to the + 6b 9 TTGE primer or in a critical melting domain. IHC Slide Quality Screening of TP53 by APEX was performed with three different slide batches. The batches had some differences in number of valid signal spots. A signal spot consists of four subspots, two representing the sense and two representing the antisense strand. One batch (E1024) had 10 out of 1055 (0.95%) dead signal spots and 117 (11.09%) signal spots with information from the sense or antisense strand only. The array on this batch had close to 88% good signal spots. Another batch (E1017) had 6 (0.57%) dead signal spots, 77 (7.30%) signal spots with information from the sense or antisense strand, resulting in close to 92.0% good signal spots. The last batch (F0316) had 1 dead signal spot (0.1%), 20 signal spots (1.9%) with information from the sense or antisense strand, and 98% good signal spots. This gives an average of 92% resequencing of both strands and 99.5% resequencing of sense and/or antisense strand.
90 80 85 65
Carcinomas
Sum 15
-
5
28
33
Sum
11
37
48
aOnly
mutations with a functional consequence (not silent mutations) are included. bOne sample had a deletion in exon 10, which is not included in the APEX array. IHC, immunohistochemistry; APEX, arrayed primer extension.
A
B
p53 Staining and Mutation Status in Breast Cancer Cases IHC has the potential to detect p53 mutations since the mutant protein accumulates in the cell nuclei. A positive p53 immunostain with varying degree of intensity was seen in 15 of 48 breast cancer cases (31%), suggesting the presence of a mutation. Of the thirteen sequence positive tumors, seven exhibited negative IHC reactions, of which three where frameshifts, two were stop codon mutations, and two were silent. The remaining six patients with positive IHC carried silent and/or missense mutations; three samples with 100%, two samples with 20%, and one sample with 1%–2% positive cells. Further, of the nine IHC-positive tumors negative after 758 BioTechniques
C Figure 1. Representative results from APEX-based sequencing assay, TTGE, and sequencing. (A) APEX failed to detect the deletion of a thymine in ITA 198, which was scored both by TTGE and sequencing. (B) C to T transition leading to a missense mutation in ITA 59 is an example of a sequence change scored by both techniques. Note that the APEX sense strand gives visually weak signal. (C) C to T transition in sample ITA 119 resulting in a missense mutation was scored by APEX but not by TTGE. APEX, arrayed primer extension; TTGE, temporal temperature gradient electrophoresis. Vol. 39, No. 5 (2005)
ranged from a few percent to 100%. Our results showed that APEX scored mutations in samples with as little as 5% tumor cells. This level Signal strength of sensitivity was confirmed in a titration experiment Sample A C G T Strand Histograms where samples homozygous for the Arg/Arg and Pro/ Pro polymorphism in codon 72 of the TP53 gene were 2 0 126 0 Sense Arg/Arg mixed in a 1%, 5%, 10%, and 20% ratio. The Pro/Pro 0 18 0 0 Antisense allele was scored at concentrations of 20%, 10%, and 5%, while the results from the 1% group were less 0 36 0 0 Sense convincing, although the signal strength was well Pro/Pro 3 0 89 0 Antisense above the background for these samples (Table 5). Two frameshift mutations, one deletion in sample ITAM 198 with 70% tumor cells and one insertion 0 13 114 0 Sense in ITAM 339 with 10% tumor cells, were scored by 20% 5 17 49 0 Antisense TTGE but not by APEX. The possible reason for this is discussed below. One missense mutation in sample 0 6 106 0 Sense ITAM 347 with 40% tumor cells was also missed by 10% APEX. This may be a result of low sensitivity of some 3 15 24 0 Antisense of the spots/oligonucleotides in the TP53 array and/ or the nature of the mutation. TTGE did not show an 0 4 87 0 Sense aberrantly migrating band in samples ITAM 119 and 5% 3 11 15 0 Antisense ITAM 402 with 5% and 40% tumor cells, respectively. In ITAM 402, the mutation was in a critical area in the melting domain of the TTGE products. The hetero0 0 80 0 Sense zygous mutation in ITAM 119 resided in a noncritical 1% 3 15 12 0 Antisense area of the melting domain and should have been detected, but was probably missed due to the low The Arg/Arg and Pro/Pro genotypes are mixed in the 20%, 10%, 5%, and 1% percentage of tumor cells (