Abstract: Problem statement: The purpose of this study is to develop an artificial immune system for recognizing stock market trends and predict upward and ...
Journal of Computer Science 7 (7): 967-972, 2011 ISSN 1549-3636 © 2011 Science Publications
Evaluation of Artificial Immune System with Artificial Neural Network for Predicting Bombay Stock Exchange Trends 1
M. Gunasekaran and 2K.S. Ramaswami Department of Computer Applications, Park College of Engineering and Technology, Coimbatore, India 2 Department of Mathematics, Coimbatore Institute of Technology, Coimbatore, India 1
Abstract: Problem statement: The purpose of this study is to develop an artificial immune system for recognizing stock market trends and predict upward and downward directions of stock market. This study compared two prediction models, an Artificial Immune System (AIS) and Artificial Neural Network (ANN) for predicting the future index value, trend of Indian stock market and discovers the best prediction model. Approach: AIS is an efficient system for predicting trend due to its high capability of learning and retaining information in memory. Our proposed system was tested using SENSEX (Sensitive Index) data from Bombay Stock Exchange (BSE) of India. Results: Performance of models have been evaluated on the basis of the simulation results done on MATLAB. Experiments have been performed for both methods on well-known technical indicators and compared their results with SENSEX data. Conclusion: Artificial Immune System is more efficient than Artificial Neural Network. Key words: Artificial immune system, artificial neural network, technical indicators, bombay stock exchange, stock market Technical indicators are used to determine the behavior of investors and their impact on the future price movement of the stock from past movements. A well performing stock portfolio, that allows investors to diversify away unsystematic risk and enhance the quality of investment by selling and buying the stock (Vazakidis and Adamopoulos, 2009). The main data of our studies are the price histories of stock, with time and volume information. Down and up trends of the price on the stock market depends on supply and demand of stocks. The SENSEX is a weighted average of 30 shares market value of the Bombay Stock Exchange (India). The SENSEX was introduced by Bombay Stock Exchange (BSE) in 1986. The BSE SENSEX is considered as a benchmark in this experiment. The main objective of the study is to develop predictive model for finding the next day’s close value of SENSEX. The remainder of this study is organized as follows: Initially different prediction models are described. After that Artificial Immune System and Artificial Neural Network are tested and compared with BSE Sensex in order to predict the trend of Indian market. Then the experimental results and numerous discussion issues are presented. Finally the conclusions are summarized relatively.
INTRODUCTION Recent research activities on the Artificial Immune System (AIS) have established that immune system have powerful prediction and pattern recognition capabilities. In recent years, dealing with uncertainty is the big issue. We implement Artificial Immune System (AIS) is a new kind of natural computation method to deal this uncertainty efficiently for predicting the stock trend. Artificial Immune System (AIS) is a computational intelligence model to formulate adaptive systems capable of performing a wide range of tasks in various engineering applications, such as abnormality detection, pattern classification and recognition. AIS are motivated by biological immune system, which have the immune system’s characteristics of learning and memory. A neural network has the capability to process the input variables in parallel and can manage large amounts of data in rapid manner (Hsieh, 2010). The greatest strength of neural network is its skill to discover patterns easily. Artificial Neural Networks (ANN) has been widely accepted to deal with stock market prediction (Chang et al., 2009; Majee and Roy, 2010).
Corresponding Author: M. Gunasekaran, Department of Computer Applications, Park College of Engineering and Technology, Coimbatore, India
967
Electronic copy available at: http://ssrn.com/abstract=1919526
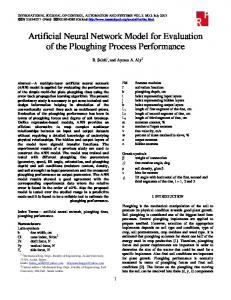
J. Computer Sci., 7 (7): 967-972, 2011 MATERIALS AND METHODS Number of researchers has proposed to analyze and predict stock market activity for the last two decades. Linear methods dominated prediction for the past several years. Linear methods are simple to recognize and interpret and they are also comparatively easy to create and deploy. Linear models also have serious problems on the other side which are unable to identify non-linear relationships in stock market data. Fig. 1: Artificial neural network
Artificial Neural Network (ANN) model: Artificial Neural Network (ANN) methodology allows us to develop nonlinear systems receiving large quantities of inputs that development based on only instances of input-output relations (Vazakidis and Adamopoulos, 2009). A major application field of ANNs is forecasting. ANN is especially best fit for discovering accurate solutions in an environment characterized by nonlinear, irrelevant, complex, partial or noisy data (Eletter et al., 2010). However, several limitations happened even if they were recognized with multi dimensional nonlinear models. The multi layer feed forward neural network model with back propagation algorithm for training is employed for predicting stock market is shown in Fig. 1. A Neural network essentially has three layers which are the input layer, the output layer and the hidden layer in between. Neural network is made up of interconnected neurons and each neuron has the relationship with neighboring neurons. The relationship between the neurons is measured by weight. The input layer x of neurons acquires the data directly from the stock exchange. After computation has been performed by the hidden layer y, resultant outputs are transferred to output layer z. Output of node in hidden layer is derived from inputs, weight of connections and a nonlinear function called as activation function (Solaimani, 2009). Actual output of node in hidden layer y is defined as: AO y = f (sum x )
Back propagation algorithm adjusts the weights of connections slightly. Output layer has only one neuron. We can compare the actual output AO and the predicted output PO for the output layer z and variation V between these values is measured as: V=
(3)
Back propagation algorithm decides to increase or decrease weights wxy for minimizing the variation: w xy = w xy ±△w xy
(4)
where, wxy is the weight of the link between the node x and node y. On neural network, number of suitable neurons is presented in the input and hidden layers can modify the prediction performance (Alsmadi and Omar, 2010; Dastorani et al., 2010). Artificial immune system model: In recent years, Artificial Immune System (AIS) is introduced among the different categories of prediction methods. Artificial Immunology concept was proposed by Professor Forrest, University of New Mexico in 1997 (Wang et al., 2009). Artificial Immune System (AIS) is a new computational intelligence method inspired by biology immune system (Deng and Gao, 2009). A human immune system consists of B-cells that recognize antigens which entering from external environment. B-cells are a type of immune cell, depending on protein molecules called antibody (Golzari et al., 2011). A B-cell identifies the antigen when its antibodies appear into contact with an antigen of complementary shape (Do et al., 2009). In a discrete immune network, cells and molecules can enlarge or reduce in number and may also change their
(1)
Where: n
sum y = ∑ w xy AO x
1 n ∑ (POz − AOz )2 2 z =1
(2)
x =1
Where: wxy = The weight of the connections between input node x and hidden node y AOx = The actual output of node x and f is the activation function 968
Electronic copy available at: http://ssrn.com/abstract=1919526
J. Computer Sci., 7 (7): 967-972, 2011 according to the idea mentioned above and it is illustrated in following Fig. 2. Data refining is very important stage, the Sensing phase filter unnecessary data and decrease data quantity for extracting relevant information from the historical stock data. The Detection phase validates the outcome of sensing phase by utilizing knowledge database (Prado et al., 2010). The Defend phase has higher perception level that analyzes a solution synthetically and provides an exact decision. Future trend can be efficiently predicted in this way. The SENSEX index of current stock market has the rise and fall in price and volume may change the result of the detection. To overcome this problem, AIS system updates the knowledge database and the detectors, so the system will adjust itself to discover effectively the changes of external factors. A financial application has been developed to predict trends using trading rules that suggests investors when should buy or sell various stocks (Widiputra et al., 2009). Technical analysis investigates patterns and movements in price and volume charts by utilizing inferences hidden in past trading activities. It believes that past history will repeat in future and the relationship between price and volume clearly expresses share market performances (Oskooe, 2010). Technical analysts use technical indicators, which are mathematical formulas that predict the market trend easily (Oskooe, 2010). Among the various technical indicators, we utilize the Simple Moving Average (SMA) and Exponential Moving Average (EMA) between different moving averages and Relative Strength Index (RSI) for the price analysis. Arms Index and Money Flow Index are used for analyzing volume (Chang et al., 2009; Abbondante, 2010).
behavior to develop their similarity. The discrete immune networks adjust many elements and adjust the construction of these elements. This approach is facilitating to solve many problems. It obviously deals the relationship with the external environment (antigens) as the discrete immune networks planned at problem solving. A pseudo-code for AIS algorithm is given below: 1. 2. 3. 4. 5. 6. 7. 8. 9. 10. 11. 12. 13.
Generate an initial antibodies while stopping criteria is not met do Estimate the fitness value of each antibody against the antigen Find the better fitness value among antibodies while solution ≠ fitness value do Apply mutation for getting exact fitness value for solution end while produce cloned antibodies if solution = fitness value of cloned antibody then produce more cloned antibody and set cloned antibody as antibody end if end while return the best solution found
In Artificial Immune Network, each element corresponds to a B-cell composed of an antibody. Euclidean distance is a distance between each antigen and antibody (or a B cell) is given by Eq. 5: n
∑ (AG
EDij =
ix
− AB jx )
(5)
x
Where: AGix = xth attribute value of antigen i ABjx = xth attribute value of antibody j The probability of selecting an antibody from the population of antibodies AB according to the population of antigens AG is given as: p( j) =
antibody( j) n
∑ antibody( j)
(6)
j =1
Where: j = The series of antibody or affinity n = The population of antibodies This study has developed a general artificial immunity system framework to defense current stock data
Fig. 2: General framework of artificial immune system 969
J. Computer Sci., 7 (7): 967-972, 2011 Table 1: Technical indicators used as input variables S. No Technical indicators Description 1 Simple Moving Average (SMA) Calculates the average price over a specified
Formula t
moving time period.
(1 / m)
∑
i = t − m+1
xi
2
Exponential Moving Averages (EMA)
averages the last x days closes but assigns a greater weight to the more recent prices making it more sensitive to current price action
EMA = (CP current-CP previous)* 2/ (n+1) + CP previous Where CP – Closing Price
3
Money Flow Index
Measures the strength of money
Money Flow Ratio =
flowing into and out of a stock. It also takes both price and
Where Money flow = Avg. Price* Day’s Volume Day's High + Day's Low + Close Avg. Price = 3 ( AI/DI ) Arms Index= (AV/DV) AI = No. of Advancing issues AV = Advancing Volume DI = No. of Declining issues DV = Declining Volume If AI > 1.0, Market is down trend AI < 1.0, Market is up trend RSI=100-[100/ (1+RS)] where: RS = (Avg. of n-day up closes)/ (Avg. of n-day down closes) n = days (9 - 15 days)
volume into account.
4
Arms Index
Measures relative volume flows
5
Relative Strength Index (RSI)
RSI measures the velocity of price movements and determine the overbought and oversold condition
We first show how parameters are used to configure the system. The input variables used in this study are based on well-known technical indicators. Both immune network and artificial network use these technical indicators for predicting the stock market trend. We have considered 5 important technical indicators with brief description and formula, as shown in Table 1. To evaluate the performance of both models for calculating the following statistical metrics, namely Root Mean Squared Error (RMSE), Mean Absolute Error (MAE) and Mean Absolute Percentage Error (MAPE) of the trained forecasting model for the test data (Singh and Ahmad, 2011; Assis et al., 2010). Root Mean Squared Error (RMSE) is described as follows: RMSE =
1 n ∑ (Ai − Pi )2 x 100 n i =1
MAPE =
1 n ∑ [ Ai − Pi ] n i =1
(9)
Where: Ai = Actual value of index on day i Pi = Predicted value on day i of forecasting models If the above RMSE is very less significant, the prediction accuracy of the system is very close to 100%. RESULTS The prediction models have been successively implemented and tested on MATLAB based Graphical User Interface. The system was tested on India BSE SENSEX Index using historical data from 20092010. We have used separate data sets for training and testing. Both neural network and immune network will be trained using the data from 2nd January 2009 to 31st July 2009. The testing period is selected to be from 3rd August 2009 to 30th July 2010. We have considered the historical data as a source of information on the closing prices of BSE SENSEX index. Our objective is to compare the predicted results and values of above mentioned methodologies with current trends of BSE SENSEX index.
(7)
Mean Absolute Error (MAE) is given as: MAE =
1 n A i − Pi ∑ n i =1 A i
Positive Money Flow Negative Money Flow
(8)
Similarly Mean Absolute Percentage Error (MAPE) is defined as: 970
J. Computer Sci., 7 (7): 967-972, 2011 above Table 2. From above empirical results, it is very evident that the AIS model gives better results on the problem of stock market forecasting. As a result, the Artificial Immune System can be used to predict the stock market trend efficiently. CONCLUSION Numerous soft computing approaches have been applied effectively in predicting the movement of stock trend and produced better performance. In this study, we have proposed an immune based computational strategy for predicting the stock trend which includes sensing, detecting and defending. The experimental studies have been conducted on the Bombay Stock Exchange (BSE SENSEX Index, Period: August 2009-July 2010) datasets. Most of the research papers proposed the ANN model for predicting non-linear data such as stock market. Recently, AIS has the ability to predict nonlinear data very well. This study is evaluated and compared the performance of ANN and AIS models. The AIS model has the lowest value of RMSE, MAE and MAPE. Our experimental results propose that the AIS model can provide better predictions than the standard ANN model. We will improve optimal way to fuse the various intelligent systems using a hybrid approach in future work. We will consider different methodologies to overcome the drawbacks of a specific intelligent system. We will also develop multi-layer presentations of AIS for handling the abnormal characteristics of stock market.
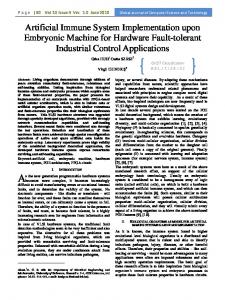
Fig. 3: Actual and projected value of BSE SENSE X generated by the AIS and ANN Table 2: Evaluation of AIS and ANN using test data ERRORS ----------------------------------------------------------Methods RMSE MAE MAPE AIS 103.106 75.315 0.831 ANN 178.136 163.452 1.832
Comparisons and results of both AIS and ANN models were evaluated by estimating the error between the current price of closing and the predicted closing price. Figure 3 shows the predicted results of AIS and ANN models and performance of predicted models were compared with actual BSE SENSEX index. The above graph demonstrates the predicted values of two prediction models during the period 2009 -2010. The actual values for the period are also illustrated. We evaluated the forecast accuracy measures for this period. The prediction performance is evaluated by considering the variation between the predicted value and actual value. Table 2 obviously shows the results have been obtained by two different models, such as AIS and ANN for predicting BSE SENSEX index.
REFERENCES Abbondante, P., 2010. Trading volume and stock indices: A test of technical analysis. Am. J. Econ. Bus. Admin., 2: 287-292. DOI: 10.3844/ajebasp.2010.287.292 Alsmadi, M.K. and K.B. Omar, 2010. Fish recognition based on robust features extraction from size and shape measurements using neural network. J. Comput. Sci., 6: 1088-1094. DOI: 10.3844/jcssp.2010.1088.1094 Assis, K., A. Amran, Y. Remali and H. Affendy, 2010. A comparison of univariate time series methods for forecasting cocoa bean prices. Trends Agric. Econ., 3: 207-215. DOI: 10.3923/tae.2010.207.215 Chang, P.C., C.Y. Fan and C.H. Liu, 2009. Integrating a piecewise linear representation method and a neural network model for stock trading points prediction. IEEE Trans. Syst., Man Cybernetics-Part C: Appli. Rev., 39: 80-92. DOI: 10.1109/TSMCC.2008.2007255
DISCUSSION In this study, we have proposed the Artificial Immune System for predicting the stock market movement. Our new AIS prediction model is compared with another ANN prediction model and benchmark index SENSEX. We clearly identified that the predicted AIS data is very close to actual SENSEX data than predicted ANN data from the above Fig. 3. The statistical measures of prediction errorRMSE, MAE and MAPE of AIS were significantly lower than those obtained with ANN as indicted in the 971
J. Computer Sci., 7 (7): 967-972, 2011 Dastorani, M.T., A. Talebi and M. Dastorani, 2010. Using neural networks to predict runoff from ungauged catchments. Asian J. Applied Sci., 3: 399-410. DOI: 10.3923/ajaps.2010.399.410 Deng, L. and D.Y. Gao, 2009. Research on immune based adaptive intrusion detection system model. Proceedings of the International Conference on Networks Security, Wireless communications and Trusted Computing, Apr. 25-26, IEEE, Hubei, China, pp: 488-481. DOI: 10.1109/NSWCTC.2009.87 Do, T.D., S.C. Hui anmd A.C.M. Fong, 2009. Associative classification with artificial immune system. IEEE Trans. Evolut. Comput., 13: 217228. DOI: 2008-06-10 17:02:03.0 Eletter, S.F., S.G. Yaseen and G.A. Elrefae, 2010. Neuro-based artificial intelligence model for loan decisions. Am. J. Econ. Bus. Admin., 2: 27-34. DOI: 10.3844/ajebasp.2010.27.34 Golzari, S., S. Doraisamy, M.N. Sulaiman and N.I. Udzir, 2011. An efficient and effective immune based classifier. J. Comput. Sci., 7: 148-153. DOI: 10.3844/jcssp.2011.148.153 Hsieh, K.L., 2010. Employing artificial neural networks into achieving parameter optimization of multi-response problem with different importance degree consideration. Inform. Technol. J., 9: 918-926. DOI: 10.3923/itj.2010.918.926 Majee, N.C. and A.B. Roy, 2010. Asymptotic behavior of an artificial neural network defined on multipartite directed graph. OnLine J. Biol. Sci., 10: 44-49. DOI: 10.3844/ojbsci.2010.44.49
Oskooe, S.A.P., 2010. Emerging stock market performance and economic growth. Am. J. Applied Sci., 7: 265-269. DOI: 10.3844/ajassp.2010.265.269 Prado, R.P., N. Garcia-Galá, S. Exposito and J. Yuste, 2010. Knowledge acquisition in fuzzyrule-based systems with particle-swarm optimization. IEEE Trans. Fuzzy Syst., 18: 10831097. DOI: 10.1109/TFUZZ.2010.2062525 Singh, V.K. and N. Ahmad, 2011. Forecasting performance of constant elasticity of variance model: Empirical evidence from India. Int. J. Applied Econ. Finan., 5: 87-96. DOI: 10.3923/ijaef.2011.87.96 Solaimani, K., 2009. A study of rainfall forecasting models based on artificial neural network. Asian J. Applied Sci., 2: 486-498. DOI:10.3923/ajaps.2009.486.498 Vazakidis, A. and A. Adamopoulos, 2009. Stock market development and economic growth. Am. J. Applied Sci., 6: 1932-1940. DOI: 10.3844/ajassp.2009.1932.1940 Wang, W., S. Gao and Z. Tang, 2009. Improved pattern recognition with complex artificial immune system. J. Soft. Comp., 13: 1209-1217. DOI: 10.1007/s00500-009-0418-0 Widiputra, H., R. Pears, A. Serguieva and N. Kasabov, 2009. Dynamic interaction networks in modelling and predicting the behaviour of multiple interactive stock markets. Intell. Syst. Acc. Fin. Mange., 16: 189-205. www.interscience.wiley.com, DOI: 10.1002/isaf.300
972