Evaluation of Attention Levels in a Tetris Game Using a Brain Computer Interface Georgios Patsis1,2, Hichem Sahli1, Werner Verhelst1,2, Olga De Troyer3 1
Dept. of Electronics and Informatics (ETRO), Vrije Universiteit Brussel (VUB), Pleinlaan 2, 1050 Brussels, Belgium 2 iMinds, Gaston Crommenlaan 8, 9050 Ghent, Belgium
{gpatsis,hsahli,wverhels}@etro.vub.ac.be
3
Web & Information Systems Engineering (WISE) Laboratory, Vrije Universiteit Brussel (VUB), Pleinlaan 2, 1050 Brussels, Belgium
[email protected]
Abstract. This paper investigates the possibility of using information from brain signals, obtained through a light and inexpensive Brain Computer Interface (BCI), in order to dynamically adjust the difficulty of an educational video game and adapt the level of challenge to players’ abilities. In this experiment, attention levels of Tetris players – measured with the BCI – have been evaluated as a function of game difficulty. Processing of the data revealed that both in intra- and inter- player analysis, an increase in game difficulty was followed by an increase in attention. These results come in accordance with similar experiments performed with a 19 sensor EEG cap, as opposed to the single-dry-sensor BCI used here. These findings give new possibilities in the development of educational games that adapt to the mental state of player/learner.
Keywords: brain signal, brain computer interface, attention levels, Tetris, dynamically adjust game difficulty.
1
Introduction
The use of educational video games (edu-games) is a way to increase motivation in the learning process, but the risk that learners get bored still exists. Therefore, understanding the learner’s cognitive state is important when using edu-games, and enabling the edu-game to dynamically respond to the learner’s behavior and mental state through adaptive actions could be beneficial. In this paper we are investigating if we can monitor player’s behavior and mental state using a simple Brain Computer Interface (BCI). More precisely we are testing if changes in game difficulty are followed by changes in the brainwaves. The work presented here is part of an interdisciplinary research project on adaptive educational games. Among other issues, we are investigating ways of controlling game difficulty by getting direct input of the mental state of the player with physiological sensors. In this first experiment we are using an EEG
sensor. Over the last few years a number of new light and inexpensive devices, socalled Brain Computer Interfaces (BCI), have appeared in the market. A BCI is a device that can capture brain waves (very low electrical signals produced by the brain). These new technologies have made it possible to measure at low cost and in a less intrusive way basic brain activity. Until then, brain activity could be measured only with dedicated equipment using an EEG cap (Electroencephalography), which is of course much more reliable but not usable outside a lab or medical environment. In order to test the usefulness of the device in the context of our work, we have performed some preliminary tests and studies. After doing a market research we decided to use the MindWave BCI from NeuroSky (www.neurosky.com), which is specially designed for and targets the gaming market. It is a low cost wireless device, highly user friendly, with a single dry-sensor positioned on the forehead (FP1). Except the raw brain signal, this device also provides levels of attention in the scale of 0 to 100. NeuroSky does not provide a description of the algorithms used to calculate attention levels since they are protected as trade secret. For our experiments we didn’t use the raw EEG signal applying processing algorithms, but the readings of attention straight from the device. Our intention is to test the usefulness of new BCI technologies based on work that has already been done. The specific device is a product of university research carried out together with physiologists. Several research groups have already carried out studies using the device [1], [2], [3], [4] and [5]. To our knowledge, this is the first time that a BCI is used in experiments evaluating attention levels of users playing Tetris or any other game in different difficulties. Results reported so far using the MindWave BCI was mainly focused on assessing attention levels during mental tasks. We performed an experiment based on a gaming protocol introduced by G. Channel et al. [6] in order to investigate if changes in game difficulty are followed by changes in brain activity. In their experiments, they used a number of physiological sensors capturing signals like galvanic skin response, blood volume pulse, heart rate, chest cavity expansion, and skin temperature. In 14 of 20 participants an EEG cap (19 electrodes) was used for capturing brain waves. The authors of [6] investigated the use of emotion assessment from physiological signals to adapt the difficulty of a Tetris game. They found that playing the game in different difficulty levels gave rise to different emotions. In easy difficulty players were bored, in medium they were in an engagement mode and in hard levels they felt anxiety. Moreover they found that engagement of a player in the game is decreasing if the level of difficulty does not change. Except the statistical analysis to determine the emotional states of players in different levels, classification has been also performed in order to investigate the possibility of recognizing these states from the physiological signals. For our experiment we used only the BCI which has a single dry sensor placed on the forehead (position FP1) and can capture EEG signal from the brain. In the experiments described in [6], the Tetris game was used. As our goal was to investigate if the BCI could provide information in the same line as the results reported in [6], we also used Tetris since it is easy to control the difficulty by changing the speed of the falling blocks. In the regular Tetris game the speed of the falling blocks is gradually increased as the player is making more lines. We adapted the code of an open source version so we could
control the speed of the falling blocks and keep it constant through a gameplay. Speed could be changed in 25 steps (levels).
2
Data Capture
The experiment was conducted in the recording room of AV Lab, the audiovisual laboratory of the Department of Electronics and Informatics (ETRO) of our university [7]. Except the BCI we also used 2 cameras: one USB camera attached on the PC monitor (video chat position) recording the front view of the face of each player and a camcorder recording the game from a second monitor that was reproducing game player’s view. Signals from the 2 video cameras and the BCI were in synch using timestamps. More specifically, the software used to capture the video of the USB camera (www.webcamxp.com) is naming the produced file with the timestamp of the PC used. Also, the BCI comes with a SDK where in the resulting text file with all the data, a time stamp is introduced when capture started. Both the USB camera and the BCI are installed in the same PC, so timestamps refer to the same clock. In order to synchronize the camcorder with the USB camera, we used the classic hand clapping, so we can align video’s using the high peak produced by the clapping in the sound clip of both signals. With timestamps introduced by the local clock of the PC, we manage to have a synch down to one second, which is the time resolution of the BCI for levels of attention. The information from the videos was used for segmentation and in order to extract other useful information that could help in the analysis.
3
Experiments
We have conducted the experiment, letting 14 post-graduate students of our university (7 male and 7 female) to play 6 Tetris games in 3 difficulty levels: 2 easy, 2 medium and 2 hard games in an arbitrary order, according to the gaming protocol introduced in [6]. All players had to play each game for a 5 minute period. In case where a player would lose the game before the 5 minute period he/she had to stop. In a very few cases, some players wanted to continue beyond the 5 minute limit. We let them do so. Between the games, players had to rest for 5 minutes and fill in a selfevaluation form giving scores for their valence/arousal (according to the SAM system [9]) and their perceived game difficulty (easy, medium, or hard). We used the five scale visual representation for valance and arousal levels of the SAM system, explaining to players how to give their scores for each dimension. For valance, they had to give a score between lowest (one), feeling very unhappy with their performance, and highest (five), feeling very happy with their performance. For arousal, they had to give a score between one, felling very bored and five feeling very excited. As already indicated, in Tetris, game difficulty can be controlled by the speed of the falling blocks. We used an open source implementation of the game found on Sourceforge (sourceforge.net/projects/tetrominusrex/), where we adjusted the code so that speed and therefore the difficulty could be constant.
Speed vs Level 30
Speed of falling blocks (pixels/sec)
25
20
15
10
5
0
5
10
15 Tetris Level
20
25
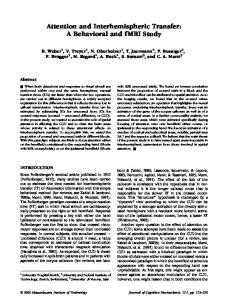
Fig. 1. Speed of falling blocks as a function of Tetris level
We adjusted the Tetris game in order to have a total of 25 levels. The higher the level, the higher the speed of the falling blocks. In order to find the relation between Tetris level and the speed of the falling blocks, we measured the speed of the falling blocks (in pixels per second). We found that speed is increasing exponentially with the level (Fig 1). We first let players practice for 15 minutes in a level that was comfortable for them: a level that is not too easy but not too hard. It is the level that players can feel satisfaction and engagement playing focused for long time. According to [6] this is the level where the skills of a player meet game difficulty and it is defined by the flow theory proposed by Mihaly Csikszentmihalyi [8]. Flow is the mental state where a person in an activity is fully immersed in a feeling of energized focus and full involvement. In order to identify this level (medium game difficulty) for each player we let them play for a short period starting from level 15 and increasing the level until they felt they were in a state that it was not too easy but also not too difficult to play the game. We call this level the starting level and it gives an indication of player’s skill in Tetris. For all players this state was between Tetris levels 15 and 22 (Table 1). For easy and hard games we used Tetris levels 1 to 51, respectively 22 to 24 as shown in Table 1. Table 1. Tetris levels used for each of the 3 game difficulties Game Difficulty Easy 1
Tetris Level 1-5
We only considered levels 1-5 because the increase in speed between levels 5 and 15 is very small (see Fig 1).
Medium Hard
15 - 22 22 - 24
Players were asked to evaluate the (perceived) difficulty of each 5-minute game (easy, medium or hard). In our analysis, we used these data of player's self-evaluation (for game difficulty) as ground truth. By analyzing the videos from the 2 cameras for each player we extracted the start and end time for each game and use them for the analysis of the corresponding attention data segments. In total we end up with 84 instances of games (14 players x 6 games).
4
Affective state assessment
We first analyze the results obtained for Valence/Arousal for all 84 instances. We wanted to have a global view of player's emotional state in the 3 different game difficulties so we can use this as the ground truth for further analysis of attention levels. For our analysis we have split the valence/arousal plane in 4 quadrants, each one representing a different emotion according to the mapping introduced by Russel [9]. We used the 4 basic emotions found in a gaming experience (Fig 2). When game difficulty is easy, players are getting bored but when it is (too) hard they get stressed. Between these two states there is a flow zone, where skills of the player meet game difficulty, players are engaged and can enjoy playing the game showing positive emotions like joy or excitement.
Fig. 2. Valence/Arousal space used in our experiments
In Table 2 we give the results of player’s self-evaluation for all 84 instances. We observe that when players evaluate game difficulty as easy in 65.51% of the instances they felt bored. When they had evaluated difficulty as normal, in 57.14% of instances
they felt engaged and in case of hard difficulty in 55.55% of instances they were stressed. Table 2. Percentage of instances for each emotion according the player’s self-evaluation Game Difficulty Player Easy Normal Hard
5
Engaged
Relaxed
Bored
Stressed
17.24 57.14 40.74
13.79 0 0
65.51 24.42 3.70
3.44 21.42 55.55
Performance Metric
A possible measurement of player’s performance in a Tetris game is the total score (total number of lines). We could use this performance metric to compare the overall performance of the 6 games among players. If we want to compare player’s (same or different) performance in individual games we could use the score, where A is a constant: Performance = A * Score
(1)
The problem by using this performance metric is that it doesn’t take into account the difficulty level, which is a function of the speed of the falling blocks. If for example two players have the same score for a game, but one played in level 2 and the other in level 22 according to (1) they performed equally well. That is not true, since the second player had to play faster and make decisions quickly enough. We can compensate for game difficulty by giving a higher weight to harder levels and a lower one to easy levels. We propose to use the curve of the speed of the falling block (Fig 2) as the weight that we call speed factor. We use the normalized (to unity) curve multiplied by the score (2). With this adjustment our proposed performance metric is a function of the score and difficulty of a game, so we can better compare results of individual games for the same or different players. Performance = Speed Factor * Score
6
(2)
Evaluation of attention
Attention values provided by the BCI are given in the range of 0 to 100 and at a sampling frequency of 1Hz. We observed that attention values exhibit increasing (A+) or decreasing trends (A-).Similar trends in attention were observed in experiments using the specific BCI with archers in shooting process [10]. In their analysis, attention trends were linked with archer’s skills. For this reason we will also investigate the role of these trends and find if there is a relation between attention trends and players.
ATTENTION: Mean = 36.0289 Slope = 0.056268 100 90 80 70
A.U
60 50 40 30 20 10 0
50
100
150 Time(sec)
200
250
300
Fig. 3. Attention values for a game with a positive trend (A+)
ATTENTION: Mean = 31.7113 Slope = -0.033703 100 90 80 70
A.U
60 50 40 30 20 10 0
20
40
60
80
100 120 140 Time(sec)
160
180
200
220
Fig. 4. Attention values for a game with a negative trend (A-)
In Table 3 we give the distribution of A+ and A- for all 14 players together with total score and performance metric for comparison. For each player we calculated the mean value of attention per game and difficulty, as it was evaluated by them.
Table 3. Distribution of A+ and A- with total score and performance per each player Player ANK GEO LUK SEL VAS PIE TOM TIF PEN YEI CHR ELE DES WES
# A+
# A-
4 5 6 3 4 5 3 1 3 5 5 4 1 4
2 1 0 3 2 1 3 5 3 1 1 2 5 2
Total Score 250 185 190 235 142 115 131 88 127 184 124 145 148 125
Starting Level
Performance Metric
17 20 17 20 18 19 12 14 22 17 21 19 18 20
32.6 26.4 19.8 38.5 16.8 13.4 10.8 8.3 20.1 20.4 17.2 18.0 16.3 18.5
Linear regression analysis was carried out and results are shown in Fig 5. This intraplayer analysis indicates that attention levels are increasing with game difficulty. 70 65 60
Mean Attention Level
55 50 45 40 35 30 25 20
5
10
15
20 25 Instance
30
35
40
Fig. 5. Mean attention levels for all 14 players in the three different game difficulties (* Easy, o Medium, + Hard)
Following an inter-player approach, we found that out of all 84 instances (14 players x 6 games), 53 instances (63%) showed a positive trend in attention (A+) and the rest 31 (37%) a negative one (A-). For every instance we obtained an attention value averaging over values provided by the BCI. We then calculate mean values of attention, arousal and performance for each difficulty level. In Table 4 we give these results for all instances and for A+ and A- instances separately. We made this distinction in order to examine the effect of attention trends in our results.
Table 4. Attention and Performance as a function of game difficulty Number of Instances
p-value (ANOVA)
Mean Attention
Mean Arousal
Mean Performance
All instances (84) Easy Medium Hard
29 28 27
0.0073
43.43 42.70 48.66
3.96 5.85 6.85
1.57 5.17 3.22
A+ instances (53) Easy Medium Hard
17 21 15
0.0002
41.24 43.06 51.87
3.70 5.85 7.13
1.51 5.14 2.55
A- instances (31) Easy Medium Hard
12 7 12
0.3699
46.54 41.63 44.64
4.33 5.85 6.50
1.67 5.26 4.07
An ANOVA test was carried out on attention values to test for differences in the three conditions (easy, medium and hard difficulty) indicating the significance of results. By analyzing data from the SAM based self-evaluation we found that in the majority of instances players felt bored when playing in easy levels, engaged when played in medium level and stressed when the level of Tetris was hard (Table 2). Also, according to Table 4, players had their best performance (on average) when playing in medium game difficulty, where player’s skills meet game’s difficulty. These results are in alignment with the flow theory [6] and give us an indication that players were more likely to be in the flow zone when playing in medium game difficulty. From Table 4, we also observe that the mean arousal level, calculated from player’s self-evaluation, is increasing with game difficulty, but performance is increasing up to a point and when levels of arousal are too high is decreasing. This experimentally observed fact comes in accordance with the Yerkes-Dobson law, describing the relation between arousal and performance [11]. By analyzing attention trends we found out that 2/3 of game instances exhibited a positive trend in attention (A+) and the remaining 1/3 a negative one (A-). By comparing results of Table 3, we conclude that attention trends are not related to players or their performance: all 14 players (except one) exhibit a positive and negative attention trend and their performance is not linked with the number of games with A+ or A- trend. We investigated whether there was a relation between attention trends, skills and performance. We found low values of correlation coefficient between A+ and starting level (0.29), A+ and total score (0.28), A+ and performance metric (0.21).
65 60 55 50 45 40 35 30 Easy
Medium
Hard
Fig. 6. Boxplot of A+ for the different game difficulties
Another important finding from Table 4 is that 21 out of 28 (percentage 75%) instances referred to medium difficulty, are related to positive trend in attention and only 7 out of 28 (percentage 25%) of medium difficulty are related to a negative trend. We can conclude that when a player is in the flow zone, it is more likely that attention will exhibit a positive trend. Based on the results of Table 4, we have built a model for attention using only instances of attention with a positive trend. In this model, attention is increasing with game difficulty (Fig 6). In [6], G. Chanel et al. observed a similar behavior in the feature EEG_W (Fig 4 in [6]), which is known to be related with cognitive processes like workload, engagement, attention, and fatigue [12]. We noticed that attention instances with a negative trend showed a high p-value (0.3699) in the ANOVA results (Table 4). This is a strong indication that these instances are not really part of a pattern, but just chance and are possibly related with loss of interest for the game, something we have to investigate in the future. These instances do not contribute to the model: they work counter-wise. If we make the hypothesis that attention measurements of the BCI are related to a similar feature like EEG_W for brain activity, our results come in alignment with results in [6]. We then calculate the mean of mean values of A+ in each game difficulty. The observed similarities between the increase in the speed of falling blocks (Fig 1) and the mean of means attention (Fig 6), suggests that a non-linear increase in game difficulty results in a non-linear increase in attention.
7
Conclusions
We tested the usefulness of a commercially available BCI dedicated for gaming in measuring levels of attention. Based on a gaming protocol for Tetris introduced by G. Channel et al. we performed an experiment with 14 participants. Players felt bored when game difficulty was easy, engaged when game level was medium and stressed when it was hard. Similar results were reported by G. Channel et al. [6]. By analyzing data obtained from self-evaluation questionnaires given to participants playing Tetris with the same gaming protocol, they found out that the three different gaming conditions (levels of difficulty) gave rise to three different emotional states: boredom for the easy conditions, engagement for the normal and anxiety for the hard condition. We proposed a performance measure for Tetris that takes into account the non-linear increase in the speed of the falling blocks and according to flow theory of Csikszentmihalyi and the Yerkes-Dobson law results are consistent. Based on a statistical analysis of the obtained data, we introduced a model for attention where a non-linear increase in game difficulty is followed by a non-linear increase in attention. The proposed model for attention comes in accordance with similar results obtained by G. Channel et al. [6] using the same gaming protocol with Tetris and a full EEG cap to capture signals from the brain. As feature they used EEG_W (ratio of energies for alpha, beta and theta brain waves) which is related to attention and workload. By letting players playing the Tetris game in different difficulties (low, normal and hard) they also found that the EEG_W values were increasing on average with game difficulty. For their experiments they also used 14 participants.
8
Limitations and future work
As results of this preliminary study using the BCI were encouraging, we will repeat the experiment using a bigger sample of players and higher number of Tetris games per player, in order to have a stronger proof that the model for attention proposed here stands also for each player. With more data it would be possible to build a classifier that can distinguish between states of low, medium and high attention. Based on flow theory the model for attention can be further tested by incorporating (in the game) the dynamic adjustment of difficulty and by evaluating the effect in players’ performance and engagement.
9
Acknowledgments
The results presented here are part of ongoing work in the context of the interdisciplinary research project CAdE (Towards Cognitive Adaptive Edu-Games) sponsored by the Vrije Universiteit Brussel (Belgium).
References 1. A user-friendly SSVEP-based brain–computer interface using a time-domain classifier, An Luo and Thomas J Sullivan 2010 J. Neural Eng. 7. 2. A brainwave signal measurement and data processing technique for daily life applications, Yasui Y., J Physiol. Anthropol. 2009;28(3):145-50. 3. Assessing NeuroSky's usability to detect attention levels in an assessment exercise, Genaro Rebolledo-Mendez, G., I. Dunwell, Human-Computer Interaction, Part I, HCII 2009, LNCS 5610, pp. 149–158, 2009. 4. Evaluating a Brain-Computer Interface to Categorize Human Emotional Response, Katie Crowley, Aidan Sliney, Ian Pitt, Dave Murphy, 2010 10th IEEE International Conference on Advanced Learning Technologies, pp. 276 – 278 5. Psycho-physiological measures for assessing cognitive load, Eija Haapalainen, SeungJun Kim, Jodi F. Forlizzi, Anind K. Dey, , Proceedings of the 12th ACM international conference on Ubiquitous computing Pages 301-310, NY, USA, 2010 6. Emotion Assessment From Physiological Signals for Adaptation of Game Difficulty, Guillaume Chanel, Cyril Rebetez, Mireille Bétrancourt, and Thierry Pun, Member, IEEE, IEEE Trans. on Sysytems, Man, and Cybernetics—Part A: Systems and Humans, vol. 41, NO. 6, November 2011 7. AV Lab, Audio-visual lab of ETRO, VUB, www.etro.vub.ac.be/Research/Nosey_Elephant_Studios/ 8. Csikszentmihalyi, M. (1990). Flow: The Psychology of Optimal Experience. New York: Harper and Row 9. A Circumplex Model of Affect, James A. Russell, Journal of Personality and Social Psychology, 1980, Vol. 39, No 6, 1161-1178. 10. Evaluation of Attention and Relaxation Levels of Archers in Shooting Process using Brain Wave Signal Analysis Algorithms, KooHyoung Lee, 감성과학, 2009, Vol. 12, No 3, 341350. 11. Yerkes RM, Dodson JD (1908) "The relation of strength of stimulus to rapidity of habitformation", Journal of Comparative Neurology and Psychology 18: 459–482. 12. C.Berka, D. J. Levendowski, M. M. Cvetinovic, M. M. Petrovic, G. Davis, M. N. Lumicao, V. T. Zivkovic, M. V. Popovic, and R. Olmstead, “Real-time analysis of EEG indexes of alertness, cognition, and memory acquired with a wireless EEG headset,” Int. J. HumanComput. Interact., vol. 17, no. 2, pp. 151–170, Jun. 2004.