ANALYTICAL SCIENCES OCTOBER 2007, VOL. 23 2007 © The Japan Society for Analytical Chemistry
1245
Notes
Evaluation of Behavioral Differences between Native Polycyclic Aromatic Hydrocarbons and 13C-Labeled Internal Standards during Clean-up Steps of Analysis Nobuyasu ITOH,† Masahiko NUMATA, and Takashi YARITA National Metrology Institute of Japan (NMIJ), National Institute of Advanced Industrial Science and Technology (AIST), 1-1-1 Umezono, Tsukuba, Ibaraki 305–8563, Japan
We confirmed that concentrations of polycyclic aromatic hydrocarbons (PAHs) obtained by isotope dilution mass spectrometry (IDMS) using the corresponding 13C-labeled internal standards are reliable even after clean-up steps. Change in the ratio of phenanthrene to 13C6-phenanthrene was less than 0.2%, although the recovery yield of 13C6phenanthrene decreased to 60%. Since changes in the ratios were commonly within the relative standard deviations of the concentrations (1.5 – 5.4%) obtained using gas chromatography–mass spectrometry in combination with pressurizedliquid extraction, concentrations obtained by IDMS with 13C-PAHs should be reliable. (Received July 27, 2007; Accepted August 31, 2007; Published October 10, 2007)
Introduction In addition to an extraction step, clean-up and concentration steps are required for the accurate determination of organic contaminants present in environmental samples. Because a portion of the target compounds is lost during the analytical process, recovery yields of spiked compounds are usually estimated in order to judge the appropriateness of an analytical procedure.1,2 If recovery yields are close to 100%, this offers a partial confirmation that the analytical procedure is appropriate for the determination of the target compounds. However, in most cases involving the determination of multiple compounds, it is difficult to obtain near 100% recovery for all the target compounds as a result of losses incurred during analytical processes such as the clean-up and concentration steps. Isotope dilution mass spectrometry (IDMS), known to be one of the most reliable analytical methods, is based on the principle that isotopically labeled internal standards will behave in the same manner as the corresponding target compounds throughout a series of analytical processes. Thus, the calculated concentrations are not dependent on their recovery yields.3 However, there are some reports that isotopic fractionation can occur during a concentration (evaporation) process that is an essential step for the analysis of environmental samples.4,5 If different behaviors do occur during an analytical process, its effect on the observed concentrations must be evaluated. Polycyclic aromatic hydrocarbons (PAHs), some of which are carcinogenic,6 are formed by incomplete combustion in anthropogenic processes such as burning of fossil fuels and in natural processes such as forest fires.7 Because the emitted PAHs are transported for long distances, PAHs are found in most environmental samples throughout the world, including those from regions that are recognized as being less affected by † To whom correspondence should be addressed. E-mail:
[email protected]
human activities.8–11 It is therefore necessary to monitor the levels of emitted PAHs in environmental samples. Among the PAHs, 16 PAHs prioritized as pollutants by the U.S. Environmental Protection Agency are the focus of analysis and monitoring. Although the 16 PAHs have no functional groups in their structures, their characteristics range widely, depending on the numbers of benzene rings that are present: the boiling points range from 218 to 525˚C,7 and the octanol–water partitioning coefficients (log Ko/w) vary from 3.54 to 7.07.12 Thus, the various PAHs would be expected to show different behaviors during analytical processes and, in particular, to show different recovery yields of spiked internal standards. With respect to different behaviors of isotope-labeled PAHs relative to native PAHs, we previously reported that such differences occur during extraction steps involving pressurized-liquid extraction (PLE) even when the corresponding 13C-labeled PAHs are used as internal standards, and they also affect the observed concentrations (by –1.4 to +0.81% for extraction at 150˚C, and by –8.5 to –1.1% for extraction at 40˚C).13 Since differences in the behaviors of native PAHs and 13C-labeled PAHs were more significant at 40˚C than at 150˚C, it is possible that different behaviors also occur during clean-up steps and do affect the observed concentrations. Since clean-up using silicagel in combination with PLE is commonly used for the determination of PAHs in solid samples, the effect on the observed concentrations should be evaluated using this procedure. In this study, we first identified the major factor responsible for the losses of five spiked 13C-labeled PAHs during analytical processes. We then examined whether different behaviors observed are sufficient to affect the concentrations obtained by IDMS.
Experimental Sample and reagents Sediment collected from a lake in Japan was air-dried,
1246 pulverized, sieved to remove particles larger than 106 μm, homogenized, and sub-sampled into 60-g portions by the Environmental Technology Service (Fukuoka, Japan). The amount of water in the sediment sample was determined by heating the sediment at 105˚C, and calculated to be 2.3%. Phenanthrene (Phen) was obtained from Supelco (Bellefonte, PA, USA). Fluoranthene (Flu), benz[a]anthracene (BAA), and benzo[a]pyrene (BAP) were obtained from Tokyo Chemical Industry (Tokyo, Japan). Benzo[ghi]perylene (BGP) was obtained from AccuStandard (New Haven, CT, USA). 13C-labeled PAHs (13C-PAHs) dissolved in nonane, such as [13C6]phenanthrene (13C6-Phen), [13C6]fluoranthene (13C6-Flu), [13C6]benz[a]anthracene (13C6-BAA), [13C4]benzo[a]pyrene (13C4-BAP), and [13C12]benzo[ghi]perylene (13C12-BGP) were obtained from Cerilliant (Round Rock, TX, USA). Crystalline [2H12]perylene (Per-d12) was obtained from the same source and used as a syringe spike. Toluene, hexane, and anhydrous Na2SO4 were of pesticide- and PCB-analysis grade (Kanto Chemical, Tokyo, Japan). Each of the native PAHs was dissolved in toluene and the resulting solutions were combined. A syringe-spike solution for the calculation of the recovery yield was prepared by dissolving crystalline Per-d12 in toluene. All the 13C-PAH solutions were combined and diluted with toluene. Part of the combined 13C-PAHs mixture was diluted further with toluene to give a surrogate solution, and the remainder was added to the solution of native PAHs to form a calibration solution. Extraction and clean-up procedures The scheme for the analytical procedure is summarized in Fig. 1. PLE was performed by using a Dionex (Sunnyvale, CA, USA) ASE 200 system equipped with stainless-steel extraction cells with a volume of 11 mL. After the addition of 5 g of sediment sample, a few grams of anhydrous Na2SO4 were added and the mixture was thoroughly shaken. Then the surrogate solution was added, followed by the addition of sufficient anhydrous Na2SO4 to fill the vacant space in the cell. The cell was kept overnight at room temperature prior to extraction. Extraction was performed with toluene under static conditions (150˚C, 15 MPa) for 10 min, and all steps of the extraction operation were performed twice. The extract was treated with a small amount of activated copper powder to remove elemental sulfur. After filtration with a PTFE membrane filter (0.1-μm pore), the extract (∼50 mL) was concentrated to 1 mL using a rotary evaporator and a gentle stream of nitrogen gas. The concentrated extracts were cleaned up by using a silica-gel solid-phase extraction (SPE) cartridge (500 mg/3 mL Isolute SILICA, International Sorbent Technology, Hengoed, UK) equipped with a Zymark (Hopkinton, MA, USA) RapidTrace automation system. PAHs were eluted with 6 mL of hexane. The hexane fraction (9 mL) was evaporated by using a gentle stream of nitrogen and replaced with toluene after the addition of the syringe spike (final volume: 100 μL). GC-MS analysis GC-MS analysis was carried out with 6890/5975 instruments from Agilent Technologies (Palo Alto, CA, USA) equipped with a DB-17MS capillary column (30-m long × 0.25-mm i.d., 0.25-μm film thickness; J & W Scientific, Folson, CA, USA). The oven temperature was programmed to rise from 50˚C (2 min hold) to 240˚C at a rate of 10˚C min–1 and then to 300˚C (10 min hold) at 1.25˚C min–1. Data for quantification were obtained in the selected-ion monitoring (SIM) mode. The ions selected for each PAH (m/z) were as follows: Phen (178.1, 176.1), Flu (202.1, 200.1), BAA (228.1, 226.1), BAP (252.1,
ANALYTICAL SCIENCES OCTOBER 2007, VOL. 23
Fig. 1
Scheme for the analytical procedure and spiking steps.
250.1), BGP (276.2, 277.2), 13C6-Phen (184.1, 182.1), 13C6-Flu (208.1, 206.1), 13C6-BAA (234.2, 232.2), 13C4-BAP (256.2, 257.2), 13C12-BGP (288.2, 289.2), and Per-d12 (264.2, 265.2): the underlined ions were used for quantification.13,14 Note that the peak intensity of Per-d12 in the calibration solution, which is used as a criterion in the recovery calculation, is affected by the residue remaining in the injection liner.14 Thus, the calibration solution was always injected after the samples in this study to obtain a constant peak intensity for Per-d12.
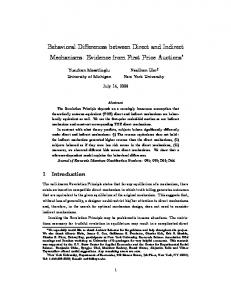
Results and Discussion Concentrations of PAHs and recovery yields of spiked 13C-PAHs Recovery yields of spiked internal standards are commonly reported with the observed concentrations to support the appropriateness of analytical procedures. Recovery yields of spiked internal standards should preferably be close to 100%. The guidelines for some official methods stipulate recovery yields of internal standards in the range 50 – 120%.1,2 The obtained concentrations of five PAHs in the sediment sample were 24.1 ± 0.5 (average ± standard deviation, n = 3) ng g–1 for Phen, 21.8 ± 0.3 ng g–1 for Flu, 6.38 ± 0.21 ng g–1 for BAA, 4.30 ± 0.23 ng g–1 for BAP, and 5.05 ± 0.22 ng g–1 for BGP. These concentrations are close to those obtained from samples from areas less influenced by human activities.10,11 Moreover, among sediment samples that have been collected in Japan, these concentrations are comparable to those found in deeper layers of sediment-core samples collected from the reservoir of Osaka Castle (which were deposited before 1850 CE).15 Thus, the sediment sample could be considered to be only slightly contaminated. Recovery yields of 13C-PAHs over the entire analytical process ranged between 55 and 85% (Spike before extraction, Fig. 2), although all the PAHs examined have no functional groups and have similar structures (consisting solely of benzene rings). This result suggests that behaviors of internal standards may differ from those of the target compounds, even if compounds having similar structures to those of the target compounds are selected as internal standards.
ANALYTICAL SCIENCES OCTOBER 2007, VOL. 23
Recovery yields (%)
(13C4-BAP and 13C12-BGP) between the clean-up alone and during the entire analytical processes (14.5% for 13C4-BAP and 17.9% for 13C12-BGP) suggest that losses of heavier PAHs result mainly from the extraction steps (i.e., adsorption on the sample) rather than concentration steps.
Spike before extraction (A) Spike before concentration (B) Spike before SPE (C) Spike after SPE (D)
100 80 60 40 20 0 13
C 6 -Phen
13
C6 -Flu
13
C6 -BAA
1247
13
C4 -BAP
13
C12 -BGP
Fig. 2 Recovery yields of 13C-PAHs spiked at each step. Error bars indicate the standard deviation (n = 3).
Possible causes of recovery losses during clean-up steps There are two possible causes of low recovery yields of spiked 13C-PAHs in this study. One is volatilization during concentration steps and the other is irreversible adsorption of some spiked internal standards on the silica-gel cartridge. To identify the main process for loss of 13C-PAHs, we compared the recovery yields of 13C-PAHs which were added at different analytical steps (spike before concentration, B; spike before SPE, C; spike after SPE, D; Fig. 1). Figure 2 shows the recovery yields of spiked 13C-PAHs at each step. In Fig. 2, recovery yields of 13C-PAHs spiked before concentration (B in Fig. 1) could be considered to be equivalent to the recovery yields of 13C-PAHs during the clean-up steps. Recovery yields of 13C-PAHs during clean-up steps (56 – 102%) were similar to those obtained over the entire analytical processes, including extraction steps (A, 55 – 85%). This result suggests that losses of PAHs, especially for lighter PAHs such as 13C6-Phen, 13C6-Flu, and 13C6-BAA, occur mainly during the clean-up steps rather than the extraction steps. Moreover, recovery yields of 13C -Phen, which shows the lowest recovery yields among the 6 13C-PAHs examined, decreased to 60% even when spiked just before the final concentration step. Thus, the main cause of loss of 13C6-Phen appears to be volatilization at the last step, as explained below. This interpretation is consistent with the fact that the losses of PAHs during this step appear to depend on their volatility (Phen, bp 339˚C; Flu, bp 375˚C; BAA, bp 435˚C; BAP, bp 495˚C; and BGP, bp 525˚C). Losses of 13C6-Phen, 13C -Flu, and 13C -BAA spiked after SPE (D, 19 – 40% loss) 6 6 were considerably larger than those after Cu treatment (B, 4.2 – 4.5% loss), although concentration steps were performed both before and after the SPE steps (Fig. 1). This difference could be attributed to both the use of toluene having a high boiling point (∼111˚C) as a medium and the characteristics of the solution, which contains a smaller proportion of coexisting materials relative to the solution after Cu treatment.16,17 The greater change in concentration after SPE (before concentration, from ∼50 mL to 1 mL; after SPE, from 9 mL to 100 μL) could also have an effect on this difference, although for the final concentration step we used conical-bottomed test tubes, which are known to lose less solute during evaporation.16 In contrast to the concentration step, amounts of PAHs retained on the silica-gel cartridge were quite small (differences in the values before and after the SPE steps were 0.3% for 13C -Phen, 2.2% for 13C -Flu, 3.0% for 13C -BAA, 4.2% for 6 6 6 13C -BAP, and 5.1% for 13C -BGP). These results also suggest 4 12 that the losses of 13C-PAHs, especially those of relatively volatile PAHs, result from volatilization during concentration steps. Differences in the recovery yields of heavier PAHs
Influence of different behaviors of 13C-PAHs relative to native PAHs on the obtained concentrations As described above, the factor that is the most responsible for losses of lighter PAHs is volatilization during concentration steps. It is also well known that different behaviors occur during this step.4,5 Since the concentrations of native PAHs were determined by using isotope dilution mass spectrometry (IDMS), which is based on the ratios of native PAHs to those of the spiked 13C-PAHs, the calculated concentration could change if different behaviors occur to a significant extent during cleanup steps. Thus, the effect of different behaviors during clean-up steps must also be examined. To examine this effect, we added a calibration solution that contained both native PAHs and 13C-PAHs to toluene at the step before concentration (B in Fig. 1) and the step after SPE (D in Fig. 1). Changes in the ratios (native PAHs/13C-PAHs) were +0.12% for Phen, +0.53% for Flu, +0.51% for BAA, +0.27% for BAP, and –0.58% for BGP. These values were comparable to or smaller than those observed during the extraction steps (from –1.4 to +0.81% for extraction at 150˚C, from –8.5 to –1.1% for extraction at 40˚C);13 the values were also less than the relative standard deviations of concentrations obtained by triplicate analyses (1.9% for Phen, 1.5% for Flu, 3.2% for BAA, 5.4% for BAP, and 4.4% for BGP). Moreover, it is known that PLE performs with repeatability comparable to those of other extraction techniques and observed concentrations are commonly measured to three significant figures. Thus, different behaviors of 13C-PAHs relative to native PAHs during clean-up steps have little effect on the concentrations obtained by IDMS, and the IDMS can reasonably be applied in analytical procedures that require concentration steps.
Conclusions We ascertained that the losses of relatively volatile PAHs occur mainly during the concentration steps. Because concentration steps are essential for the analysis of PAHs present at trace levels in samples, IDMS is strongly recommended for the accurate determination of PAHs. Because the influence of different behaviors on the concentration obtained by IDMS was confirmed to be small during the clean-up and concentration steps only, sufficient extraction of PAHs is also required for accurate determination.
References 1. Environmental Agency of Japan, “Endocrine disrupting chemicals interim investigation manual (water, sediments, aquatic organisms)”, 1998. 2. D. Byrne, “Commission directive 2002/69/EU. Official Journal of the European Communities L209/5-L209/14”, 2002. 3. T. J. Quinn, Metrologia, 1997, 34, 61. 4. S. R. Poulson and J. I. Drever, Environ. Sci. Technol., 1999, 33, 3689. 5. R. R. Harrington, S. R. Poulson, J. I. Drever, P. J. S. Colberg, and E. F. Kelly, Org. Geochem., 1999, 30, 765.
1248 6. A. Luch, “The carcinogenetic effects of polycyclic aromatic hydrocarbons”, 2004, Imperial College Press, London, 489. 7. B. J. Finlayson-Pitts and J. N. Pitts, Jr., “Chemistry of the upper and lower atmosphere: theory, experiments, and applications”, 2000, Academic Press, London, 969. 8. G. Carrera, P. Fernandez, R. M. Vilanova, and J. O. Grimalt, Atmos. Environ., 2001, 35, 245. 9. N. Ohkouchi, K. Kawamura, and H. Kawahata, Environ. Sci. Technol., 1999, 33, 3086. 10. V. M. Savinov, T. N. Savinova, G. G. Matishov, S. Dahle, and K. Næs, Sci. Total. Environ., 2003, 306, 39. 11. P. Fernández, R. M. Vilanova, and J. O. Grimalt, Environ. Sci. Technol., 1999, 33, 3716.
ANALYTICAL SCIENCES OCTOBER 2007, VOL. 23 12. J. Paasivirta, S. Sinkkonen, P. Mikkelson, T. Rantio, and F. Wania, Chemosphere, 1999, 39, 811. 13. N. Itoh, M. Numata, Y. Aoyagi, and T. Yarita, J. Chromatogr., A, 2007, 1138, 26. 14. N. Itoh, M. Numata, Y. Aoyagi, and T. Yarita, J. Chromatogr., A, 2006, 1134, 246. 15. H. Moriwaki, K. Katahira, O. Yamamoto, J. Fukuyama, T. Kamiura, H. Yamazaki, and S. Yoshikawa, Atmos. Environ., 2005, 39, 1019. 16. V. Ferreira, P. Fernández, J. Meléndez, and J. Cacho, J. Chromatogr., A, 1995, 695, 41. 17. K. Grob and E. Müller, J. Chromatogr., 1987, 404, 297.