1997). Explicit selection against this unfavorable corre- .... MATERIAL AND METHODS ..... The first principal component explains 35% of the total variance;.
Evaluation of Between-Line Variation for Within-Line Selection Against Ascites in Broilers K. H. de Greef,1 C. Kwakernaak, B. J. Ducro, R. Pit, and C.L.M. Gerritsen Institute for Animal Science and Health, PO Box 65, 8200 AB Lelystad, The Netherlands to be the most promising traits. Within lines, performance traits appeared to be highly correlated to ascites. Comparison of within-line variation to between-line contrasts revealed considerable differences. The high correlation of the blood gas traits with mortality was not present within lines. However, although the magnitude was considerably reduced, the nature of the blood gas traits in their relationship to ascites was similar within and between lines. The study primarily demonstrates that contrasts between lines carry systematic but limited information for within-line coherence. Therefore, line contrasts must be interpreted with care when aiming to study genetic variation and coherence within lines.
ABSTRACT Within-line opportunities for selection against ascites were studied in a data set comprising a 10line comparison. The study attempted to reveal whether contrasts between lines provide reliable candidate traits for within-line selection. Mortality was chosen as the reference trait. As no pedigree information was available, a trait was required that related mortality to the nonmortality data. By principal component analysis, such a trait (ASC_INDIC = ascites indicator) was developed from pathology data. The composite trait ASC_INDIC ranked lines well for their mortality figures (r = 0.96), from which it was concluded that ASC_INDIC represents an underlying continuous ascites trait. Between lines, blood gas traits seemed
(Key words: ascites, within-line variation, between-line variation, line comparison, selection traits) 2001 Poultry Science 80:13–21
traits. However, the choice for the component(s) to be used in breeding depends on (among others) the degree of heritability, the relationship to the syndrome as a whole, the relationship to performance, and the ease of measurement. Thus, identification of traits to be used in selection requires a study of relationships between ascites-related traits. Most literature on ascites is based on comparisons between-lines or on comparison of diseased and healthy individuals. Genetic selection to improve breeds is performed within line. Therefore, for breeding purposes, observations on individual animals within line are needed.
INTRODUCTION Breeding for performance characteristics has resulted in impressive increases in productivity of broilers. However, this increased productivity coincides with increasing incidences of ascites (Julian, 1993; Summers, 1994; Scheele, 1997). Explicit selection against this unfavorable correlated response is possible (Shlosberg et al., 1996); however, this requires availability of selection traits that are genetically related to ascites. Ascites in broilers (high altitude disease, pulmonary hypertension syndrome) is probably caused by chronic inadequacy of the oxygen supply, relative to metabolic demand. Low oxygen availability (high altitude) or high oxygen consumption (high performance or low ambient temperature) can increase the incidence of ascites. Pathological signs are (among others) an elevated packed cell volume (PCV), hypertrophy of the right heart ventricle, liver abnormalities, fluid expelled in the pericardium and in the abdomen, and eventually mortality (Summers, 1994). Several components of the physiological cascade of the ascites syndrome are available as candidate selection
Abbreviation Key: ADG = average daily gain; aHCO3 = arterial bicarbonate concentration; apCO2 = arterial carbon dioxide pressure; apH = arterial pH; apO2 = arterial oxygen pressure; ap_Sat = arterial percentage oxygen saturation; ASC_INDIC = ascites indicator; Breast = breast weight; %Breast = breast weight as percentage of BW; Cirrhosis = liver cirrhosis score; Color = liver color score; DFI = average daily feed intake; Dilatation = score for dilatation in right ventricle; FCR = feed conversion ratio; Fibrinogen = heart fibrinogen score; GI-tract = weight of the emptied gastrointestinal tract; %GI-tract = GI-tract as percentage of BW; Heart = heart weight; %Heart = heart weight as percentage of BW; Heart-API = arterial pressure index, right ventricle/ both ventricles; Liver = liver weight; %Liver = liver weight as percentage of BW; Lung = lung weight; %Lung = lung weight as percentage of BW; Moist = pericardial moist score; PCV = packed cell volume; rs = Spearman’s rank correlation test statistic; vHCO3 = venous bicarbonate concentration; vpCO2 = venous carbon dioxide pressure; vpH = venous pH; vpO2 = venous oxygen pressure; vp_Sat = venous percentage oxygen saturation.
Received for publication November 11, 1999. Accepted for publication August 17, 2000. 1 To whom correspondence should be addressed: K.H.deGreef@ID. Wag-UR.NL.
13
14
DE GREEF ET AL.
Nevertheless, comparison of broiler lines varying in ascites may reveal candidate traits for within-line selection. This dilemma is the objective of present study. The key question is whether differences between lines are informative for within-line choice between candidate selection traits. For this study, we used a comprehensive data set from a study of ascites in 10 lines of broilers (Buys et al., 1999). The observations of this data set were for individual animals, but there was no genetic information available within lines. Therefore, our analysis will be based on a phenotypic level. Below, a continuous trait describing ascites is developed to allow this analysis. This developed aggregate trait was evaluated by using ascites-related mortality as the reference trait. Subsequently, the developed aggregate trait was used to evaluate animal factors related to ascites within and between lines. Because of the ongoing development of methods within this study, the present paper is structured so that each phase is presented with its own method, results, evaluation, and conclusion. The present study aimed to evaluate whether ascitesrelated contrasts between lines provide applicable traits for genetic selection against ascites within lines. The central entry combined ascites-related traits by using principal component analysis. The aggregate traits developed in this way will be studied to compare within- and between-line variation. The results of the present study show the degree to which ascites is assessable on the individual animal and whether differences between lines are informative for selection within lines against ascites sensitivity.
MATERIAL AND METHODS Animals and Housing Male broilers from 10 different genetic lines were used (seven pure lines and three commercial crosses) and varied in performance and susceptibility to the ascites syndrome. Based on their daily gains, the lines were ranked and a letter code was assigned, corresponding with their rank number. Lines C, D, and E were commercially available broiler crosses. Lines B and F were pure broiler sire populations, whereas lines G, H, and K were pure broiler dam populations. Lines A and I were experimental broiler lines selected for high body weight and low feed conversion, respectively, as described by Leenstra and Pit (1987). Birds of B, F, G, H, and K were supplied by Euribrid B.V. (5830 AA, Boxmeer, The Netherlands). The day after hatching, the chickens were housed in pens initially containing 32 individuals per pen. Two climatic treatments were imposed: a normal ambient temperature (temperature gradually declining from 33 to 20 C at 4 wk of age; 68 pens) or a cold ambient temperature (temperature from 30 C declining by 1 C/d to 15 C at 16 d of age; 74 pens). The cold temperature regime was used as a challenge factor to induce ascites. Seven lines had eight repetitions (pens) in each temperature; the other three lines (A, H, and I) had six repetitions in the challenge
temperature and four repetitions in the normal ambient environment. In total, 142 pens were involved. The animals were fed a commercial two-phase broiler ration ad libitum and had continuous access to water from drinking cups. The pens (floorpens of 0.73 m2) were bedded with wood shavings. During the first 48 h, the birds had continuous light; after that period, a lighting pattern of 4 h light alternated with 2 h darkness was maintained until the end of the experiment. During the weekly days with measurements, light was continuous. The broilers were vaccinated for Newcastle disease and infectious bronchitis at 1 d of age, for Gumboro at 14 d, and again for Newcastle disease at 21 d.
Measurements At the end of Weeks 2, 3, 4, 5, and 6, a random individual was taken from each pen for collection of data. Animals to be analyzed were anesthetized by applying propofol (Rapinovet, 10 mg/ml) intravenously. Immediately after the thoracic cavity was opened, blood was sampled from the left and right atria. In this blood, blood gas traits were assessed. Several organs and body parts were weighed and scored for abnormalities on a fourpoint scale, where 0 = none or normal to 3 = abundant or abnormal. Details on most of the traits were described by Buys et al. (1999). Performance was characterized weekly on a pen basis by average daily gain (ADG), average feed intake per day (DFI), and feed conversion ratio (FCR), all based on changes in the last week. Five categories of traits were available: 1) traits that indicate presence of (subclinical) ascites, indicative traits; 2) performance traits; 3) body traits; 4) blood gas traits; and 5) hormone traits. All of these traits were available for all individual animals (n = 691). Indicative traits were weight ratio of the right ventricle wall relative to both ventricles and septum (Heart-API) (Huchzermeyer and De Ruyck, 1986); pericardial moisture score (Moist); score for dilatation of the right ventricle (Dilatation); heart fibrinogen score (Fibrinogen); liver color score (Color); liver cirrhosis score (Cirrhosis); and PCV. Performance traits were BW, (live body weight, g) at 14, 21, 28, 35, or 42 d of age; ADG (g/d); DFI (g/d); and FCR. Body traits were heart weight (Heart, g); heart weight as a percentage of BW (%Heart); breast weight including the underlying sternum (Breast, g); breast weight as a percentage of body weight (%Breast); liver weight (Liver, g); liver weight as a percentage of body weight (%Liver); weight of the lungs (Lung, g); lung weight as a percentage of body weight (%Lung); weight of the emptied gastrointestinal tract (GI-tract, g); and weight of the gastrointestinal tract as a percentage of body weight (%GI-tract). Blood gas traits were venous and arterial blood pH (vpH and apH, respectively), venous and arterial blood oxygen pressure (vpO2 and apO2, mm Hg), venous and arterial blood carbon dioxide pressure (vpCO2 and apCO2, mm Hg), venous and arterial blood bicarbonate
WITHIN- VERSUS BETWEEN-LINE ASCITES TRAITS IN BROILERS
concentration (vHCO3 and aHCO3, mmol/L), and venous and arterial percentage O2 saturation (vp_Sat and ap_Sat). Hormone traits were plasma triiodothyronine level and plasma thyroxine level, both as nanograms per milliliter. All animals that died during the experiment were subjected to necropsy; mortality was classified for presumable causes of death. Mortality is expressed in two ways: total mortality and ascites-related mortality. The latter comprised all mortality related to cardiovascular problems. Total mortality until 6 wk of age within Line × Temperature class was regarded as the main reference trait to rank the lines in their susceptibility for metabolic disorders. In the challenge environment, metabolic disorders (especially ascites) were the predominant cause of mortality.
Analysis All data were analyzed using SAS procedures (SAS Institute, 1989). Before analysis, the traits were categorized into two groups: a group clearly indicative for metabolic distortions, and the rest. The parameters Heart_API, Moist, Dilatation, Fibrinogen, Color, Cirrhosis, and PCV were classified as being indicative traits, merely describing the syndrome rather than causing it. This group of variables was referred to as the indicative traits. All other traits were referred to as candidate traits. The analysis was split into three phases, each with its own aim and methods. First, an aggregate trait was developed from the ascites-indicating traits. Next, this aggregate trait was related to the candidate traits in a single-trait approach. Finally, the aggregate trait was related to the candidate traits in a multitrait approach. Phase 1. Development of an Aggregate Trait Describing Ascites. Our aim was to develop a trait describing the degree of ascites for each individual animal. For this, principal components (SAS, procedure Princomp) were fitted to the observations of the ascites-indicating traits. This procedure resulted in the variable ASC_INDIC (ascites indictor), which was regarded as the degree of ascites for that individual. This ascites-indicating trait was validated by comparison of the ranking of the lines according to this trait with the ranking of the lines according to mortality. The rank correlation was tested with Spearman’s rank correlation test (SAS, procedure Corr). The test statistic was denoted as rs. Phase 2. Single-Trait Association of ASC_INDIC with the Candidate Traits. The aim was to study which single characteristics of the animal were related to ascites and to compare results of this within lines with those between lines. Between-line relations were assessed by correlating candidate traits with line mortality averages. Within-line relations were quantified by simple correlations between the candidate traits and ASC_INDIC (SAS, procedure Corr). In fact, the data of the individual animals (n = 691) represented a mixture of between-line information and withinline information. The between-line effects were removed by application of the model Y = Line + Temperature + Line × Temperature + e. The remaining residuals repre-
15
sented pooled, pure, within-line variation. To assess consistency for between-line and within-line variation, the resulting arrays of correlations were compared graphically. Phase 3. Multitrait Association of ASC_INDIC with the Candidate Traits. Our aim was to study combinations of animal characteristics in relation to ascites incidence. We used stepwise multiple regression. Stepwise regression implies that variables are subsequently entered into a regression model. First, the variable explaining most variation was added to the model. Next, the best additional variable was added, until no other inclusion of variables met the entry criterion (SAS procedure Reg, selection = stepwise, with the default values START = 0, STOP = 0, SLE = 0.15, and SLS = 0.15). The resulting model reflects the optimal combination of non-ascites variables predicting ascites. In this analysis, a regression model relates the observed degree of ascites to all other relevant traits available (the candidate traits). Similar to Phase 2, this analysis was performed on line mortality averages for the between-line data; within-line analysis was performed on the ascites indicator (ASC_INDIC), as developed in Phase 1. Consistency for between-line and within-line variations was assessed by statistically comparing the best three-trait between-line model with the best threetrait within-line model.
RESULTS General In Table 1, performance and mortality figures are presented for all 10 lines and for 2 environmental treatments. Lines were highly significantly different for performance and mortality (P < 0.001). The difference between the lines for mortality is especially expressed in the cold environment. Table 1 also indicates that, generally, lines with a high growth potential also have high mortality figures, but this finding does not hold for all lines. Expecially the commercial crossbreeds (C, D, and E) combine good performances with relatively low mortality.
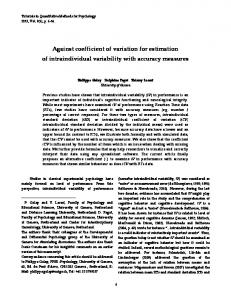
Phase 1: Development of an Aggregate Trait describing Ascites A set of principal components was fitted to the indicative traits Heart-API, Moist, Dilatation, Fibrinogen, Color, Cirrhosis, and PCV by using the observations from Weeks 2 to 6 (n = 691). The first two principal components fit well to the data. The first principal component explained 35% of total variance in the indicative traits; the second accounted for 18%. Principal components are by definition uncorrelated. In Figure 1, the elements of these two principal components are presented: the first principal component in the horizontal direction, the second vertically. The figure reveals that two groups of parameters are discernible: those highly correlated to the first principal component (mainly heart-related traits) and two traits that are predominantly
16
DE GREEF ET AL. TABLE 1. General line characteristics [average daily gain in g (ADG) and feed conversion ratio (FCR) at 35 d and percentage total and ascites mortality (until 42 d)] of 10 lines in two environments compared with the ascites indicator ASC_INDIC1, the latter calculated over environments (Both) Warm environment Line2
ADG
FCR
Total mortality
A B C D E F G H I K
72.2 69.6 67.1 66.7 66.0 62.7 60.1 57.6 52.3 51.9
1.57 1.54 1.63 1.63 1.63 1.54 1.61 1.63 1.47 1.68
15.9 5.1 5.7 4.0 6.8 6.8 4.0 3.4 6.8 5.7
Cold environment Ascites mortality
ADG
3.4 1.1 0.6 2.3 2.8 2.3 0.6 1.1 2.3 0.0
65.6 64.5 63.1 63.8 65.5 60.0 57.6 52.2 54.3 50.8
Both
FCR
Total mortality
Ascites mortality
ASC_INDIC
1.62 1.58 1.67 1.67 1.68 1.56 1.65 1.75 1.51 1.77
21.2 26.1 13.1 12.5 10.8 19.9 13.1 15.2 6.1 10.8
15.9 20.5 4.0 5.1 3.4 10.2 7.4 11.4 0.8 1.7
0.80 0.82 −0.34 −0.10 −0.30 0.22 0.04 0.12 −0.74 −0.45
1 The variable ACS_INDIC is the first principal component from the traits right ventricle/both ventricles HeartAPI, packed cell volume, scores of pericardial moisture, dilatation and fibrinogen of the heart, liver color, and liver cirrhosis and represents the continuous variable indicating ascites. 2 A and I = experimental broiler lines; B and F = pure broiler sire line; G, H, and K = pure broiler dam lines; C, D, and E = commercial broiler crosses.
related to the second component (expressed as lines in the vertical dimension). The similarity of the developed aggregate traits with ascites is quantified by assessing their correlation with total mortality. The rank correlation of line averages of total mortality (between-line information) with the first principal component (within-line information) equals 0.81 (P < 0.001). Thus, the within-line variation (combination of indicative traits) is closely related to the betweenline variations for total mortality. The first principal component ranked lines well in the cold environment (rs = 0.96, P < 0.001) but not in the warm environment (rs =
FIGURE 1. Composition of the two principal components fitted from the indicative ascites traits right ventricle per both ventricles (Heart_API), scores of pericardial moisture (Moist), heart dilatation (Dilatation), fibrinogen of the heart (Fibrinogen), liver color (Color), and liver cirrhosis (Cirrhosis), and packed cell volume (PCV). Correlations of these traits with the second principal component (vertical) were plotted against correlations of these traits with the first principal component. The first principal component explains 35% of the total variance; the second principal component explains 18%.
−0.04, ns). Ascites mortality was ranked similarly to the first principal component: rs = 0.82 overall (P < 0.001), 0.96 in the cold (P < 0.001), and 0.24 (NS; P > 0.10) in the normal ambient environment. The ranking of the lines according to the second principal component did not correlate significantly (rs = −0.27, P > 0.10) to the ranking according to total mortality. The high rank correlation between the first principal component and total mortality indicates that this component is an underlying continuous variable that is closely related to total mortality (which is predominantly ascites related). Thus, this first principal component is an ASC_INDIC trait assessable for individual animals and will be used as such in the following paragraphs. Line averages for ASC_INDIC are presented in Table 1. On basis of the limited relation to the between-line mortality, the second principal component was regarded to be only marginally or not related to ascites. This aggregate trait was, therefore, not analyzed or discussed further. In the rest of this study, ASC_INDIC (describing the ascites aggregate trait) will be used to compare betweenline variation (total mortality) with within-line variation (nonmortality ascites). Conclusions. The first principal component on pathology data represents an underlying continuous variable that is closely related to ascites-related mortality. Therefore, it can be regarded as a nonmortality ascites indicator (ASC_INDIC). Furthermore, the high rank correlation between ASC_INDIC and total mortality indicates that for these data, mortality and ascites (assessed on live animals) can be viewed as representing a common phenomenon, of which the mortality is the discrete threshold trait (mortality is extreme ascites). Thus, ASC_INDIC offers the opportunity to study relationships between within-line observations on candidate traits and ascites.
Phase 2: Single Trait Association of ASC_INDIC with the Candidate Traits Between Lines. In the first data column of Table 2, Line × Temperature averages (n = 20) of the candidate
17
WITHIN- VERSUS BETWEEN-LINE ASCITES TRAITS IN BROILERS
traits were correlated with total mortality. These correlations represent the coherence of the between-line mortality with the respective candidate traits. Heart and liver weights and percentages were especially correlated positively with mortality. Also, blood gas traits were clearly indicative for mortality. The performance traits were only marginally informative. Low line averages of the hormone thyroxine coincided with high mortality. The mean (absolute) correlation between mortality and the candidate traits was 0.35 (0.13 for performance, 0.31 for body traits, and 0.46 for blood gas values). Combined Between and Within Lines. Simple correlations between the principal component ASC_INDIC with the other traits were calculated by using all data (n = 691). The highest correlations (Table 2, second data column) were observed with the traits ADG, DFI, Heart, Liver, %GI-tract, and the blood gas traits aHCO3 and vHCO3 (r > 0.4, Table 2). The mean (absolute) correlation was 0.26 (0.38 for performance, 0.29 for body traits, and 0.21 for blood gas values). Within Lines. To further discriminate between the between-line variation and the within-line variation, the data were corrected for line and temperature. This analysis attempted to remove systematic between-line effects. The correlations in the residuals (representing pooled pure within-line relations) are presented in the third data
column of Table 2. Comparison with the second data column shows similar results, although most correlations were somewhat decreased. The mean (absolute) correlation was 0.24 (0.38 for performance, 0.29 for body traits, and 0.14 for blood gas values). Comparison of Between- and Within-Line Results. In Figure 2, a comparison of the between-line correlations with total mortality (each based on 20 observations) and the within-line correlations with ASC_INDIC (each based on 691 observations) is made. Figure 2 indicates that the coherence of the between-line results and the within-line results is present but limited. Full coherence would present all correlations on the Y = X-axis. The figure suggests a slight positive trend, but the correlation between the horizontal and vertical information is nonsignificant. For the performance traits, the correlation for within line and between line is 0, and for the body traits it is −0.17 (NS). In other words, line averages for performance traits are not informative for within-line relations, and body traits may give rise to a wrong conclusion. For the blood gas traits, the correlation between within-line and betweenline effects was 0.81 (P < 0.001). Thus, a line comparison was indicative for within-line coherence with regard to blood gas traits. The two hormone traits were unpredictable. Their correlations were considerable but completely reversed (Table 2).
TABLE 2. Correlations of the traits with total mortality (n = 20) with the ascites indicator (ASC_INDIC)1 in the combined between- and within-line data (n = 691) and with the ascites indicator purely within lines (n = 691)2 Analysis trait
Between-lines total mortality
ADG DFI FCR BW Heart wt Breast wt Liver wt Gastrointestinal (GI) tract wt Lung wt % Heart wt of BW % Breast wt of BW % Liver wt of BW % GI-tract of BW % Lung wt of BW APH APO2 APCO2 AHCO3
0.14 0.18 0.19 0.00 0.56 0.01 0.43 0.21 0.13 0.74 −0.05 0.79 0.01 0.13 0.23 −0.41 0.56 0.74 −0.37 0.32 0.27 0.54 0.76 0.43 0.26 −0.65
AP_SAT VpH VPO2 VPCO2 VHCO3 VP_Sat Triiodothyronine Thyroxine
Combined betweenand within-lines
Within-lines
ASC_INDIC
ASC_INDIC
0.43 0.43 0.31 0.36 0.51 0.36 0.43 0.07 0.36 0.07 0.35 −0.20 −0.42 −0.12 0.18 −0.19 0.21 0.43 −0.16 0.22 0.04 0.18 0.46 0.05 −0.24 0.11
0.43 0.42 0.31 0.37 0.46 0.36 0.40 0.04 0.35 −0.08 0.35 −0.29 −0.42 −0.13 0.17 −0.12 0.08 0.31 −0.09 0.20 0.03 0.06 0.33 0.02 −0.28 0.20
1 The variable ASC_INDIC is the first principal component from the traits right ventricle/both ventricles (Heart_API), packed cell volume, scores of pericardial moisture, dilatation and fibrinogen of the heart, liver color, and liver cirrhosis and represents the continuous variable indicating ascites. 2 ADG = average daily gain; DFI = average daily feed intake; FCR = feed conversion ratio; vpH, apH = venous, arterial pH; vpO2, apO2 = venous, arterial oxygen pressure; vpCO2, apCO2 = venous, arterial carbon dioxide pressure; vHCO3, aHCO3 = venous, arterial bicarbonate concentration; vp_Sat, ap_Sat = venous, arterial percentage oxygen saturation.
18
DE GREEF ET AL.
FIGURE 2. Similarity between total mortality and the ascites indicator [The variable ASC_INDIC is the first principal component from the traits Heart_API (right ventricle per both ventricles), packed cell volume, scores of pericardial moist, dilatation, and fibrinogen of the heart, liver color, and liver cirrhosis, and represents the continuous variable indicating ascites]. Correlations of the measured traits (n = 691) with the ascites indicator ASC_INDIC (vertical axis) were plotted against between-line-based correlations of the traits with mortality (n = 20). 䊐 = performance traits of BW, average daily gain, average daily feed intake, and feed conversion ratio; 䊊 = body traits of heart weight and heart weight as a percentage of BW, breast weight and breast weight as a percentage of BW, liver weight and liver weight as a percentage of BW, lung weight and lung weight as a percentage of BW, weight of the gastrointestinal tract and gastrointestinal tract weight as a percentage of BW; ▲ = blood gas traits of venous and arterial pH, venous and arterial oxygen pressures, venous and arterial carbon dioxide pressures, venous and arterial bicarbonate concentrations, and venous and arterial percentages of oxygen saturation; 〫 = hormone traits of plasma triiodothyronine level and plasma thyroxine level. Data are from Table 2. ASC_INDIC
Conclusions. The within-line, single-trait relations of blood gas traits with ascites show significant similarity with between-line relations. However, the within-line correlations are lower in magnitude. Between-line, singletrait relationships of performance and of body traits were not indicative for within-line ascites sensitivity.
Phase 3: Multitrait Association of with the Candidate Traits
ASC_INDIC
To further study the relationship of ascites with the candidate traits, a stepwise multiple regression (predicting ascites from combinations of candidate traits) was performed on the line averages (n = 20, between-line evaluation) and on the individual data (n = 691, combined within- and between-line evaluation). The resulting models and the order in which traits entered the regression model are presented in Table 3. Between Lines. Between-lines mortality (n = 20) was best predicted by the combination of %Liver, vHCO3, FCR, %Heart, vp_Sat, ADG, and BW. These seven traits jointly explained 95% of the variation in total mortality. The first three traits of the model explained 84% of the variation in total mortality (R2 = 0.84 ≡ 88% of the total explained variation). Combined Within and Between Lines. Such a stepwise regression on the combined within- and between-
line data (n = 691) had 10 significant traits in the model that explained 50% of the variation of ASC_INDIC. The order in which the traits entered the model was Heart, %Heart, vHCO3, GI-tract, Liver, vpH, vp_Sat, vpCO2, %GI-tract, and DFI. The first three traits that entered the model explained 42% of the variation of ASC_INDIC (R2 = 0.424) and 85% of all total explainable variation. Within Lines. Removal of systematic between-line effects by precorrection for line and temperature effects (aiming at studying pure within-line variation) revealed a model of 10 significant traits that explained 35% of the variation of ASC_INDIC. The order in which the traits entered the model was similar to the combined withinand between-line data but had lower significance. The best three-trait prediction was comprised Heart, GI-tract, and vHCO3. These traits explained 29.4% of the variation of ASC_INDIC (R2 = 0.294) and 85% of all total explainable variation. Comparison of Between- and Within-Line Results. Similarity of the within- and between-line relations is studied by cross application of the best three-trait models. The best three-trait between-line model (%Liver + vHCO3 + FCR) was also applied to the within-line dataset. Similarly, the best within-line model (Heart + GI-tract + vHCO3) was also applied to the between-line data (n = 20). Table 4 presents the resulting predictions. The best between-line model explained 84% of total variation in the between-line data (already presented in Table 3), whereas for the alternative model, R2 was reduced to 65%. This comparison indicates that, for the line averages, the best within-line model was different (P < 0.001) from the best between-line model. Similarly, the goodness of fit in the within-line data was considerably reduced (P < 0.001) when the best within-line model was applied (29% → 17%). Both reductions in quality of prediction indicated that ascites sensitivity was expressed differently in line averages (between-line) than in individual animal data (within-line). Conclusions. Within and between line variations in ascites, respectively, mortality can be predicted well from combinations of body and blood gas traits. The optimal predictions differ between both types of data and imply that between-line contrasts differ from within-line relations.
DISCUSSION Aim of Present Study Genetic factors of nonperformance characteristics are often assessed by comparison of lines or breeds. This assessment may be based on well-defined material, such as divergent selection lines, or more facile comparisons could be made by sampling from the wide variation of lines present worldwide. Such line comparisons may reveal physiological mechanisms to explain why lines differ in certain characteristics. Furthermore, such line comparisons may reveal candidate traits for breeding purposes. However, such differences must be evaluated within line,
19
WITHIN- VERSUS BETWEEN-LINE ASCITES TRAITS IN BROILERS TABLE 3. Stepwise regression: prediction of mortality or ascites from combinations of traits Between-lines
Within- and between-lines
Trait1
Order2
R2
P3
% Liver wt of BW vHCO3 FCR % Heart wt of BW
1 2 3 4 5 6 7
0.62 0.80 0.83 0.87 0.90 0.91 0.95
*** ***
VP_SAT
ADG BW Heart wt Gastrointestinal (GI) tract wt Liver wt VpH VPCO2 % GI-tract of BW DFI VPO2
† † †
Order2
Within-lines
R2
P3
3
0.42
***
2 7
0.37 0.49
1 4 5 6 8 9 10
0.26 0.45 0.47 0.48 0.49 0.50 0.50
Order2
R2
P3
3
0.29
***
*** ***
4
0.31
***
*** *** *** *** * * *
1 2 5 6 8 10 7 9
0.21 0.27 0.32 0.33 0.34 0.35 0.33 0.34
*** *** ** ** * * * *
ns *
1 ADG = average daily gain; FCR = feed conversion ratio; DFI = average daily feed intake; vpH = venous pH; vpO2 = venous oxygen pressure; vpCO2 = venous carbon dioxide pressure; vHCO3 = venous bicarbonate concentration. 2 Order in which the trait is entered into the stepwise model. 3 Significance of the additional explained variation; NS: P > 0.10; †P < 0.10; *P < 0.05; **P < 0.01; ***P < 0.001.
as lines represent complex combinations of genes and traits. Differences between lines that relate to certain characteristics (e.g., ascites sensitivity) may not be the steering mechanisms within lines. The present study addresses this problem. Ascites is a complex problem. Genetic selection may focus on the simplest trait, mortality, or on the more continuous disease indicators, pathological traits. However, insight into the physiological background and differences in between lines may reveal line strategies that explain relative (in)sensitivity. But the question is to what extent within-line traits revealed in this way are reliable for within-line selection. The studied data set allowed evaluation of this question, thanks to the relatively large number and wide variation of lines involved and the reasonable number of observations per line. The fact that only phenotypic data were present was merely a challenge rather than a problem. The principal component-based trait ASC_INDIC was successfully developed to deal with this challenge.
Justification of the Applied Method The comparison of the within- and between-line variation in the present study is based on comparison of line
averages of mortality and animal observations of nonmortality ascites. Thus, coherence between mortality and ascites is presumed. This is justified by 1) the successful development of a nonmortality ASC_INDIC, based on individual animal pathology observations and 2) the highly significant correlation between this nonmortality ASC_INDIC and mortality (rs = 0.81). The choice for total mortality instead of ascites mortality was based on the incidence of both figures. The incidence of total mortality was higher, resulting in more accurate figures. Results confirmed the choice, as the between-line total mortality correlated highly significantly with ascites mortality (r = 0.91) and as the rank correlation of the nonmortality trait ASC_INDIC was similar for total mortality as for ascites mortality. The present study compared line averages in mortality with within-line variation in ascites. Formally, the study could also have been performed by comparing line averages in the developed ascites trait with the within-line variation in this trait. The choice for mortality was based on a preference for a tangible trait approach. Mortality is a realistic trait, measured directly on animals, whereas the ASC_INDIC-trait is merely a statistically developed feature. Basing the comparison fully on ASC_INDIC would lack
TABLE 4. Comparison of the predictive quality through reciprocal application of optimal models Between-line data 2
Best between-line model Best within-line model Significance of difference2
R
RSD
84% 65% ***
2.8 4.2
Within-line data 1
2
R
RSD
17% 29% ***
1.4 1.3
RSD = Residual standard deviation. The best model for between-line data is applied to within-line data (alternative model) and the other way round. Statistics of the optimal model are presented on the diagonal; statistics of application of the alternative model are presented off the diagonal. ***P < 0.001. 1 2
20
DE GREEF ET AL.
a realistic and assessable standard that mortality provides.
Candidate Traits for Selection Against Ascites In evaluating relationships to ascites, the data indicate that both pathology traits, body and blood gas traits, are related to mortality or ascites. Performance traits were shown to be within-line risk factors for ascites. Their average correlation to ASC_INDIC was greater than 0.3. This high relationship was not pointed out by the line comparison. The body traits (relative and absolute organ and tissue weights) roughly showed a similar phenomenon. The latter can be explained by their part-to-whole nature. Organ and tissue weights represent a part of the BW, which is a performance trait. The two exceptions (heart and liver traits) showed direct ascites relationships. The heart and liver especially showed ascites-induced changes, which was reflected in their weights and, thus, their proportions to BW. The blood gas traits showed different results. Venous and arterial blood gas traits were very informative in ranking chicken lines in their mortality risks. However, their average correlations with within-line ascites were very limited. At first, a convincing conclusion would seem to be that the between-line differences were not present within the lines. This conclusion needed to be refined. Albeit that the correlations were considerably lower within the lines than between the lines, there was still remarkable resemblance. The correlations of the blood gas values to mortality in the line averages were higher in nature, but the correlations within the lines rank were similar. This consistency (rs = 0.8) is reflected in Figure 2, in which the correlations of the blood gas traits change in a predictable way. Thus, within-line variation of blood gas traits is of the same nature but lower in magnitude than that between lines. This consistency seems to confirm their physiological relationship to the ascites syndrome, but their considerably reduced correlations may also indicate relatively limited genetic (co)variation within lines (≈ low heritability or limited genetic correlation to ascites). The consistency of the blood gas values makes them attractive selection candidates. Their usefulness is mainly determined by (apart from effort needed for measurement) their heritability and their genetic correlations with productivity and ascites and remains to be assessed. In the single-trait analysis, a direct comparison of between- and within-line relations to ascites for each trait is relatively simple (correlations). The multitrait study (Phase 3) also quantifies the difference between-line comparisons and within-line variation. It was shown that the best traits from line information are substantially different from best traits from individual animal information. The nature of these differences cannot be studied without extensive study of the mutual covariances. The singletrait study (Phase 2, as visualized in Figure 2), however, does give information on this. A principal component study in the candidate traits could also provide further
insight into exchangeability of the different candidate traits, which goes well beyond the scope of present study. Here, on statistical grounds, line comparisons generally give less-than-optimal combinations of traits for withinline selection. Note that the multitrait study (Phase 3) indicates considerably different traits than the single-trait study (Phase 2). In the single-trait study, performance traits were very good within-line ascites predictors. However, they hardly contributed to the multitrait analysis. Comparison of the traits (Table 2 and Table 3) shows that Heart is indeed the best first predictor (highest correlation to ASC_INDIC in Table 2, first to enter the model in Table 3). The correlations in Table 2 suggest that performance traits would have a good chance of entering next (also high correlations to ascites). They do not enter because their covariance with ascites is almost entirely overlapping with that of Heart. It is striking that GI-tract is the second trait to enter in the prediction model, although its single-trait correlation to ASC_INDIC is only 0.045. The major conclusion of this finding is that there is a lot of covariance among the traits, which makes them easy to be interchanged. A final note to be made is the definition of ascites sensitivity. Ascites sensitivity can be expressed as performance reduction due to the challenge and incidence of the disease. Alternatively, ascites sensitivity can also be expressed in terms of incidence and degree of pathological abnormalities. These two ascites-definitions are not fully congruent in present data. This topic has been touched upon slightly for present data (de Greef et al., 1998) but requires further study. In conclusion, there are clear relationships between mortality, ascites-related mortality, and a linear combination of ascites-induced nonmortality pathology traits. Nonmortality pathology traits can be used effectively to predict mortality in cold-housed broilers. Line comparisons provide several candidate traits for within-line selection. Line averages of performance and body compositional traits appear to have a different relationship to ascites than does within-line variation. Simple within-line correlations indicate that performance traits may be good candidate selection traits. Unfortunately, use of such indicators requires optimization with selection for productivity, because of the unfavorable correlation between performance and ascites. Line contrasts in blood gas values overestimate their applicability for within-line selection, but the within-line coherence is of similar nature as the between-line variation. This coherence indicates that the nature of the blood gas traits is favorable for being applied in selection against ascites. Genetic parameters remain to be established. When using statistical combinations of traits, betweenline contrasts provide models that are considerably less effective than models based on within-line data, which indicates that polygenic variation between lines differs considerably from within lines.
REFERENCES Buys, N., C. W. Scheele, C. Kwakernaak, J. D. van der Klis, and E. Decuypere, 1999. Performance and physiological parame-
WITHIN- VERSUS BETWEEN-LINE ASCITES TRAITS IN BROILERS ters in broiler chicken lines differing in susceptibility to the ascites syndrome: 1. Changes in blood gases as a function to of ambient temperature. Br. Poult. Sci. 40:135–139. de Greef, K. H., C.L.M. Gerritsen, and J. K. Oldenbroek, 1998. Within and between line variation in ascites related traits in broilers. Proceedings of the 6th World Congress on Genetics Applied to Livestock Production 24:267–270. Huchzermeyer, F. W., and A.M.C. de Ruyck, 1986. Pulmonary hypertension syndrome associated with ascites in broilers. Vet. Rec. 119:94. Julian, R. J., 1993. Ascites in poultry. Avian Pathol. 22:419–454. Leenstra, F. R., and R. Pit, 1987. Fat deposition in a broiler sire strain. 2. Comparisons among lines selected for less abdomi-
21
nal fat, lower feed conversion and higher body weight after restricted and ad libitum feeding. Poultry Sci. 66:193–202. SAS Institute, 1989. SAS/STAT威 User’s Guide, Version 6, Fourth Edition, Cary, NC. Shlosberg, A., M. Bellaiche, G. Zeitlin, M. Ya’-acobi and A. Cahaner, 1996. Hematocrit values and mortality from ascites in cold-stressed broilers from parents selected by hematocrit. Poultry Sci. 75:1–5. Summers, J. D. 1994. Ascites and related metabolic diseases. Pages 83–94 in: Recent Advances in Animal Nutrition. P. C. Garnsworthy and D.J.A. Cole, ed. Butterworths, London, UK. Scheele, C. W., 1997. Pathological changes in metabolism of poultry related to increasing production levels. Vet. Q. 19:127–130.