AbstractâPositron range effect is one of the fundamental factors limiting the spatial resolution of PET images. In statistical image reconstruction methods ...
2005 IEEE Nuclear Science Symposium Conference Record
M11-324
Evaluation of MAP Image Reconstruction with Positron Range Modeling for 3D PET † Bing
Bai, ‡ Richard Laforest, † Anne M. Smith and ¶ Richard M. Leahy † Siemens Preclinical Solutions, 810 Innovation Dr., Knoxville, TN 37932 ‡ Mallinckrodt Institute of Radiology, Washington University Medical School, St.Louis, MO, 63110 ¶ Signal and Image Processing Institute, University of Southern California, Los Angeles, CA 90089
Abstract— Positron range effect is one of the fundamental factors limiting the spatial resolution of PET images. In statistical image reconstruction methods, positron range effects can be incorporated into the system model. The resolution recovery by modeling positron range results in an inevitable increase of image noise. We compare the resolution and noise properties of the images reconstructed with or without positron range modeling in this paper. Simulation results show that positron range modeling can lead to improved resolution vs. noise trade-off.
I. I NTRODUCTION One of the factors that fundamentally limits the spatial resolution of PET images is positron range [1]. Recent development of new detector technology has reduced crystal size and now there are small animal PET scanners with near 1mm intrinsic spatial resolution such as microPET II [2] and microPET Focus [3]. This resolution is comparable to the positron ranges of the isotopes that are commonly used (e.g., the mean positron range of 18 F is 0.5mm). High-energy isotopes with long positron ranges have also been used [4]. The effect of positron range is a blurring of the reconstructed image. Based on a measured positron range function, Derenzo [5] proposed a method to remove the blurring in images reconstructed using FBP. We have implemented positron range modeling in our 3D MAP reconstruction [6]. Three models were proposed in [6] without quantitative evaluation: a shift-invariant blurring model, a truncated shift-invariant blurring model and a convolutional model. In this paper we will investigate the resolution and noise properties of the MAP images reconstructed using the truncated shift-invariant blurring model and compare with MAP reconstruction without positron range modeling. II. P OSITRON R ANGE M ODEL The range of the positron depends on its energy as well as the effective atomic number and atomic weight of the medium it travels through. In most cases a positron first loses all of its energy through inelastic collisions and then annihilates with an electron. In each inelastic collision the positron only loses a small part of its energy, resulting in many collisions happening This work was partly supported by the National Institute of Biomedical Imaging and Bioengineering under Grant No. R01 EB00363.
0-7803-9221-3/05/$20.00 ©2005 IEEE
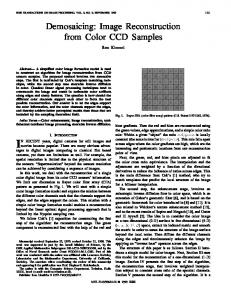
before annihilation and therefore the trajectory of each positron is tortuous [1]. We model positron range in an infinite homogeneous medium using a shift-invariant blurring operator. Since positrons are emitted isotropically, it is reasonable to assume that the annihilation point distribution in a homogeneous medium is also isotropic. Then the distribution of annihilation points is a 3D isotropic density function centered at the origin. The shape of the density function is determined by a Monte Carlo simulation using EGS4 [4]. This isotropic density function is used to calculate the positron range blur kernel in our MAP reconstruction algorithm. Figure 1 shows the distribution of positron annihilation points emitted from a 68 Ga point source in water and the central slice of the blur kernel used in image reconstruction. The infinite homogeneous assumption is valid for phantoms in which the activity is constrained to the phantom interior so that few positrons escape from the boundary of the object before annihilation. However, in most in vivo studies, activity close to the skin/air boundary can result in a significant fraction of positrons escaping from the animal so that the infinite homogeneous model is not accurate. As we have shown in [6], failure to account for air/skin boundaries when modeling positron range can result in severe artifacts when using the infinite homogeneous model. Another model we proposed in [6] is a convolutional model which approximates the propagation of positrons emitted from a point source. Subsequent evaluation of this method revealed little improvement over the infinite homogeneous model. We believe that the reason for this poor performance is that while we do model spatial inhomogeneities in range, we do not account for the anisotropic nature of the propagation of positrons at each stage of the convolutional model. At the voxel scale at which the convolutions are performed, the isotropic model is not sufficiently accurate. However, we have found reasonable performance using a simpler model based on a truncated shift invariant range function. In this case we assume the body is homogeneous and range is isotropic within the body. We approximate the loss of positrons that leave the body without annihilating by simply truncating the range blurring function at the soft tissue/air boundary. Here we report on studies of the truncated shift-invariant blurring model.
2686
0
10
4000
−1
10
3500 −2
10
3000 −3
number of events
pdf
10
−4
10
−5
10
2500 2000 1500
−6
1000
−7
500
10 10
0 −20
−8
10
0
2
4 6 distance (mm)
8
−15
10
(a)
(a)
−10
−5
0 5 distance (mm)
10
15
20
(b)
Fig. 2. Simulated positron annihilation point distribution: (a) central slice; (b) profile through the center of line source 0.035 0.03 0.025 0.02 0.015 0.01 0.005 0 35 30
35
25
30
20
25 15
20 15
10
10
5
5
(b) (a) Fig. 1. Positron range model calculated from Monte Carlo simulation: (a) Distribution of positron annihilation points, 68 Ga point source in water; (b) Central slice of the blur kernel used in image reconstruction, voxel size is 0.4×0.4×1.2mm
III. S IMULATION R ESULTS A. Monte Carlo Simulation To evaluate the effect of positron range modeling on the quality of PET images, a uniform cylindrical phantom with a line source was simulated. We used the geometry of the microPET R4 scanner. This phantom is 25mm in diameter and 10mm long, the phantom is surrounded by a 3.175mm Lucite wall. The line source is 0.5mm in diameter and 10mm long and was positioned at the center of the cylindrical phantom. This phantom was simulated in EGS4. We generated 100 million positrons and tracked their trajectories as they interact with the surrounding medium. The position of each annihilation point was recorded. The activity ratio between line source and background is 80:1. The central slice of the distribution of positron annihilation points and the profile through the center of line source are shown in Figure 2. The Monte Carlo simulation result was forward projected using a microPET R4 scanner model. This forward projector takes into account the geometry effect and the photon noncollinearity, inter-crystal scatter and crystal penetration. From this “noiseless” data we reconstructed images using MAP. Figure 3 shows a MAP image reconstructed with smoothing parameter β = 0.001. The image shows ring artifacts caused by ill-conditioning of the problem. Two methods were investigated to reduce the ring artifact: increase the smoothing parameter and modify the positron range kernel. Figure 4 (a) shows an
(b)
Fig. 3. Images reconstructed from noiseless data, β = 0.001: (a) central slice; (b) profile
image reconstructed with a much higher β. Figure 4 (b) shows the reconstruction result using a modified positron range kernel, which was truncated at 1.2mm from emitting point. The rings are greatly reduced in both cases. B. Resolution and Noise Measurement Pseudo Poisson data was generated from the “noiseless” sinogram described in previous section. We measured the resolution and noise properties of the images reconstructed from this noisy data. As shown in the previous section, truncation of the range kernel can reduce artifacts in the image. Furthermore, as the extent of the range kernel is reduced, the computational
(a)
(b)
Fig. 4. Images reconstructed from noiseless data: (a) β = 0.1, full kernel; (b) β = 0.001, kernel truncated at 1.2mm
2687
0.35 no range 1.2mm 2.4mm 3.6mm
0.3
0.35
0.2
0.25
0.15
0.1
0.05
0 1.5
no range 1.2mm 2.4mm 3.6mm
0.3
normalized SD
normalized SD
0.25
0.2
0.15
0.1
2
2.5
3
3.5
4
4.5
0.05
5
FWHM (mm) 0 2
4
6
8
10
12
14
CRC
Fig. 5. FWHM vs. noise standard deviation as a function of truncation point for the positron range kernel Fig. 6. CRC vs. noise standard deviation as a function of truncation point for the positron range kernel
120
100
image value
80
60
40
20
0 −25
(a)
−20
−15
−10
−5
0
5
10
15
20
25
10
15
20
25
10
15
20
25
10
15
20
25
distance (mm)
120
100
image value
80
60
40
20
0 −25
(b)
−20
−15
−10
−5
0
5
distance (mm)
120
100
image value
80
60
40
20
0 −25
(c)
−20
−15
−10
−5
0
5
distance (mm)
120
100
80
image value
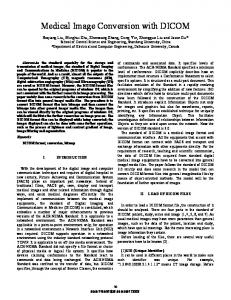
cost of range modeling, which we perform using a spatial convolution, is reduced, roughly in proportion to the number of nonzero voxels remaining in the truncated kernel. In this study, the positron range kernel was truncated at three different distances from the source: 1.2mm, 2.4mm and 3.6mm. To ensure convergence of the algorithm, we run 100 iterations of MAP in each study. The smoothing parameter β varies from 10−4 to 5. Two criteria are used to measure the resolution of the image: contrast recovery coefficient (CRC) [7] and full-widthat-half-maximum (FWHM). In this study CRC is defined as the ratio between the maximum value in the image and the mean of the background. FWHM was measured from a profile through the center of the line source. Four ROIs were drawn in the background, and the standard deviation of the ROIs were normalized by the mean of the same ROIs. We use this normalized standard deviation as a measurement of the image noise. All the measurements were restricted to the central image slice. Figure 5 shows the CRC vs. normalized SD result. From Figure 5 we can see that without positron range modeling, the resolution of the image is limited by the positron range effect, in this case to about 2.8mm FWHM or CRC ≈ 3.8, further decreasing β increases the noise without improving the resolution of the image. When the positron range model is incorporated in the MAP reconstruction, image resolution continues to improve as we decrease β, however it exhibits an inevitable increase in noise as a result of resolution recovery. Figure 5 also shows that using the full positron range kernel leads to the best improvements in the resolution vs. noise trade-off; the resolution of image at matched noise levels are improved compared to cases where positron range is ignored. Figure 6 shows the CRC vs. normalized SD result. Similar to the FWHM curve, MAP images with positron range modeling show better CRC at matched noise levels. Due to the long tailed distribution of the positron range effect (see Figure 2), the differences between the CRC curves are larger than those in the FWHM curves, so that FWHM alone may not be appropriate for evaluating the efficacy of correction for positron range. Figure 7 compares the central slice of MAP images reconstructed with different positron range models. These images have similar noise levels, the normalized standard deviations
60
40
20
(d)
0 −25
−20
−15
−10
−5
0
5
distance (mm)
Fig. 7. Central slice and profile of images reconstructed from noisy data: (a) no positron range model; (b) range kernel truncated at 1.2mm; (c) range kernel truncated at 2.4mm; (d) range kernel truncated at 3.6mm
2688
are between 11.53% and 13.01%. IV. D ISCUSSION Positron range limits the spatial resolution of PET images. By modeling the positron range in our system model, we can significantly improve the image resolution. However this also causes an inevitable increase in the noise. In this paper we show that at matched noise levels, the image resolution and contrast is improved with positron range model. We investigate the use of truncating the positron range kernel to reduce ring artifacts and reduce computation cost. Results show that although truncating the range kernel can reduce ring artifacts, the best resolution vs. noise trade-off is achieved with full range kernel. Future works include exploring other methods to modify the range kernel, e.g. by looking at the frequency response of the kernel, and the evaluation of image quality using experimental data. R EFERENCES [1] C. S. Levin and E. J. Hoffman, Calculation of Positron Range and Its Effect on the Fundamental Limit of Positron Emission Tomography System Spatial Resolution, Phys. Med. Biol. 44, pp. 781–799, 1999 [2] Y. Yang, Y. C. Tai, S. Siegel, D. F. Newport, B. Bai, Q. Li, R. M. Leahy and S. R. Cherry, Optimization and performance evaluation of the microPET II scanner for in vivo small-animal imaging, Phys. Med. Biol. 49(12), pp. 2527–2545, 2004 [3] Y. C. Tai, A. Ruangma, D. Rowland, S. Siegel, D. F. Newport, P. L. Chow and R. Laforest, Performance Evaluation of the microPET Focus: A ThirdGeneration microPET Scanner Dedicated to Animal Imaging, J. Nucl. Med. 46(3), pp. 455–463, 2005 [4] R. Laforest, D. J. Rowland and M. J. Welch, MicroPET Imaging with Non-Conventional Isotopes, IEEE Trans. Nucl. Sci. 49(5), pp. 2119–2126, 2002 [5] S. E. Derenzo, Mathematical Removal of Positron Range Blurring in High Resolution Tomography, IEEE Trans. Nucl. Sci. 33(1), pp. 565–569, 1986 [6] B. Bai, A. Ruangma, R. Laforest, Y. C. Tai and R. M. Leahy, Positron Range Modeling for Statistical PET Image Reconstruction, Conference Record 2003 IEEE Nuclear Science Symposium and Medical Imaging Conference, 4, pp. 2501–2505, 2003 [7] J. Qi and R. M. Leahy, Resolution and noise properties of MAP reconstructions in fully 3D PET, IEEE Trans. Med. Imag. 19, pp. 493–506, 2000
2689