Evaluation of marking and tagging methods for genetic studies in carp Y BASAVARAJUt, B S RENUKA DEVI, G MUKTHAYAKKA, L PURUSHOTHAMREDDY, G C MAIR*, E E RODERICK* and D .1 PENMAN** Fisheries Research Station, University of Agricultural Sciences,Hesaraghatta,Bangalore 560089, India *Univeristy of Wales Swansea,Singleton Park, Swansea,SA2 8PP, Wales, UK **Institute of Aquaculture, Universit), of Stirling, Stirling FK9 4LA, Scotland tCorresponding author (Fax, 91-80-8466451; Email,
[email protected]). A variety of marking and tagging methods were tested on common carp (Cyprinus carpio L.) with the aim of identifying suitable methods for genetic studies in this and other speciesof carp. Elastomer and Alcian blue dye marking; Cold and Silver nitrate branding; Floy, Fingerling, Carlin disc and visible implant tags; and fin clipping were all tested on a range of sizes of common carp (from mean weights of 10-25 g up to 600-800 g). The branding and tagging methodstesteddid not give satisfactoryretentionrates. A combination of elastomer marking and fin clipping was then tested as a method for strain identification in a growth comparison trial on catla (Catla catla Hamilton) and found to be satisfactory for this purpose. Passive integrated transponders (PIT) tags were used to individually identify catla of wild or hatchery origin being grown for use as broodstock. These had almost 100% (98.8%) retention rates, but are expensive compared to most other tagging methods.
.Introduction
Nielsen (1992) lists seven main categories of tagging techniques,namely (i) external tags, (ii) external marks, Tagging and marking is used in fisheries researchand (iii) internal tags, (iv) natural marks, (v) biotelemetrin managementfor estimating fish population sizes, migra- tags, (vi) genetic identifiers, and (vii) chemical marks. tion studies, growth rates in natural environments and The choice of the tagging/marking technique depends genetic research with a great deal of researchon many mainly on the value of the fish and the number of species but largely excluding some species groups such individuals, batches or strains being handled and the as the carp (Parker et al 1990). In genetic improvement objectives for which the technique is used. The design programmes it is often essentialto mark individual fish, of a genetic improvementprogramme may be influenced families or strains. This helps in comparisonof perform- by the availability of appropriate marking/tagging techance of different groups, identification of broodstock for niques. For example the number of different strains or spawning, etc. Limitations in facilities and experimental families in a selective breeding programme which could design considerations often make it desirable to conduct be communally evaluatedu~ing external marks as idenperformancetrials in communally stockedtanks or ponds, tifiers would be a function of the number of available where reliable marking techniquesare essential in order marks (for example, different colours of dyes) and the to discriminate between the mixed stocks. Since consid- number of potential marking sites on the fish using a erable money and time is spent on developing a genetic particular technique. The intensity of selection would improvement programme,it is most desirablethat reliable, also be influenced by the number of fish that could cost-effective and adaptable marking, tagging methods realistically be tagged or marked. are developed. A number of these marks and tags have been tried Keywords. Marking; tagging; genetics; carp J. Biosci., 23, No.5, December 1998, pp 585-593. @ Indian Academy of Sciences
585
2. 2.1
586
Y Basavaraju et at
on different species for different purposes with varying degree of success (Saxena et al 1979; Jhingran et al 1981; Khan et al 1988; Roy et al 1991 on carp and Herbinger et al 1990 on Atlantic salmon). As part of a project on the genetic improvement of cultivable carp, several marking and tagging methods were evaluated, using the common carp as the main test species. The objective was to establishreliable methods of tagging and marking for carp for use in such research, principally for identification of individual brood fish and for marking strains and families for communally stocked growth trials.
Materials and methods The trials on the common carp (Cyprinus carpio L.) and catla (Catla calla Hamilton) were conducted in two locations, at the Fisheries ResearchStation, Hesaraghatta, Bangalore and at the fish farm of the State Department, Department of Fisheries at BR Project (BRP), Shimoga (300 km from Bangalore). All fish were anaesthetized using 250 ppm benzocaine (unpublished results) before applying tags or marks.
2.
Details of tags/marks used and application procedures
2.1a Elastomer dye marking: The visible implant fluorescentelastomerdevelopedby and purchasedffom North West Marine Technology Inc., Seattle, USA, provides externally visible, subcutaneous marks. The system utilizes a biocompatible, two part elastomer material which contains fluorescent colouring. Within 1-2 h, the mixture cures to a solid elastomer having fluorescent pigments in a cohesive, well defined biocompatible mark. The two components were mixed using the double barrelled syringe provided and dispensed into I ml syringes fitted with 24, 22 or 19g needles.The needles were inserted below the skin on the ventral surface of the fish and the elastomerinjected subcutaneously.Any excess elastomer remaining on the surface was wiped off immediately to prevent the formation of an elastomer "tail" which could have caused loss of the injected elastomer if this caught on nets or rough surfaces.
2.ld Silver nitrate marking: Large scales generally cover the flanks and the belly of carp making these locations unsuitable for external marks. Hence different shapes of marks were made on the opercular region using silver nitrate pencils. 2.le T-bar anchor tags (Flay tag): Theseare numbered plastic tags with a 'T' shaped head (Floy Tag and Manufacturing Inc., Seattle, USA). The needle on the purpose-built tagging gun (supplied with the tags) was inserted into the dorsal musculature of each fish by lifting a scale and pushing the needle at a 450 angle. The trigger was then pressed to release the T-shaped head into the muscle, leaving the numbered portion of the tags sticking out from the fish. f Fingerling tags: These are small numberedplastic tags (F1oyTags and Manufacturing Inc., USA) of different colours attachedto a thread. Using a needle,the monofilament thread was passed thrQughthe body above the lateral line on the upper portion of the caudal peduncle or through the muscle at the base of the dorsal fin rays and tied over the top of the fish. The fish were treated with tetracycline (by dipping in a 10 ppm solution for 1-2 min) after the tagging operationto reduce the chance of wound infection. g Carlin disc: These are larger numbered plastic tags of different colours with two threads.The tags were attached to the fish by passing both threads separately through the muscle at the base of adjacent dorsal fin rays using a needle. A knot was tied on the other side of the body to secure the tags. h Visible implants: Alphanumerically coded tags (from Northwest Marine Technology Inc., Seattle, USA) were inserted just below the dorsal fin ray and beneath the thin membrane covering a part of the operculum
using a special flattened syringe (supplied with tags). i Fin clipping: The pectoral or pelvic fin was clipped at the base, while the upper or lower caudal fin lobe was removed using a pair of scissors.
2.1j Passive integrated transpondertags: These glass2.1 b Alcian blue dye marking: SaturatedAlcian blue encased electronic transponder tags (AVID Northwest solution was injected just beneaththe epidermal layer Marine Technology Inc., Seattle, USA) were inserted at the base of one of the paired ventral fins. Any excess into the peritoneal body cavity of catla. This was done dye was wiped off. either by using a scalpel to cut an aperture in the body wall and forceps to insert the tag through the aperture 2.1c Cold branding: A round copper rod having a or using the injecting applicator needle supplied with diameter of 5 mm with a smooth rounded end was held the tags. All tags and dissecting equipmentwere sterilized in liquid nitrogen until the temperatureequilibrated and with ethanol before use. The entry wound for the tag then used to mark the fish on the hard portion of its was dusted with OrahesiveTMpowder containing an antibiotic (Mair 1989). This formed a gel on contact operculum.
587
Tagging and marking for carp with water helping to seal the aperture in the body wall and reducing the risk of infection. Each tag had an individual code which is read by a battery-powered reader held close to the fish. 2.2
Common carp tagging and marking trials
At Hesaraghatta,the medium size group B fish (3570 g) were stocked in 200 m2concreteponds in duplicate while the larger group C fish (> 100g) were stocked in a 200 m2 manured earthen pond. In addition to regular fertilization with manure, stocked fish were fed with a I : I mixture of groundnut oil cake and rice bran at 5% of their body weight/day, with a single morning feed. Fish were sampled once every three weeks to assess their growth rate, health and retention of tags/marks. The quantity of feed to be given was also regulated at the time of sampling. At BRP Farm, the smallestgroup A fish (10-25 g) were stocked in a 400 m2concretepond while the largestgroup D fish (600--800g) were stocked in an 800 m2 earthen pond. Ponds were manured and fed as describedabove. These experiments were conducted between February and July 1995 with the period betweentagging and final assessmentof the retention rates ranging from 129-152 days (tables 2-5). The retention rate for each tag or mark was calculated as: (Number of fish recovered with tag or mark) x 100 (Initial number of fish marked with this technique) The loss rate for each technique using this method for calculating retention includes both fish which have survived but lost the tag or mark, and fish which have died during the trial. An adjusted retention rate estimate which took account of this mortality was calculated for group A as follows (assuming mortality rate to be equal for all tagging and marking methods used in this group, as there was no evidence for differential mortality in
other groups) (Retentionrate) x (Initial total numberoffish in the group) (Final total number of fish in the group) 2.3 Catla growth trial Subsequentto the initial trials on commoncarp, elastomer marking and fin clipping were used to mark catla fingerlings from three different hatcheries for stocking in a communal growth trial. The combinations were: TB Dam (TBD)--elastomer at the base of the pelvic fin and anal fin clipping; BRP--elastomer at the base of left pectoral fin and lower caudal fin clipping: KRPelastomer at the base of right pectoral fin and upper caudal fin clipping. Three replicate ponds of approxi-
mately 150m2 were used with equal densities of each stock in each pond. The fingerlings were marked at mean weights of 9.3 to 9.8 g and grown in the ponds for 24 weeks, when the experiment was terminated due to problems associated with heavy rainfall. Fish were sampledevery three weeks for weighing and measuring, at which times they were identified to hatchery stock origin by the elastomer/fin clipping markings. Fin clippings were repeatedas necessaryat each sampling, while the elastomer marking was reinforced, where required, nine weeks after the start of the trial. 2.4 Tagging of carla broodstock Passive integrated transponder(PIT) tags were used to mark fish from hatcheryand wild sources for future use as broodstock. In June and July 1996, 209 fish from 1994, 1995 and 1996 year classes(mean group weights ranging from 73.13:t 8.27 to 1555.75:t 79.30 g) were tagged and placed into earthenponds. In mid-November 1996, these fish were sampled and the tags checked (167 out of 209)
3. Results A summary of tag/mark retention according to initial size of fish and tagging/marking method is presentedin table 1. The .details of the individual trials are presented in tables 2-5. Some of the techniques tried were found to be unsuitableor ineffective during or shortly after application of the tag or mark. For example,trials with cold branding indicated that marks were not clearly visible. This was also .the case with silver nitrate marking, the marks were very clear immediately after marking but they tended to fade after 24h. Carlin discs were found to be too large for small fish. It was also difficult to locate suitable positions for inserting visible implant tags. They were tried at different places such as below the ventral side of lip, below the jaws and in between dorsal fin rays (in salmonidsand some other fish, these tags are inserted into the clear tissue immediately behind the eye; Anon. 1995). However all tags were lost within 24 h. Hence, these aforementionedmethods were not tried on many fish. Only dye marking, fin clipping, fingerling and floy tags were tried on larger number of fish. Tagging and marking did not result in significant mortality in three of the four group (see tables 2-5). The low survival seenin group A at BRP could probably be attributed to management(for reasons beyond our control the fish were moved from one pond to another once during the experiment) rather than to the effect of tagging or marking itself. From table 2 it can be seen that only Alcian blue marking and caudal fin (upper and lower lobes) clipping
0
588
Y Basavaraju et at
had adequate retention with no major differences in these three methods. All other tags/marks were lost. Retention rates for caudal fin clipping (i.e., those in which it could still be detected despite regeneration) were 40% and 28.9% respectively for the upper and lower lobes in the smallest group of fish (67.5% and 48.7% respectively after adjustment for mortality). Fins regenerated fully and rapidly but in those in which the mark was 'retained', it was possible to detect that they had been clipped due to "kinks" in the caudal lobes and the slight change in
the colour of the regeneratedlobes. As can be seen from table 3, only elastomer dye
Table
marking and Alcian blue gave significant ratesof retention for the larger fingerlings used in group B at Hesaraghatta. Using a subjective scale for rating the intensity of these marks at the end of the trials (no mark + to ++++ score for highly visible marks), the Alcian blue appeared to give more intense marks at the end of the trial. This may be influenced by the greater tendency of Alcian blue to spread out under the skin on initial injection, while the elastomerremains in a more compact mark due to its greater initial viscosity and curing properties. The visibility of the elastomer marks can be greatly enhancedby exposureto UV light, which causesfluore-
Retention (%) of various tagging/marking methods in common carp of varying sizes.
Elastomer Alcian blue
59.0 (100.0)
24.0 (50.0)
72.0 (50.0)
37.9
80.0 (30.0)
(58.0)
[40.5] Cold branding Silver nitrate
0.0 (19.0)
0.0 (1.0)
0.0
0.0
(70.0)
(10.0)
[0.0] Floy
10.0
tag
(20.0)
Fingerling tag
0.0 (10.0) [0.0]
0.0 (20.0)
6.7 (30.0)
Carlin disc
47.4
(19.0)
0.0
Visible implant
{10.0)
Fin clip (upper caudal) Fin clip (lower caudal) Fin clip (pelvic) Fin clip
(pectoral)
40.0 (50.0) [67.5]
28.9 (45.0) [48.7] 0.0 (95.0) [0.0] 0.0 (90.0) [0.0]
3.3 (30.0)
0.0 (8.0)
20. (10. 0) O.0 (10 0) 100.0 (20 0) 96.7 (30.0) 96.7 (30.0)
96.7 (30.0)
Number of fish recovered at the end of the trial with sample size (number of fish tagged/markedper group) indicated in parenthesesand the adjusted retention rate (group A only) in square brackets. Empty cells indicate where certain tagging methods were not tried in some size groups.
Tagging and marking for carp Table 2.
589
Results from comparative trials (over 129 days) of various tagging and marking methods on common carp size group A at BRP Fish Farm.
Control
]0.7
90
Total no. ofks/tags410" mar Total no. of fish
60.3
1920
463.5
45 237 (59.3%)
400
UC, upper caudal fin lobe clipped; LC, lower caudal fin lobe clipped; Pelv., one pelvic fin clipped; Pect., one pectoral fin clipped OJncludesfish which had lost marks or tags . I7fhe figure [in brackets] is retention rate adjusted for survival rate cSomeof the fish were marked or tagged using more than one technique,accounting for the fact that the total number of marks or tags exceedsthe total number of marked/tagg~dfish.
Table 3.
Results from comparative trials (over 151 days) of various tagging and marking methods on common carp size group B.
No. of
No.
Mark/tag
fish
Initial mean wt. (g)
Elastomer
100
44.0
59
99.5
58
37.0
22
95.7
Cold branding
19
67.9
0
Floy tags
20
73.9
2
130.0
10.0
75.9
Fingerling tags Visible implants
30
52.)
2
150.0
30-50"
0
6.7 0.0
187.9
10
Alcain blue
Control Total no. of tags/marks Total no. of fish
0 237
237
recovered
152b
Final
mean
Retention
wt. (g)
(%)
Weight gain (%)
59.037.9
125.0 158.6
0.0
102.6
85 240C
(101.3%) OWeightrange, means not available bIncludes fish which had lost marks/tags "Exceeds initial total. No obvious source for the excess fish was identified.
Y Basavaraju et al
590
scence of the orange dye (UV light was not used for the subjective scoring just described). In the second trial at Hesaraghattaon the larger group C fish (100-200 g), Alcian blue again had a high rate
of retention. In addition Carlin discs gave a retention rate of 47.4% but as mentioned above were considered to be unsuitable for smaller fish, the major target of these experiments.
Table 4. Results from comparative trials (over ISI days) of various tagging and marking methods on common carp size group C.
No. of
Initial mean
No.
Mark/tag
fish
wt. (g)
recovered
Elastomer
50
167.38
36
-
Cold branding
157.35
0
20
123.32
0
19
198.80
9
Visible implants
8
175.00
Control
0
530
Total no. of tags/marks
98
47
Total no. of fish
98
Floy tags Carlin disc
Final mean Retention wt. (g) (%)
174.22
0
72.0 0.0 0.0 47.4 0.0
Weight gain (%) -5.9
-12.3
98 (100.0%)
aAs there were no untagged fish at the beginning of the experiment, this represents the fish which had lost marks or tags.
Table 5.
Results from comparative trials (over 129 days) of various tagging and marking methods on common carp size group D.
Mark/tag
No. of fish
Initial
mean
wt. (g)
No. recovered
Final .mean
wt. (g)
Retention (%)
589.5
55.0
-9.1
673.90
96.7
-8.1
0.0 3.3 20.0 0.0
-
Weight gain (%)
Alcian blue (pectoral fin) Alcian blue (pelvic fin) Silver nitrate
20
650.33
30
733.33
29
10
700.00
0
Floy tag Carlin disc
30
766.66
10
700.00
2
Visible implant
10
750.00
0
Fin (UC)
20
800.00
20
692.50
100.0
-13.4
Fin (LC)
30
633.33
29
613.80
96.7
-3.1
Fin (Pelv.)
30
683.33
29
589.50
96.7
-13.7
Fin (Pect.)
30
750.00
29
673.90
96.7
-10.1
Control
50
300-500
960
Total No. of tags/marks Total No. of fish
220 237b
530.()() 575.()() -
-30.78 -23.33
150 240
(100-0%) UC, Upper caudal fin lobe removed; LC, lower caudal fin lobe removed; Pelv., one pelvic fin removed; Pect., one pectoml fin removed Qlncludessome fish which had lost marks or tags bSome of the fish were marked or tagged using more than one technique,accounting for the fact that the total number of marks or tags exceedsthe total number of marked/taggedfish.
~
--f~ ~ 4. F,. --!:
Tagging and marking for carp
591
In the largest fish (group D at BRP), most marks applied were effective. Regenerated fins were easily detectedgiving high rates of retention(96-100%). Alcian blue was again effective, especially when injected at the base of the pelvic fin (96.7%).
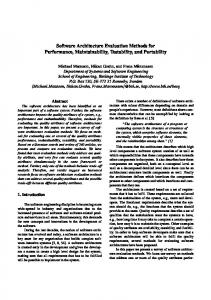
was satisfactory for producing good quality marks in salmon (Herbinger et al 1990), it proved not to be useful for the carp in the present trials. Elastomerdye marking was tried on carp for the first time and the results appear to be satisfactory, with Growth was not affected in small sized groups but slightly higher retention rates than Alcian blue across a marginal reduction in weight was noticed in all larger range of sizes of fish especially when marks are viewed fish in size groups C and D ranging from 120-750 g with the aid of UV light. The cost of marking using (tables 4 and 5). No specific reasonscould be attributed elastomeris, however,considerablyhigher and the elastofor this although the most likely reason is that most of mer is more time consuming to prepare and apply to the fish in this range were mature and in spawning the fish. condition. Fish were taken out from these ponds for Fin clipping, which is a simple technique to employ, routine seed production work and released back after was found to be very useful in larger fish where regeneraspawning. Hence, low weights recorded at the time of ted fins could easily be distinguished from unclipped termination of the experiment might be due to the loss fins. The regeneratedfins developed a faint red colour of weight of gonads which can account for 15-20% of on the regenerated portion, which made clipped fins the total body weight. Loss of condition due to poor distinct from unclipped. However, this method was not food supply and/or poor water quality may also be a useful for fish weighing less than 109 as a single factor. In these groups all fish lost weight, regardless marking technique as the regenerationwas very fast and of tagging methods used indicating that the weight loss the regeneratedfin was difficult to distinguish from the is not a factor related to the principal objective of the unclipped fin. This was observed in all the fins clipped. experiment. Very few fish lost both sets of marks in Alagaraja and Gupta (1976) and Jhingran et al (1981) the catla growth trial (see figure I). In. fact as shown also concluded that regenerationof clipped fins occurred in figure I most fish could be identified to hatchery rapidly but that fin clipping did not appear to affect the stock origin at each sampling period on the basis of growth and survival of the fish. The reduction in weight elastomermark alone,particularly after this was reinforced nine weeks after the start of the trial. However, the fin clipping was useful for identifying the fish which had lost the elastomer marks and it was then much easier
to reapply elastomer marks when necessary.Very good tag retention was seen in the evaluation of PIT tags in a range of sizes of catla high fish. From a total of 167 PIT tagged catla sampled,the tag could be detected with th~ reader in ]65 (98.8%) fish 4-5 months after they
~ ~
were tagged.
-;
~
90
.~
80
~
70
~ = rI)
Discussion It is quite clear that of the techniques tested here on smaller fish « 100 g), elastomer or Alcian blue dye marking and possibly caudal fin clipping appear to be the onJy suitable methods. Khan et al (1988) in their study on dye marking of carp reported that M-Procian blue was a promising marker for the Indian major carp and common carp. While evaluating jet injection of Alcian blue and cold branding as markers for the Atlantic salmon..Herbinger et al (1990) reported that Alcian blue marks were quite cJearly visible even after 6 months of rearing. The fading of marks after relatively longer periods is influenced by the growth rate. Thus under conditions of rapid growth, Herbinger et al (1990) concluded that the jet injection of Alcian blue would be satisfactory up to 1.5 years. With less stringent requirement (10-20% loss acceptable),Alcian blue could remain satisfactory for longer periods. Although cold branding
--
100
~
60
II
A
~
:I
10
20
Weeks after stocking Figure 1. Data from the catla growth trial. Three ponds were each stocked with fingerlings from each of three hatcheries (TB Dam, BRP and KRP). The different hatchery stocks were marked at the start of the trial using combinations of elastomer and fin clipping (see text). The elastomermarks were reinforced nine weeks after the start of the trial (indicated by the arrow head),while fin clips were redone every sampling period where necessary.Samples were taken every four weeks from 8-24 weeks after stocking. (0), Sample size expressed as mean percentageof number of fish originally stocked in pond. (~, Mean percentageof fish whIch could be identified to hatchery on the basis of elastomermarking. (. ), Mean percentage of fish which could not be identified to hatchery stock by either marking method.
592
Y Basavaraju et al
seen in the present study in one group was common to all the fish in that group and there was no evidence to indicate that anyone tagging method was more detrimental to growth than any other for any size group of fish. Roy et al (1991) also reported that clipping of pectoral fins did not affect growth and survival of catla or rohu, while it caused marginal reduction of growth in rnrigal and silver carp. The external tags tested appear not to be useful for cornmon carp under these conditions. All the tags evaluated exhibited high loss rates although they are successfully used in research on other species. Earlier attempts to use external tags on Indian major carp were also not successful, with a very low recovery rate, ranging from 0.8-6% (Saxena et at 1979). A wide range of types of external tags exists and there are various possibilities for location and methods of attachment, but significant improvements on the retention rates observedby Saxena
few years in the possibilities for the use of genetic markers suchas microsatellite DNA loci, as an alternative to physic~l tagging (Castelli et al 1990). Due to the high levels of variation found at such loci, they offer the possibility of identifying individuals from mixed groups to strains and even to family (e.g., full-sibs or half-sibs) by comparison of their DNA with that of parents. This would permit fish to be mixed at the fry stage without any type of physical marking, grown to an appropriate stage and identified to family by typing DNA from severalmicrosatellite loci (Wright and Bentzen 1995). This should offer considerable advantages in improving the validity and resolving power of such growth comparisionsand avoid the necessityof expensive tagging techniques such as PIT tags. We are currently developing microsatellite DNA loci for application in selective breeding programme in catla.
et at (1979) and in this study would be necessary for
most applications. From the catla growth trial, it appears that a combination of dye marking and fin clipping is a suitable method for marking of carp fingerlings with acceptable retention rates, at least in circumstanceswhere the fish can be checked fairly regularly and the marks reinforced if necessary. This will help only in batch marking of fish for communal rearing studies and is limited in terms of the number of different groups which can be marked, especially if the fish are marked and stocked communally when small (e.g., 5-10 g). Coded wire tags (reviewed by Buckley and Blankenship 1990) located in different areas of the body might offer an alternative for this type of batch marking, but the equipment for implanting and detecting is expensive. The study on PIT tags in future catla broodstock demonstrated very high rates of retention with only 2 fish (out of 167 checked) in which the tag could not
be detected. Without killing and dissecting the fish, it is not possible to know whether the tags in these two
fish stopped functioning, were lost from the body of the fish or were still functioning but remained undetected. This last possibility might be expected to occur occasionally, and particularly in large fish, as thesetags have a very limited detection distance. For individual marking only, PIT tags seem to have sufficiently high retentionrates.The primary disadvantage of this technique is the cost (approximately $5 per tag plus the cost of the tag reader). The standard versions of this type of tag are 10-14 mm long; some studies report the use of such tags in fish as small as 3 g with good survival and retention rates (Peterson et at 1994; Mahapatra et at 1996) but as the tag is inserted into the body cavity, experienceand care are required in this procedure.
There have been significant developmentsover the last
Acknowledgements This work was conducted as a part of the project on Genetic Improvementof Carp funded by the Department for International Development,Fish Genetics Programme, University of Wales, Swansea,UK (R 6059). We thank Shri S N Shanmukha,Director of Fisheries for allowing us to use departmental facilities and Shri T Venkateshappa,Deputy Director of Fisheries, Shimoga and Shri Mahadevappa,BR Project Fish Fam1 and his staff for providing facilities.
References Alagaraja K and Gupta M V 1976 A note on fin clipping experiments to estimate fish production in culture operations; J. Inland Fish. Soc. India 8 157-159 Anonymous 1995 Visible implant fluorescent elastomer: Instruction notes (Northwest Marine Technology) Buckley R M and Blankenship H L 1990 Internal extrinsic identification systems-Overview of implanted wire tags otolith marks and parasites; in Fish marking techniques (eds) N C Parker, A E Giorgi, R C Heidinger, D B Jester, E D Prince and G A Winans (American Fisheries Society Symposium) vol. 7, pp 173-182 Castelli M, Philippart J-C, Vassert G and Georges M 1990 DNA fingerprinting in fish: A new generation of genetic markers; in Fish marking techniques (eds) N C Parker, A E Giorgi, R C Heidinger, D B Jester, E D Prince and G A Winan.s (American Fisheries Society Symposium) vol. 7, pp 514-520 Herbinger C M, Newkirk G F and Lanes S T 1990 Individual marking of Atlantic salmon: evaluation of cold branding and injection of Alcian blue in several fin locations; J. Fish Biol. 3699-101 Jhingran A G, Srivastava K P, Dwivedi R K and Gupta R A 198-1 A comparative evaluation of tagging and fin clipping experiments on major carp population of Gulariya reservoir; J. Inland Fish. Soc. India 13 40-49 Khan H A, Gupta S D and Reddy P V G K 1988 Suitable
Tagging and marking for carp dye for marking Asiatic carps; Indian J. Anim. Sci. 58 1003-1006
593
of sequentialcoded wire and passive integrated transponder tags for assessingover winter growth and survival of juvenile coho salmon; N. Am. J. Fish Manage. 14 870-873 Roy A K, Datta A K, Sen P Rand Saha B K 1991 Preliminary studies on the tagging effect of pectoral fin clipping in carps on growth survival and regenerationrate; J. Aqua Tropics 6
Mair G C 1989 A technique for sampling muscle tissue from live fish; J. Fish Bioi. 34 159-160 Mahapatra K D, Sahoo M and Lenka S 1996 The PIT-tag a suitabledevice for marking fish; in Final workshopon selective breeding ofrohu (Labeo rohita) (Bhubaneswar:Central Institute 89-98 of Freshwater Aquaculture) pp 13-16 SaxenaR K, Pahwa D V and Malhotra J C 1979 Observations Nielsen L A 1992 Methods for marking fish and shellfish; Am. on tagging of Indian major carps in the Ganga river system; Fish. Soc. Special Publ. 23 208 J. Inland Fish. Soc. India 11 119-122 Parker N C, Giorgi A E, Heidinger R C, Jester D B, Prince Wright J M and BentzenP 1995 Microsatellites:genetic markers E D and Winans G A (eds) 1990 Fish marking techniques for the future; in Molecular genetics in fisheries (eds) G R (American Fisheries Society Symposium)vol. 7, pp 514-520 Carvalho and T J Pitcher (London: Chapmanand Hall) pp Peterson N P, Prentice E F and Quinn T P 1994 Comparison 117-121
MS received 22 September1997; accepted14 September1998 ColTesponding editor: SAMIR BHATTACHARYA