the field of electroacoustics. His doctoral thesis in 1997 was on the objective grading of percep- tual audio systems. From 1982 to 1986 he had been employed ...
ISSN 0005-1144 ATKAFF 51(3), 284–292(2010) Hrvoje Domitrovi´c, Kristian Jambroši´c, Marko Horvat
Evaluation of Nonlinear Digital Audio Systems Through Transparency Reduction Using the Combined Test Signal UDK 621.391.8:004:534-7 IFAC 5.8.3
Original scientific paper
The well known and established methods used for distortion measurements cannot be used for detecting the errors that appear in digital audio systems based on perceptual coding and decoding. A test stimulus has to be used that has the time-varying properties similar to real signals such as speech and music. Furthermore, the procedure of quality evaluation has to include an estimate of the temporal behaviour of human hearing. For the purpose of evaluation of digital audio systems based on perceptual coding, a new combined test signal was developed with the cumulative distribution of amplitude following the Gaussian distribution. Input and output signals are transformed from the objective domain to the excitation domain. Transparency reduction is defined as a measure of distortion, being the ratio of error excitation and stimulus excitation. Key words: Distortion, Data reduction, Perceptual Model, Digital audio systems Ocjena nelinearnih digitalnih audio sustava pomo´cu smanjenja transparentnosti uporabom složenog ispitnog signala. Ocjena nelinearnih digitalnih audio sustava pomo´cu smanjenja transparentnosti uporabom složenog ispitnog signala. Do sada poznate i primjenjivane metode mjerenja izobliˇcenja pokazale su se neprimjenjive za otkrivanje grešaka u audio sustavima sa smanjenom brzinom prijenosa. Za ispitivanje sustava sa smanjenom brzinom prijenosa potrebno je koristiti signale koji su po svojim karakteristikama što sliˇcniji stvarnim signalima, tj. govoru i glazbi. Istovremeno, pri ocjeni kvalitete potrebno je uzeti u obzir psihoakustiˇcke procese koji se odvijaju u ljudskom uhu. Za potrebe ispitivanja sustava s redukcijom podataka razvijen je složeni ispitni signal cˇ ija kumulativna funkcija razdiobe amplituda slijedi Gaussovu razdiobu. Ulazni i izlazni signal transformiraju se iz objektivne domene razina u domenu subjektivne pobude. Mjera izobliˇcenja je smanjenje transparentnosti sustava i definirano je kao omjer pobude signala greške prema pobudi ulaznog signala. Kljuˇcne rijeˇci: izobliˇcenje, redukcija toka podataka, percepcijski model, digitalni audio sustavi
1 INTRODUCTION An important division of digital audio systems is made taking into account their linearity, so they can be divided into linear and nonlinear, where the latter are often referred to as systems with reduced bit rates. Such a division is based on the relation between the bit depth of the system n, the sampling frequency fs , and the bit rate BR of the digital output signal. For linear digital systems the bit rate is equal to the product of the sampling frequency and bit depth: BR = fs · n (1) while for nonlinear digital systems the bit rate is lower than the value obtained by making such a product: BR < fs · n
(2)
The introduction of digital audio devices into everyday use has evoked the need to develop appropriate measurements 284
to be applied during production, operation and maintenance of such devices. The attempts to use the measurements defined for analog devices [1, 2] have revealed certain faults due to the fact that specifics of digital audio systems have not been considered. The measurement procedures could only cover digital devices as complete units, while the measurements could not be made separately for the digital and the analog part of these devices. Therefore, specific measurements for digital systems have been defined, as well as the test signals and procedures to be used in such measurements [3-5]. Although any kind of signal can be implemented in these measurement procedures, a reference signal is required for comparison purposes. For these reasons, the proposed method of evaluation uses a signal whose statistical characteristics are similar to the ones obtained for speech and music, while maintaining full control of signal parameters. In addition, the reference signal is not needed for evaluation, since it can
AUTOMATIKA 51(2010) 3, 284–292
Evaluation of Nonlinear Digital Audio Systems Through Transparency...
H. Domitrovi´c, K. Jambroši´c, M. Horvat
be reconstructed from the known initial values of signal parameters.
appropriate test signals. Based on results of this analysis, the demands were defined that have to be fulfilled during the measurements of digital audio systems in order to gain credible results and unambiguous quality markers for the system under test. All relevant characteristics of a measured digital audio system can be divided into six groups: the input characteristics, the output characteristics, system response, distortion, S/N ratio and inter-channel interference.
2 MEASUREMENTS ON DIGITAL AUDIO SYSTEMS The specific characteristics of digital devices, the types of errors and the origins of distortions demand that new measurement procedures have to be defined. Furthermore, the test signals have to be chosen in such a way that the measurements yield unambiguous results and reveal all possible anomalies of the measured device. There are three important facts that determine the difference in behaviour between analog and digital systems during the measurements. The first one is the dependency of all frequency components in a digital system on the sampling frequency of the system. As a direct consequence, non-harmonic components can occur in the output signal as a result of intermodulation between the input signal and the components of the sampling frequency. The second fact focuses on avoiding the distortion caused by aliasing, i.e. overlapping of the basic spectrum with components from the lower sideband of the sampled signal. Consequently, all digital systems have a bandwidth limitation, which means that only test signals with frequency components lying below half the sampling frequency can be used. The third fact is related to quantization of the signal amplitude and the quantization noise as the by-product of this process, being the difference between the real value of the signal and the assigned numerical value after quantization. The spectrum of the quantization noise depends on the relative frequency relations between the input signal and the sampling frequency, unlike in the analog systems. The basic types of errors that occur in digital audio systems can be divided in two groups. The first group contains the errors of input/output devices, while the second group consists of errors that occur during signal processing. 2.1 Errors of the Input/Output Devices Errors of the I/O devices are present in all digital systems, regardless of the type of interfaces used for their interconnection (analog or digital). The use of A/D and D/A circuitry increases the probability that errors will occur, as opposed to the case when digital inputs and outputs are used. Nevertheless, working in the digital domain brings specific problems of its own. Although the main goal of this paper is to determine the quality of nonlinear digital audio systems in which the signal processing errors are dominant, it is necessary to understand the origin of errors related to input and output devices in order to get a complete overview of a digital audio system. The analysis of measurements of I/O errors resulted in important ideas related to the choice of
AUTOMATIKA 51(2010) 3, 284–292
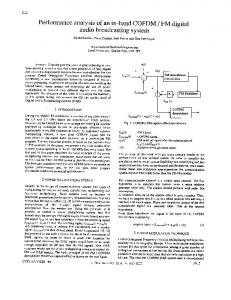
2.2 Signal Processing Errors The development of digital audio systems with reduced bit rate (RBR systems) stressed the need for introducing new procedures for determining the quality in many fields of use, from transmission, recording and broadcasting in the professional part to receiving and recording in the part intended for home devices. Various directions of development and goals of final use, as well as a wide area of different usage require well defined ways of determining the quality in order to make comparisons and optimal choices for each use [6 - 8]. The expression "determination of quality" is used deliberately because distortions in the classical sense cannot be associated with RBR systems due to specific signal processing and algorithms used in such systems. Instead of measuring the distortions, an assessment is made of the overall auditory "impression" of a certain RBR system. In the early stage of development, the RBR systems were evaluated based on groups of specially trained listeners whose task was to determine the noticeability of signal change using a set of auditory tests. This was a time-consuming and expensive procedure not adequate for everyday control and checks of correctness. Moreover, such a procedure depended on a number of different factors (signal type, listening space, test method, level of training, listeners’ musical preferences, etc.). The basic structure of the ISO/MPEG encoder [9] is shown in Fig. 1 as the most widely used RBR system. It consists of: 1. Frequency-time mapping (filter bank) used for breaking down the input audio information into undersampled spectral components. Depending on the filter bank used in this stage, they are called sub-bands or spectral lines. 2. The output of the filter bank or a parallel transformation output used for calculating the instantaneous masking threshold according to the psychoacoustic model. This information determines the next function steps of the quantizing device and the encoder. 3. Quantization and encoding of sub-band samples or spectrum lines with the goal to keep the noise introduced by the quantization below the masking threshold level. 285
Evaluation of Nonlinear Digital Audio Systems Through Transparency...
H. Domitrovi´c, K. Jambroši´c, M. Horvat
4. Forming of blocks that contain information about the quantized signal, information about the data sequence in the block, amplification factor of the block and additional information.
odd and even harmonics. Furthermore, saw signals have a more favourable energy distribution within their spectra. Specifically, the amplitude levels of the harmonics of triangular signals fall off at a higher rate than the amplitude levels of the saw signal harmonics. Taking into account these two findings, the saw signal was chosen as the basic building element for the new test signal.
digital audio samples (PCM)
time / frequency mapping
quantizer and encoding
frame packing
ISO/MPEG encoded bitstream
psychoacoustic model
Fig. 1. Basic structure of an ISO/MPEG encoder 3 THE PROPOSED MEASUREMENT METHOD Conventional measurement methods developed for analog systems mostly use stationary sinusoidal test signals and their combinations. A common characteristic of these signals is that the probability density distributions of their amplitude deviate significantly from the Gaussian distribution which is common for speech and musical signals. Moreover, the spectra of these test signals are time invariant although they can contain various frequency components. For this reason, it was often very difficult to ascertain a meaningful relationship between the values of distortion measured using conventional methods and subjective evaluation grades obtained from listening tests. Furthermore, in real life, audio systems are never used for transfer or recording of signals such as sinusoidal or rectangular. Digital audio systems with reduced bit rate are based on the principles of irrelevance, redundancy and entropy of the signal. It is not possible to give an overall evaluation of quality for a nonlinear digital audio system under test by measuring only the common parameters and distortion. Therefore, the use of transparency is proposed for evaluation of RBR audio systems. This measure evaluates the similarity of the output signal to the input signal of an RBR system, taking into account human hearing. The initial idea in defining the new test signal was to use a simple waveform as the basis for building the final form of the test signal. An easy way of defining and modifying the test signal was achieved in this manner, while maintaining complete control over all parameters of the signal. The examination of simplicity of generating and defining several types of waveforms has shown that triangle and saw signals are the optimal basic waveforms based on which the test signal can be defined. The spectrum analysis performed on these two types of waveforms reveals that the spectrum of triangular signal contains only odd harmonics, while the spectrum of the saw signal contains both 286
As bandwidth limitation is necessary for all digital systems, the rate of change for the back edge of the saw signal has to be limited as well, thereby ensuring that the excitation signal is maintained within the frequency range of the system. For this reason, the saw signal is modified so that it never has a perfectly vertical back edge, but always a sloped one.
y
k=l
k=m k = -m
Tn-1 ∆t
Tn ∆t
Tn+1
t
Fig. 2. Parameters of the new test signal Figure 2 shows the basic parameters used for determining the waveform of the new test signal. The expression used for generating the signal can be defined as: yTn = yTn−1 + k · ∆t
(3)
and represents the defining equation for a straight line. The directional coefficient k determines the slope of the straight line, i.e. the rate of change of signal amplitude. As the signal must exhibit dynamically changeable characteristics, the directional coefficient is changed after every p periods of the signal that have been generated. In order to define the test signal as similar as possible to real signals in which the transient and the stationary parts of the signal have the same statistical probability of occurring, the directional coefficient k does not change in a linear fashion. Instead, the change of the directional coefficient is determined by a pseudorandom sequence of length m. The chosen parameter m defines a subset of natural numbers {1, . . . , m}. The pseudorandom sequence is generated in a way that each number from this subset will be used once, ensuring that there is no repetition inside the sequence. The back edge is defined with a straight line with directional coefficient equal to the highest value from the pseudorandom sequence, but with a negative sign. Although the length of the sequence m does not have a crucial influence on generation of the sequence when using a computer, sequences
AUTOMATIKA 51(2010) 3, 284–292
Evaluation of Nonlinear Digital Audio Systems Through Transparency...
H. Domitrovi´c, K. Jambroši´c, M. Horvat
of length m = 63, 127 and 255 were taken into account due to simplicity of hardware implementation.
Table 1. Example of the CTS modelling for the seed sequence [3,1,2] time interval (i) seed: [3,1,2] 1 2 3 4 k1 3 1 2 3 k2 2 3 1 2 k3 1 2 3 1
The increment of the signal is not determined from the values of the slope of the signal, i.e. the directional coefficients, but as the product of the increment coefficient and the quotient D/m where D is the dynamics of the saw signal. The slope of the back edge determines the maximum excitation frequency in the baseband. This slope is determined from the number of samples the back edge contains, from which the ratio between the highest fundamental frequency and the sampling frequency is determined.
start 1. pseudorandom sequence generator
The slope of the back edge also defines the location of the first minimum in the signal spectrum. Thus, the basic range of excitation is defined for such a signal. The level difference between the spectral components contained in the basic excitation range and the higher order components is in the order of 40 dB, which corresponds to the energy distribution in the spectrum of real signals. Each slope of the front edge of the saw signal is repeated three times, which gives a frequency dependant duration of particular components.
Although the generated signal is highly variable over time, its amplitude distribution is rectangular and does not correspond to distributions of real signals. Therefore, the final implementation of the signal generator is shown in Fig. 3 and uses three synchronised generators, each of them working on the principle described above. The common characteristic for all three generators is that the pseudorandom sequences are mutually connected. The seed sequence is the same for all generators. The first generator yields a whole number coefficientk1i . This coefficient is passed on to the first saw signal generator as the slope of the front edge. At the same time, this value is also used as a pointer to the seed sequence in the second generator. The obtained coefficient k2i is then used in the same way for the second generator of the saw signal and as a pointer to the seed sequence in the third generator. An example of this procedure is shown in table 1. The first coefficient in the first pseudorandom sequence generator (PSG) k11 is equal to the first number in the seed, “3”. At the same time it points to the 3rd position in the seed, number “2”, making it the first coefficient k21 in the second PSG. Again, this coefficient also points to the 2nd position in the seed, number “1”, making it the first coefficient of the third PSG. The same procedure is repeated in each subsequent time interval.
AUTOMATIKA 51(2010) 3, 284–292
saw signal generator
k2i
saw signal generator
k3i
saw signal generator
pointer 1 2. pseudorandom sequence generator
CTS
+
pointer 2 3. pseudorandom sequence generator seed
Fig. 3. Generation of the Combined Test Signal (CTS) The amplitude distribution problem is solved by adding the signals obtained from all three generators. As shown in Fig. 4, the amplitude distribution of the test signal now follows the Gaussian distribution very well [10, 11]. Using a signal whose statistical characteristics are very similar to real audio information solves the first part of the problem. The evaluation of the amount of error must take into account the noticeability of this error by the end user by considering the processes that take place in the human
2.5 amplitude frequency, %
The signal generated as described meets the following initial conditions: it is quite simple for generation, its spectrum can be easily modified and the signal parameters are chosen so that they enable controllable changes of signal characteristics.
k1i
2 1.5 1 0.5 0 -1
-0.5
0 0.5 relative amplitude
1
Fig. 4. Amplitude distribution of the Combined Test Signal in 100 bins
287
Evaluation of Nonlinear Digital Audio Systems Through Transparency...
hearing system. The psychoacoustic effects shown and defined up to date are based on tests carried out with stationary stimulus, mostly sinusoidal signals or narrowband noise. The goal of these measurements is to use a procedure which will be based on already standardized parameters as much as possible, and that some space is left for upgrading based on new findings in the field of psychoacoustics, mostly on those connected with the dynamic behaviour of the human hearing system. The proposed test setup which utilizes the combined test signal is shown in Fig. 5. The first phase in the evaluation of quality is the transformation of the original test signal from the objective domain of level values into the subjective domain of listening experience, i.e. into the stimulus domain. This transformation is done in two stages. The first stage involves the transformation from the linear frequency domain into the domain of the critical bands of the human ear, i.e. the Bark domain. In this stage signal levels are determined in each critical band. The real characteristics of critical bands are substituted with equivalent rectangular filters [12]. The addition procedure is described in ISO and IEC standards [13]. After the transformation in the frequency domain, the values of sound pressure obtained for all critical bands are transformed into levels expressed in decibels, (4). " # X µ pi ¶2 p2r Lpr = 10 log 2 = 10 log , (4) p0 p0 i where the reference sound pressure p0 is 20 µPa, pr is the sound pressure in the corresponding critical band and pi is the sound pressure of the i-th frequency line in that critical band. Then, Lpr is the sound pressure level of the corresponding critical band. The stimulus levels of the input signal Lpr are then corrected by values which characterize the hearing threshold inside each critical band. The new corrected level inside the j-th critical band and i-th time interval is now marked asAij . The sum of all values in the matrix which represents the input signal that has undergone the described transformation and correction is the total stimulus Ep for the original input test signal, (5). This transformation is made in the measuring instrument itself. XX Ep = Aij (5) i
j
The output signal from the system under test is undergoing the same procedure as the input signal, i.e. the transformation from the frequency domain to Bark domain and the correction regarding the average hearing threshold for each critical band. The total stimulus is not calculated for 288
H. Domitrovi´c, K. Jambroši´c, M. Horvat
input test system (MPEG encoder) output
CTS
freq./Bark domain transform.
freq./Bark domain transform. hearing threshold correction
A
E
B
hearing threshold correction
error signal Fig. 5. Block diagram of the test setup which utilizes the Combined Test Signal the output signal. Instead, the transform matrix B of the output signal is subtracted from the transform matrix A obtained for the original input signal. Thereby, the error signal matrix E is obtained for the output signal in relation to the input signal as: E=A−B
(6)
The sum of absolute values of all elements contained in the error matrix E is calculated as the total error stimulusEg according to: XX Eg = |Eij | (7)
where Eij is the error in the i-th time interval and in the j-th critical band. The ratio of the error signal Eg and the total stimulus of the input signal Ep represents the transparency reduction K for the investigated system, (8). K=
Eg Eg or K% = · 100[%] Ep Ep
(8)
The values of transparency reduction defined in this manner lie between 0 and 1. The value 0 corresponds to lossless transfer of information. In the extreme case when there is no output signal, the error stimulus Eg is equal to the stimulus of the input signal Ep . In this case transparency reduction reaches the value of 1 or 100 %. 4 MEASUREMENTS PERFORMED USING THE COMBINED TEST SIGNAL All actual methods of quality evaluation defined for digital audio systems with data reduction implement the calculation of the ideal transformation for the known reference signal on the input and then compare it with the output
AUTOMATIKA 51(2010) 3, 284–292
Evaluation of Nonlinear Digital Audio Systems Through Transparency...
H. Domitrovi´c, K. Jambroši´c, M. Horvat
from the system for which the quality has to be determined. Such a procedure is practical and simple enough for application in laboratory conditions, but it is not possible to use it for field measurements such as quality evaluation of a radio broadcasting system. The method of signal generation shown in Fig. 3 makes it very easy to meet the requirements stated for field measurements. In order to evaluate the transparency reduction, it is enough to know the seed sequence and to determine the delay between the generated signal and the signal obtained on the output of the system. The seed sequence can be prewritten in the read-only memory (ROM) of the measurement system. It can also be transmitted in the header of the digital audio signal, e.g. in the Broadcast Wave Format. The exact time point in the output signal which matches the beginning of the input test signal must be determined by cross-correlating the generated and the received encoded signal, as shown in Fig. 6. The time point of the peak value of the cross-correlation subtracted from the length of the encoded signal represents the actual time delay introduced by the encoder.
Besides the cross-correlation between the input and the output signal, the autocorrelation of both the input and the output signal was also calculated as a tool for detecting the periodicity in each signal. When the combined test signal is used in measurements, the well defined and narrow maxima in the autocorrelation function provide the means for synchronization on the output of the system if there is no possibility to make a direct comparison with the original signal. In order to verify the validity of the proposed measuring method and the combined test signal, software versions of the ISO/IEC MPEG 1 Layer I, II and III encoders and decoders were used, originally intended for checking and demonstrating the possibilities of making reductions in audio signals. The measurements were made using different sets of values chosen for relevant parameters of the combined test signal. Only single channel systems were investigated. The test results are shown for MPEG 1 Layer III as the most widely spread codec for audio today. Codec designates a system consisting of an encoder and a decoder. Transparency reduction was calculated and compared for all three layers of the MPEG 1 standard. Figure 7 shows 3 ms long excerpts of the waveforms of the original CTS and the one encoded with MPEG 1 Layer III. The differences of the two waveforms are clearly visible, suggesting that a certain amount of error is introduced during the encoding process. Further evaluation reveals how much this difference will be noticeable for the end user, i.e. the listener. The waveform of the signal encoded with 128 kbit/s is not shown because the difference to the original signal cannot be observed, suggesting that the quality of the system at this bit rate is high. Figure 8 shows the power spectra of the original CTS and the CTS again encoded with MPEG 1 Layer III encoder at two bitrates, 48 and 128 kbit/s. While the power spectrum of the signal encoded at 128 kbit/s does not differ
N −1 1 X x (n) y (n + m) , N →∞ N n=0
Rxy (m) = lim
(9)
−∞