with special scenarios, such as ramp queue overflow. This ..... Irvine Center Dr. 1 ... control interval, which means we do not need to call net action(void) in each ...
Evaluation of On-ramp Control Algorithms
September 2001
Michael Zhang, Taewan Kim, Xiaojian Nie, Wenlong Jin University of California at Davis Lianyu Chu, Will Recker PATH Center for ATMS Research University of California, Irvine
Institute of Transportation Studies One Shields Avenue University of California, Davis Davis, CA 95616
ACKNOWLEDGEMENTS Technical assistance on Paramics simulation from the Quadstone Technical Support staff is also gratefully acknowledged.
ii
EXECUTIVE SUMMARY This project has three objectives: 1) review existing ramp metering algorithms and choose a few attractive ones for further evaluation, 2) develop a ramp metering evaluation framework using microscopic simulation, and 3) compare the performances of the selected algorithms and make recommendations about future developments and field tests of ramp metering systems. About 17 ramp metering algorithms, ranging from simple local algorithms to complex integrated algorithms, are first categorized and assessed qualitatively. Prior to our review, we developed a classification scheme and a set of evaluation criteria to aid the categorization and qualitative assessment of the selected metering algorithms. Based on the qualitative assessment, ALINEA, Bottleneck, SWARM, and Zone algorithms were selected for further evaluation. Paramics was adopted as the simulation platform for further evaluation of the selected metering algorithms. Several API (Application Programming Interface) modules, including Loop aggregation API (on-line data collection), Ramp API (mimics ramp signal operations), and Ramp Algorithm APIs (metering logic implementations), are developed to build a simulationbased ramp metering evaluation framework. The four selected algorithms were coded into this framework for a stretch of south bound Interstate 405 located in Orange County, California. To compare the performance of these algorithms, multiple simulation runs were made under different demand patterns. Using the total vehicle travel time (TVTT) as the measurement of effectiveness (MOE), our evaluation study finds that: • Ramp metering reduces the total vehicle travel time up to 7% compared with no metering. The effectiveness of a ramp control algorithm depends on the level of traffic demand. As traffic demand increases, ramp metering tends to be more effective in reducing system travel time. • No significant performance differences exist among ALINEA, modified Bottleneck, modified SWARM with 1 time-step-ahead prediction, and Zone algorithms under the tested scenarios. • Modified SWARM with five-step-ahead prediction has the poorest performance among all tested algorithms due to the inaccuracy of the five-step-ahead prediction model. This indicates a good traffic prediction is the key to SWARM’s performance. • Coordinated ramp metering algorithms do not necessarily perform better than local control algorithms if some of their key parameters are not well calibrated. Well tuned parameters are critical for the good ramp metering performance. • Ramp metering performance and parameter values are non-linearly related. There is a broad range of parameter values over which ramp metering performance does not change significantly. Outside of this range, however, ramp metering performance deteriorates quickly. • Ramp metering seems to be more effective under certain demand patterns than others. Besides these key findings, this study also revealed a number of issues to be addressed in designing a ramp metering system. First, a systematic procedure to calibrate complex ramp iii
metering algorithms needs to be developed. Because the relation between system performance and ramp metering parameters is very complicated, conventional optimization tools are usually difficult to apply to this problem. Second, a proactive ramp metering algorithm requires accurate predictions of traffic conditions. Third, we know ramp metering performance is affected by traffic demand patterns. Conversely O-D demand may be also affected by ramp metering. We need to close the loop by studying ramp-metering—traffic-demand-shift interactions. Last but not least, it is argued that, in a corridor setting where traffic diversions are possible, ramp metering may yield greater benefits if it is integrated with queue management, traveler information, and arterial street signal coordination.
iv
Contents 1 Introduction
1
2 Overview of Ramp Metering Algorithms 2.1 What is an Ideal Ramp Control Methodology? . . . . . . . . 2.2 Categories of Existing Ramp Metering Schemes . . . . . . . . 2.3 Conceptual Evaluation of Various Ramp Metering Algorithms 2.3.1 Isolated ramp-metering algorithms . . . . . . . . . . . 2.3.2 Cooperative Ramp Metering Algorithms . . . . . . . . 2.3.3 Competitive Algorithms . . . . . . . . . . . . . . . . . 2.3.4 Integral Ramp Metering Algorithms . . . . . . . . . .
. . . . . . . . . . . . . . . . . . . .
. . . . . . .
. . . . . . .
. . . . . . .
. . . . . . .
. . . . . . .
. . . . . . .
. . . . . . .
. . . . . . .
3 Implementation Frameworks and APIs for the Selected Metering Algorithms 3.1 Introduction to the Evaluation Framework of Selected Metering Algorithms . . . 3.1.1 The Evaluation Framework . . . . . . . . . . . . . . . . . . . . . . . . . . 3.1.2 MySQL . . . . . . . . . . . . . . . . . . . . . . . . . . . . . . . . . . . . . 3.1.3 Storing Detector Data into MySQL Database . . . . . . . . . . . . . . . . 3.1.4 Retrieve Data from MySQL Database . . . . . . . . . . . . . . . . . . . . 3.2 ALINEA Algorithm . . . . . . . . . . . . . . . . . . . . . . . . . . . . . . . . . . 3.2.1 Algorithm Description . . . . . . . . . . . . . . . . . . . . . . . . . . . . . 3.2.2 Detectors Used by ALINEA on I-405 . . . . . . . . . . . . . . . . . . . . . 3.2.3 Implementing ALINEA on I-405 Southbound . . . . . . . . . . . . . . . . 3.2.4 Parameters for Calibration . . . . . . . . . . . . . . . . . . . . . . . . . . 3.3 Bottleneck Algorithm . . . . . . . . . . . . . . . . . . . . . . . . . . . . . . . . . 3.3.1 Algorithm Introduction . . . . . . . . . . . . . . . . . . . . . . . . . . . . 3.3.2 Bottleneck Identification and Weighting Factors . . . . . . . . . . . . . . . 3.3.3 Data Structure and Algorithm Implementation . . . . . . . . . . . . . . . 3.3.4 Override Paramics API . . . . . . . . . . . . . . . . . . . . . . . . . . . . 3.3.5 Parameters for Calibration . . . . . . . . . . . . . . . . . . . . . . . . . . 3.4 Zone Algorithm . . . . . . . . . . . . . . . . . . . . . . . . . . . . . . . . . . . . . 3.4.1 Implementing Zone Algorithm on I-405 Southbound . . . . . . . . . . . . 3.4.2 Defining Zones . . . . . . . . . . . . . . . . . . . . . . . . . . . . . . . . . 3.4.3 Algorithm Implementation . . . . . . . . . . . . . . . . . . . . . . . . . . 3.4.4 Parameters for Calibration . . . . . . . . . . . . . . . . . . . . . . . . . . 3.5 SWARM Algorithm . . . . . . . . . . . . . . . . . . . . . . . . . . . . . . . . . . 3.5.1 Algorithm Description . . . . . . . . . . . . . . . . . . . . . . . . . . . . .
v
4 4 5 8 8 9 10 12 19 19 20 21 23 25 26 26 27 28 32 33 33 33 36 40 41 41 43 45 47 48 48 48
3.5.2 3.5.3 3.5.4 3.5.5 3.5.6
Prediction — ARX model . . . . . . . Zone Definition on I-405 Southbound . Ramp Definition on I-405 Southbound Implementing SWARM in Paramics . Parameters for Calibration . . . . . .
. . . . .
. . . . .
. . . . .
. . . . .
. . . . .
. . . . .
4 Paramics Simulation 4.1 Introduction . . . . . . . . . . . . . . . . . . . . . . . . . 4.2 Paramics Coding . . . . . . . . . . . . . . . . . . . . . . 4.2.1 Network . . . . . . . . . . . . . . . . . . . . . . . 4.2.2 Detectors . . . . . . . . . . . . . . . . . . . . . . 4.2.3 Vehicles . . . . . . . . . . . . . . . . . . . . . . . 4.2.4 Zoning and Traffic Demand . . . . . . . . . . . . 4.3 Modifications to and Calibration of Paramics Simulation 4.3.1 Signposting . . . . . . . . . . . . . . . . . . . . . 4.3.2 Merging Behavior . . . . . . . . . . . . . . . . . 4.3.3 Estimation of Critical Occupancy and Capacity 5 Simulation Results and Analysis 5.1 Simulation Design . . . . . . . . . . . . . . 5.2 MOE . . . . . . . . . . . . . . . . . . . . . . 5.2.1 Computation of MOE . . . . . . . . 5.2.2 Statistical Inferences . . . . . . . . . 5.3 Results and Analysis . . . . . . . . . . . . . 5.3.1 Overview of the Congestion Pattern 5.3.2 Selection of the Parameters . . . . . 5.3.3 Comparison of Control Algorithms . 5.3.4 Sensitivity Analysis . . . . . . . . .
. . . . . . . . .
. . . . . . . . .
. . . . . . . . .
. . . . . . . . .
. . . . . . . . .
. . . . . . . . .
. . . . . . . . .
. . . . .
. . . . . . . . . .
. . . . . . . . .
. . . . .
. . . . . . . . . .
. . . . . . . . .
. . . . .
. . . . . . . . . .
. . . . . . . . .
. . . . .
. . . . . . . . . .
. . . . . . . . .
. . . . .
. . . . . . . . . .
. . . . . . . . .
. . . . .
. . . . . . . . . .
. . . . . . . . .
. . . . .
. . . . . . . . . .
. . . . . . . . .
. . . . .
. . . . . . . . . .
. . . . . . . . .
. . . . .
. . . . . . . . . .
. . . . . . . . .
. . . . .
. . . . . . . . . .
. . . . . . . . .
. . . . .
. . . . . . . . . .
. . . . . . . . .
. . . . .
. . . . . . . . . .
. . . . . . . . .
. . . . .
. . . . . . . . . .
. . . . . . . . .
. . . . .
49 51 53 55 55
. . . . . . . . . .
57 57 59 59 61 64 65 65 66 68 70
. . . . . . . . .
74 74 76 76 77 79 79 85 86 89
6 Conclusions 96 6.1 Findings Regarding the Performance of Ramp Metering . . . . . . . . . . . . . . 96 6.2 Lessons for Ramp Metering Simulation . . . . . . . . . . . . . . . . . . . . . . . . 98 6.3 Remarks on Improvement and Further Directions of Research on Ramp Metering 100 A MySQL Installation
105
B Location Map of Detectors
107
C Bottleneck Algorithm Section Definition
112
vi
List of Figures 2.1
The categories of ramp metering algorithms to be assessed . . . . . . . . . . . . .
3.1 3.2 3.3 3.4 3.5
API framework. . . . . Bottleneck algorithm . A typical bottleneck in A typical zone. . . . . SWARM prediction . .
. . . . .
. . . . .
. . . . .
. . . . .
. . . . .
. . . . .
. . . . .
. . . . .
. . . . .
. . . . .
. . . . .
. . . . .
. . . . .
. . . . .
. . . . .
. . . . .
. . . . .
. . . . .
. . . . .
. . . . .
21 34 36 42 49
4.1 4.2 4.3 4.4 4.5 4.6 4.7 4.8 4.9
Window display of Paramics Modeller . . . . . Configuration of simulation network (I-405) . . Roadway categories . . . . . . . . . . . . . . . . Operation of metering signal . . . . . . . . . . Typical locations of detectors at an interchange Zones and traffic demand . . . . . . . . . . . . Window of the ramp attributes control . . . . Detector locations for the occupancy-flow plots Occupancy-flow plots for I-405 . . . . . . . . .
. . . . . . . . .
. . . . . . . . .
. . . . . . . . .
. . . . . . . . .
. . . . . . . . .
. . . . . . . . .
. . . . . . . . .
. . . . . . . . .
. . . . . . . . .
. . . . . . . . .
. . . . . . . . .
. . . . . . . . .
. . . . . . . . .
. . . . . . . . .
. . . . . . . . .
. . . . . . . . .
. . . . . . . . .
. . . . . . . . .
. . . . . . . . .
58 60 61 62 63 66 70 72 73
5.1 5.2 5.3 5.4 5.5
Arrival time/travel time for O-D 16 → 2 . . . . Arrival time/travel time for O-D 13 → 2 . . . . Arrival time/travel time for O-D 11 → 2 . . . . Arrival time/travel time for O-D 9 → 2 . . . . Zones and traffic demand (demand pattern II)
. . . . .
. . . . .
. . . . .
. . . . .
. . . . .
. . . . .
. . . . .
. . . . .
. . . . .
. . . . .
. . . . .
. . . . .
. . . . .
. . . . .
. . . . .
. . . . .
. . . . .
. . . . .
. . . . .
80 81 82 83 94
. . a . .
. . . . . . . . . . . . . . . . . . freeway section . . . . . . . . . . . . . . . . . .
vii
. . . . .
. . . . .
. . . . .
7
List of Tables 3.1 3.2 3.3 3.4 3.5 3.6 3.7 3.8 3.9 3.10 3.11 3.12 3.13 3.14
Data structure used for loop detector in MySQL database . . Detectors for ALINEA local control on I-405 south bound . . Short summary of the ALINEA program . . . . . . . . . . . ALINEA Parameters . . . . . . . . . . . . . . . . . . . . . . Weighting matrix for Bottleneck control . . . . . . . . . . . . Functions of mainline and ramp detectors . . . . . . . . . . . Adjustable parameters for Bottleneck algorithm . . . . . . . Ramp factor of Zone algorithm in our simulation study . . . Zone definition . . . . . . . . . . . . . . . . . . . . . . . . . . Adjustable parameters for Zone algorithm . . . . . . . . . . . Zone definition for SWARM algorithm . . . . . . . . . . . . . Weighting factors for SWARM . . . . . . . . . . . . . . . . . Weighting factors for SWARM algorithm (continued) . . . . . Parameters for calibration in the modified SWARM algorithm
. . . . . . . . . . . . . .
26 27 32 33 36 37 41 45 46 48 52 54 54 56
4.1 4.2
Fleet of vehicles and their characteristics . . . . . . . . . . . . . . . . . . . . . . . Travel demand matrix . . . . . . . . . . . . . . . . . . . . . . . . . . . . . . . . .
65 67
5.1 5.2 5.3 5.4 5.5 5.6
Demand scenarios for the simulation . . . . . . . . . . . . . . . . . . . . . . . . . Weighting factors of MBTN algorithm . . . . . . . . . . . . . . . . . . . . . . . . TVTTs for different regulator value KR and target occupancy(veh·hr(%)) . . . . TVTTs for 5 control algorithms with 10 different random seeds, (veh·hr) . . . . . t-values and degrees of freedom . . . . . . . . . . . . . . . . . . . . . . . . . . . . TVTTs and t-values for different target occupancy values, ALINEA with demand level 2,(veh·hr) . . . . . . . . . . . . . . . . . . . . . . . . . . . . . . . . . . . . . TVTTs and t-values for different regulator values, ALINEA with demand level 2,(veh·hr) . . . . . . . . . . . . . . . . . . . . . . . . . . . . . . . . . . . . . . . . Travel demand matrix . . . . . . . . . . . . . . . . . . . . . . . . . . . . . . . . . TVTTs for No control and ALINEA, demand pattern II (veh*hr) . . . . . . . . .
75 86 87 90 91
5.7 5.8 5.9
. . . . . . . . . . . . .
. . . . . . . . . . . . . .
. . . . . . . . . . . . . .
. . . . . . . . . . . . . .
. . . . . . . . . . . . . .
. . . . . . . . . . . . . .
. . . . . . . . . . . . . .
. . . . . . . . . . . . . .
. . . . . . . . . . . . . .
. . . . . . . . . . . . . .
92 93 94 95
B.1 Detector name(mainline) . . . . . . . . . . . . . . . . . . . . . . . . . . . . . . . . 110 B.2 Detector names (ramp) . . . . . . . . . . . . . . . . . . . . . . . . . . . . . . . . 111
viii
Chapter 1
Introduction A freeway corridor consists of the freeway and its entrance/exit ramps, the cross streets, and adjacent parallel arterial streets. It is designed to provide a generally high level of service (LOS) to their users and to the communities which they serve. However, many corridors in the country are congested, with the worst congestion problems usually arising during the morning and evening peak periods(Schrank and Lomax, 1999). There are two types of traffic congestion observed: recurrent and nonrecurrent. Recurrent congestion is due to excessive peak demands and nonrecurrent congestion is primarily due to capacity reduction caused by events such as accidents.
The control of a traffic corridor, which consists of two major components—freeway system control and arterial street system control, aims to improve flows on both freeway and arterial streets, and has been demonstrated as an effective means to increase the level of service of a corridor system during peak periods. Ramp metering, or ramp control, has been considered to be a very important component of corridor traffic control. Ramp metering is the application of control devices such as metering signals to limit the number of vehicles entering a freeway. The fundamental philosophy of ramp metering is that the corridor can maintain its optimal operation by regulating the freeway demand to be under its capacity. Maintaining the optimal operation of the corridor would provide congestion avoidance and accordingly travel time savings. Ramp metering is designed to achieve one or more of the following non mutually exclusive goals: • to alleviate or eliminate congestion; • to improve freeway flow, traffic safety and air quality by the regulation of input flow to a freeway; 1
• to reduce total travel time and the number of peak-period accidents; • to regulate the input demand of the freeway system so that a truly operationally balanced corridor system is achieved. Metering on the entrance ramps involves determination of the metering rate. According to its response to real time traffic conditions, metering is divided into two classes: 1. fixed-time/ pre-timed/ time-of-day control, in which, metering rates are fixed according to clock time. It is proven to be effective in eliminating recurrent congestion, provided severe incidents or sudden changes in demand do not occur. The metering rate is usually determined based on historical traffic data; 2. traffic-responsive control, in which, real-time freeway data are used to determine the control policy. According to the values of the real time traffic data, such as flow rate, speed, and occupancy, the metering rate varies over time. There are more schemes based on this type of control. There are three types of ramp metering control systems: 1. isolated or local systems, in which control is applied to an on-ramp independently of any other on-ramps; 2. coordinated systems, control is applied to a group of on-ramps in a coordinated fashion, taking into consideration the traffic conditions in the whole system rather than the local conditions around independent on-ramps; 3. integrated systems, in (Kotsialos 2000) an integrated system is defined as a control system with different types of control measures, such as ramp metering, signal timing, and route guidance via variable message signs (VMS). Integrated systems are the most sophisticated systems developed to date. However, one has yet to see their successulf implementations due to their demanding requirements on system infrastructure. Previous field implementations of some of the ramp metering algorithms developed so far have demonstrated that ramp metering could reduce congestion and travel delay. Yet there is still a need for a systematic study and comparison of those metering algorithms. Our research presents such an effort. In this effort, we 2
• Identify promising ramp metering algorithms: A number of ramp metering algorithms has been developed so far. Among them, we focus on the most popular (in terms of their usage) and theoretically attractive (according to their logic) ones from a recent comprehensive review of existing ramp metering algorithms (Bogenberger and May 1999). According to a set of criteria, we rank the reviewed algorithms and select some algorithms to be evaluated in more detail.
• Evaluate the effectiveness of the selected ramp metering algorithms: selected ramp metering algorithms will be evaluated through the Paramics microscopic traffic simulation program. Paramics provides a powerful tool called API that enables us to model and simulate a complicated traffic environment. Several APIs will be developed to implement ramp metering in Paramics. The performance of those selected ramp metering algorithms will be quantified with a set of MOEs (measure of effectiveness) that include journey travel time.
• Suggest improvements: Some suggestions regarding ramp metering algorithm development, parameter calibration, as well as the simulation program will be presented. Discussions on future research will be also presented. This report is organized into six chapters. The second chapter reviews some representative ramp metering algorithms found in literature. A classification scheme and a set of evaluation criteria will be also developed to qualitatively assess those reviewed algorithms. The third chapter implements the selected ramp metering algorithms in Paramics using Paramics’ API functions. The fourth chapter discusses the preliminaries of the simulation. The construction of the simulation network, traffic demand, calibration and tuning of the Paramics will be discussed. The evaluation of ramp metering algorithms based on the simulation results will be discussed in the fifth chapter. Finally, the sixth chapter provides conclusions and recommendations for future research.
3
Chapter 2
Overview of Ramp Metering Algorithms 2.1
What is an Ideal Ramp Control Methodology?
Given a clear set of control objectives and technologies, an ideal control methodology should possess the following properties: • (C1) A good system model describing freeway operations and control – The model should be able to describe both the operations and control in the freeway system accurately. It should capture major traffic flow phenomena that are critical to control design, such as criticality, shock waves, and drivers’ response to controls. • (C2) Sound theoretical foundation – i.e., reasonable assumptions and objectives, rigorous problem formulation, efficient and accurate solution methods. • (C3) Proactive and balanced – prevent congestion rather to react to congestion, and avoid happening of spillback of queues or over-congestion concentrated in one particular part of the system. • (C4) Accuracy and robustness – The control actions should be effective to achieve the control objective, and degrades gracefully when part of the system, such as input links, is down. • (C5) Computational efficiency – Algorithms are easy to program, run fast, and require moderate amount of memory.
4
• (C6) Flexibility and expandability – The algorithm should be easy to implement, modify and expand to account for more complex and perhaps more realistic situations encountered in the freeway system. • (C7) Ability to handle special situations, such as giving priority to high occupancy vehicles (HOV), control under bad weather, or incident conditions. • (C8) Simplicity- Use the simplest logic structure possible to reconcile demands on realism and theoretical elegance.
2.2
Categories of Existing Ramp Metering Schemes
Some of on-ramp control methodologies have been evaluated and implemented in the field, while others are still awaiting further assessment. The well-documented implemented metering algorithms include the Zone ramp metering algorithm (Stephanedes, 1994), the Helper ramp metering algorithm (Lipp et al., 1991), the Bottleneck ramp metering algorithm (Jacobsen et al., 1989), the Sperry ramp metering algorithm (Report 1), the Compass ramp metering algorithm (Report 2), the Fuzzy logic ramp metering algorithm (Meldrum and Taylor, 1995), the Linear programming ramp metering algorithms (Yoshino et al., 1995), the Linked-ramp ramp metering algorithm (Banks, 1993), the METALINE ramp metering algorithm (Papageorgiou et al., 1990), and the ALINEA ramp metering algorithm (Papageorgiou et al., 1997). Those proposed ramp metering algorithms awaiting further assessment include the Ball Aerospace / FHWA ramp metering algorithm (Report 4, 1998; Report 5, 1998), the SWARM ramp metering algorithm (Paesani et al., 1997; Report 3, 1996), and the coordinated artificial neural networks based ramp metering algorithm (Wei and Wu, 1996), and some of them will probably see their day in the field soon.
As we know, a freeway corridor has a hierarchical structure, formed by a mainline backbone, the freeway, and its branches, on-ramps and off-ramps, and traffic dynamics of an on-ramp generally affect traffic performance of the part of the mainline freeway downstream to the on-ramp, instead the part upstream to it, unless the on-ramp itself becomes a source of congestion. The hierarchical structure of a corridor and the influence of the on-ramps to the mainline freeway determine the designing philosophy underlying the ramp metering algorithms, and we find the
5
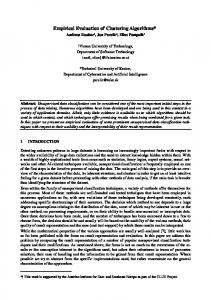
ramp metering algorithms can be categorized into four types: isolated ramp-metering, in which the metering rates are decided solely by local traffic conditions; cooperative ramp-metering, in which the metering rates are first computed with the local traffic information, then adjusted according to the conditions of the entire system; competitive ramp-metering, in which two metering rates are computed for each ramp, one is based on local traffic conditions, and the other is based on system conditions, and the restrictive one is chosen; integral ramp-metering, in which local traffic conditions and system-wide traffic conditions are both used to determine metering rates. The last three types of algorithms are generally called coordinated ramp metering algorithms. A classification tree for algorithms to be reviewed is shown in Figure 2.1, and we shall assess them based one the set of criteria developed in the previous section, starting with the simplest and ending with the most sophisticated metering algorithms.
6
R A M P M E T E R I N G A L G O R I T H M S
Zone algorithm ALINEA Local metering using neural networks
Isolated
Cooperative
Helper ramp algorithm Linked-ramp algorithm
Competitive
Compass algorithm Bottleneck algorithm SWARM
Coordinated
Sperry ramp metering algorithm Fuzzy logic algorithm Linear programming algorithm METALINE Ball Aerospace/ FHWA algorithm Advanced Real-time Metering System Coordinated metering using ANN Dynamic metering control algorithm Metering model for non-recurrent congestion
Integral
Figure 2.1: The categories of ramp metering algorithms to be assessed
7
2.3 2.3.1
Conceptual Evaluation of Various Ramp Metering Algorithms Isolated ramp-metering algorithms
In isolated ramp-metering algorithms, a ramp metering rate for an on-ramp is determined based on its local traffic conditions, such as flow, occupancy, travel speed, and occasionally queue over-flow on the metered ramp. Algorithms in these category to be reviewed include the Zone algorithm (Stephanedes, 1994), ALINEA ((Papageorgiou et al., 1997), and the Neural control algorithm (Zhang et al., 1996; Zhang and Ritchie, 1997).
Among the three local algorithms, ALINEA and the Neural control algorithm both use feedback regulation to maintain a desired level of occupancy, or the target occupancy, which is usually chosen to be the critical occupancy, and apply the kinematic wave theory with locally calibrated fundamental diagrams as the underlying traffic model. For moderate congestion, both algorithms are effective, robust, and flexible. They are also easy to implement because the only parameters are the control gain and target occupancy. However, both algorithms do not consider queue spill-back directly, which is generally handled through overriding restrictive metering rates, and would have difficulty to balance freeway congestion and ramp queues when traffic becomes heavily congested. Moreover, the Neural control algorithm is limited in adaptive control if on-line tuning is not implemented.
Overall we would rank both ALINEA and the Neural control algorithm as good.
In the Zone algorithm, the mainline freeway is divided into several zones, and each entry ramp is affiliated with a zone. Based on traffic conservation, the metering rate for each on-ramp is computed to balance the volume of traffic entering and leaving each zone, so that traffic in each zone is moving at a desired pace. Further adjustment to the metering rate can be made based on environmental factors and other considerations. The key elements of this algorithm are the proper division of zones, the accurate estimation of bottleneck capacity, the accurate measurement of all in and out flows from a zone.
The Zone algorithm has been employed by Minnesota DOT for many years and consider8
able experience has been gained with this particular algorithm, and is flexible due to possible adjustments for different situations. However, parameters for the algorithm have to be tuned carefully to suit local traffic and freeway characteristics, which may not be as easy as it appears because the relation between the control parameters and the control objective is not clear in the Zone algorithm. Another significant drawback of the algorithm is that it does not consider the dynamic nature of traffic flow, and for this reason may not perform well under incident conditions when fast changes of traffic flow occur.
Overall, we would rank this algorithm as good.
The ALINEA and Zone algorithms would be evaluated using PARAMICS. Although none of them consider system-wide information, they may serve as building blocks of coordinated metering schemes.
2.3.2
Cooperative Ramp Metering Algorithms
In cooperative ramp metering algorithms, after computing the metering rate for each on-ramp, further adjustment is done based on system-wide information to avoid both congestion at the bottleneck and spillback at critical ramps. This scheme is an improvement over isolated ramp metering strategies. These algorithms, however, are still reactive to critical conditions and perform the adjustment in an ad hoc manner, and therefore traffic instability may arise when such control strategies are implemented. Helper ramp algorithm Helper ramp algorithm (Lipp et al., 1991) was first implemented in Denver area along the I-25 freeway in March 1981, and additional ramp meters were installed along several freeways in the Denver area in 1984. In this algorithm, a freeway corridor is divided into six groups consisting of one to seven ramps per group. In the local traffic responsive metering component of the Helper algorithm, each meter selects one of six available metering rates based on localized upstream mainline occupancy. In coordination part, if a ramp grows a long queue and is classified as critical, its metering burden will be sequentially distributed to its upstream ramps.
The two-level structure of the Helper algorithm makes it more capable and flexible when 9
dealing with heavy congestion. This algorithm can be and actually was modified to consider special situations such as bus bypasses and HOV lanes. Because the algorithm does not have a systematic way of designing the metering look-up table in the local level and determining the assignment rates in the coordination level, experience with local traffic patterns and trial-anderror is a must in fully utilizing the potential of this algorithm. Nevertheless, Helper algorithm appears to be a quite robust strategy when accurate traffic flow models and origin-destination information are not available to the controller.
We would rank this algorithm as very good. Linked-ramp algorithm Linked-ramp algorithm (Banks, 1993) was used in the San Diego area since 1968. Before 1994, this system was partially coordinated, but now is separated into a number of local traffic responsive controllers. This algorithm is based on the demand-capacity concept, and the local metering rate is determined based on upstream flow measurement at each location: metering rate = target flow rate -upstream flow rate The coordination component of this algorithm is functionally similar to that of the Helper algorithm; i.e., whenever a ramp’s metering rate is in one of its lowest three metering rates, then the upstream ramp is required to meter in the same rate or less, and, if necessary, the further upstream ramps are also required to do so.
This algorithm shares largely the same advantages and disadvantages of the helper algorithm, hence its ranking also. Its local control logic, however, is rather inadequate for congested traffic because the more congested the traffic is, the lower the upstream flow rate, and the higher metering rate this logic produces, which is just the opposite of what one would do.
2.3.3
Competitive Algorithms
In the competitive algorithms, two sets of metering rates are computed based on both local and global traffic conditions, and the more restrictive one will be selected as the actually implemented rates. Further adjustment to the selected metering rates may also be made to account for spillback and other constraints. 10
Compass algorithm Compass algorithm (Report 2) was first implemented in the Toronto area, Canada in 1975. Locally, the Compass algorithm determines the metering rates from an ad-hoc look-up table, which has seventeen levels for each ramp, determined by the local mainline occupancy, the downstream mainline occupancy, the upstream mainline volume as well as some pre-defined parameters that include thresholds for local and downstream occupancies, and upstream volume. Globally, coordinated control use off-line optimization to generate metering rates based on system-wide information. The most restrictive of the two rates is selected.
The Compass algorithm addresses spillback through overriding restrictive rates: if the occupancy at a ramp queue detector exceeds its threshold value, the metering rate is increased by one rate level until the detected occupancy is back below the threshold level. The Compass algorithm is flexible, considers many types of constraints, and is straightforward to implement. However, it is not robust because of the use of look-up tables and predetermined metering rates.
Overall we would rank this algorithm as good. Bottleneck algorithm The Seattle Bottleneck algorithm (Jacobsen et al., 1989) was developed by the Washington Department of Transportation (WSDOT), and has been used to control a portion of I-5, north of the Seattle Central Business District. This algorithm also has a two-level structure. At the local level, a control strategy compares the upstream demand with the down stream supply (that is, the real-time capacity), then takes the difference of them as the locally determined metering rate. At the global level, a coordinate control strategy first identifies bottlenecks, decides the volume reduction for the bottleneck based on flow conservation, and then distributes the volume reduction to upstream ramps according to predetermined weights. The more restrictive of the locally and globally determined rates is selected to be realized.
The Seattle Bottleneck algorithm is conceptually one of the best heuristic ramp metering algorithms implemented in the field. It is real-time, coordinated, yet logically simple (based on supply-demand and flow conservation) and flexible (only a few adjustable parameters). Field
11
operations with this control also show remarkable improvement in traffic conditions. Nevertheless, the Seattle algorithm can be improved by adopting a more robust local control strategy such as ALINEA, and real-time adjustment of volume reduction weights based on current O-D information. Further consideration of ramp queue spill over is also needed.
The overall ranking of this algorithm is very good. System wide adaptive ramp metering (SWARM) SWARM (Paesani et al., 1997; Report 3, 1996) is developed by NET and is expected to be tested in Orange County, California. Like other heuristic coordinated control algorithms, SWARM also operates at two levels: the local control decides ramp metering rates based on local density; the global control decides the overall volume reduction from ramps upstream a critical bottleneck, and then distributes them to upstream ramps according to a set of predetermined fractions to obtain a new set of ramp metering rates; the most restrictive of the two is selected for each ramp. SWARM has a built-in failure management module to clean faulty input data from detectors. It also allows further adjustment to accommodate queue spill-back handling. Both features enhance its robustness.
Unlike previous two-level algorithms, SWARM identifies bottlenecks based on predicted traffic conditions rather than measured traffic conditions. Therefore it has the potential to nail congestion in the bud, so to speak. On the other hand, it could also produce worse results than other non-anticipating algorithms (such as the Seattle Bottleneck Algorithm) if its predictions are poor. Good prediction models and accurate O-D information are two key elements in the successful implementation of SWARM.
Overall we would rank this algorithm as very good.
2.3.4
Integral Ramp Metering Algorithms
Integral ramp metering algorithms have a clear control objective(s) that is explicitly or implicitly linked to the control action. The objective is usually travel time, or throughput of the entire system. They decide ramp metering rates through optimizing the objective while considering system constraints, such as maximum allowable ramp queue, bottleneck capacity, and so forth. 12
As in other algorithms, further adjustments to the computed metering rates can be done to deal with special scenarios, such as ramp queue overflow. This, however, is mostly done in an ad hoc manner.
Conceptually this class of algorithms is most appealing because of their solid theoretical foundation and their capability of handling various types of metering and modeling constraints. However, these algorithms are also invariably more complex in logic and more demanding in computation. Their performance is heavily dependent on the quality of input data (such as O-D tables, estimated bottleneck capacity, and predicted demands), and the traffic models used. Sperry ramp metering algorithm The Sperry algorithm (Report 1) was developed by Virginia Department of Transportation. It was used to control 26 ramp meters along I-395 in northern Virginia. We have found only a sketchy description of this algorithm and therefore were not able to assess the Sperry algorithm in detail. Fuzzy logic algorithm Fuzzy logic based ramp control (Meldrum and Taylor, 1995) has been implemented in Seattle and the Netherlands. Fuzzy logic algorithms convert empirical knowledge about traffic flow and ramp control into the so-called fuzzy rules. Traffic conditions, such as occupancy, flow rate, speed, and ramp queue are divided into finite categories, such as small, medium, and big, and then rules are developed to relate traffic conditions with metering levels. For example, a rule can be: if the local occupancy is small, and ramp queue is small, then metering rate is high. Finally the categorical values of small, big, etc. are converted into crisp numbers according to membership functions.
In a way a Fuzzy logic algorithm is like an expert system. It is very powerful and robust if the right type of rules are used. Often only a few rules are needed for local control strategies. For system-wide control, the rule base can be quite complex. Developing a consistent set of rules that embodies the objective of control is not always straightforward. Moreover, it often takes great amount of effort to calibrate the parameters (tuning the rules and membership functions), which may work well under the set of conditions that the parameters are calibrated but perform 13
poorly when traffic conditions have changed.
Weighing its theoretical attractiveness and practical complexity, we would rank this algorithm as good. Linear programming algorithm Linear programming based ramp control algorithms (Yoshino et al., 1995) are among the oldest in both research and practice. It was widely used in developing time-of-day ramp metering rates before automatic control based dynamic algorithms were introduced. The particular Linear programming algorithm that we evaluate here, which was developed and implemented in Japan, has a few unique features. First, it maximizes the weighted sum of ramp flows where the weights are selected by the user to reflect his belief in the varying importance of the ramps. Secondly, it computes a real-time capacity for each road segment. This allows the algorithm to work under congested road conditions. Constraints on ramp queue length and metering bounds are easily incorporated in and is integral to the linear programming formulation of ramp metering.
Although mathematically more complex than most of the other algorithms that we have discussed thus far, the Linear programming ramp metering algorithm can be solved very efficiently using canned linear programming solvers. The drawbacks of this algorithm are 1) its performance is heavily dependent on accurate O-D data, and 2) it is static, i.e., it neglects the variation of travel time in its computation of ramp metering rates.
Overall we would rank this algorithm as good. METALINE algorithm METALINE (Papageorgiou et al., 1990) is an extension of the local control algorithm ALINEA. It was implemented on certain freeways in France, the United States and the Netherlands.
The control logic of METALINE is Proportional-Integral state feedback. The metering rate of each ramp is computed based on the change in measured occupancy of each freeway segment under METALINE control, and the deviation of occupancy from critical occupancy for each
14
segment that has a controlled on-ramp: ~ ~ c) ~r(k) = ~r(k − 1) − K1 (~o(k) − ~o(k − 1)) − K2 (O(k) −O where, ~r(k) ∈ Rm is the vector of metering rates for the m controlled ramps at time step k; ~o(k) ∈ Rn is the vector of n measured occupancies within the directional freeway segment at ~ O ~ c ∈ Rn are respectively the measured and desired occupancy downstream of time step k; O, m controlled ramps. K1 , K2 are two gain matrices. Like the ALINEA algorithm, the METALINE algorithm is theoretically sound, robust, and easy to implement. The main challenge to the success operation of METALINE is the proper choice of the control matrices K1 , K2 and ~ c . There is no direct consideration of queue overflow, HOV/bus the target occupancy vector O priority, and bottleneck effects in METALINE. One can, however, adjust in an ad hoc manner the METALINE metering rates to partially address these constraints.
Overall we would rank this algorithm as very good. Ball AEROSPACE / FHWA ALGORITHM Funded by the Federal Highway Administration, Ball AEROSPACE is developing a corridor control system in which system-wide ramp metering is one component (Report 4, 1998; Report 5, 1998). At the moment of this review, the algorithm is still under development and no algorithmic detail but a few sketches of conceptual flow charts are available. Judging from these charts, it appears that Ball AEROSPACE attempts to develop a fairly comprehensive ramp metering system whose logical structure is quite complex.
Coordinated Metering using Artificial Neural Networks The coordinated artificial neural networks based ramp metering algorithm (Wei and Wu, 1996) uses artificial neural networks to learn and memorize the metering plans generated by a traffic simulation model (FREEQ10PC) and a ramp control expert system. As such, the full capability, such as adaptive learning, of artificial neural networks is not fully exploited by this algorithm. Basically it does whatever the ramp control expert system does. There are better coordinated neural control algorithms, one of which was developed with the support of Caltrans (Zhang 1995). These algorithms are typically adaptive algorithms in the sense that the neural network 15
controllers adjust their control gain in real-time.
We would rank this version of a neural network ramp metering algorithm as fair. Advanced Real-time Metering System (ARMS) ARMS (Liu et al., 1993), developed by researchers from Texas Transportation Institute, works on two levels. In the first level, a system-wide control policy is to maintain free flow conditions. The total metering volume is obtained by maximizing an objective function that includes throughput, and innovatively the risk of congestion, then distributed to each ramps using O-D information. A prediction and pattern recognition algorithm is also developed to predict in real time the potential occurrence of recurrent congestion. In the second level, the algorithm works to resolve congestion once it develops. It does this by minimizing the congestion clearance time and queues on the controlled ramps. Again the total metering volume obtained from the second level is distributed to each ramp based on O-D information. The novelty of this algorithm is that it incorporates a congestion risk factor into its formulation. It also projects traffic conditions to decide potential bottlenecks, which makes the algorithm proactive.
Although this algorithm is relatively more complex, the aforementioned attractive features of the algorithm makes it standing out as a very good algorithm. Metering model for non-recurrent congestion Metering model for non-recurrent congestion (Chang et al., 1994) has nearly all the elements of a good ramp control algorithm: the whole process is set up as an optimal control problem, it has a dynamic traffic flow model (the kinematic wave traffic model) to describe the traffic flow process, explicitly links control with a clear set of objectives (i.e., maximizing throughput), takes into account system-wide physical and environmental constraints (e.g., maximum ramp queue) and projected traffic conditions (e.g., capacity reduction, future demand), and uses a rigorous yet straightforward solution procedure (successive linear programming) to obtain realtime metering rates. The performance of this algorithm, as indicated from the simulation results reported in (Chang et al., 1994), is quite good.
Nevertheless, one can do a few things to improve this algorithm. First, its numerical ap16
proximation of the kinematic wave model is not the most accurate. By using a more accurate approximation procedure (i.e., the Godunov scheme), one can both improve the accuracy of the flow predictions and eliminate the complicated Kalman filtering process, thus significantly speeds up the computation of ramp metering rates. Second, this algorithm takes the capacity reduction (caused by incidents) factor as given and fixed. In reality, this factor is not known in real-time and may also change over time. One can, however, devise ways to estimate how much capacity reduction takes place in real-time. Third, the algorithm does not explicitly consider O-D flow. Rather, it uses exit fractions to capture time-varying O-D demands. This limits its ability to handle traffic diversions in an optimal way. Actually diversions in this algorithm are part of the inputs, not something to be optimized by the algorithm. This can be changed if a multi-commodity traffic flow model is used.
Overall, the algorithm is theoretically appealing and can be ranked as very good. Dynamic metering control algorithm The Dynamic ramp metering model developed by Chen, Hotz and Ben-Akiva (1997) has four elements: local control, area-wide control, state estimation and O-D prediction. Local control attempts to maintain traffic conditions close to the target traffic conditions that are provided by area-wide control. The area-wide control in the dynamic ramp metering model is a predictive (rolling horizon) optimal control algorithm. It obtains metering rates through minimizing the total system travel time that includes travel time on freeway and delay on ramps, subject to demand and queue capacity constraints. To know future travel demand and traffic conditions, a state estimation model and a O-D prediction model are also developed. In the end, the two controls are combined in the following way: rt = r¯k − K(ot − o¯k ) where rt and ot are respectively the local ramp metering rate and occupancy at time t, while r¯k and o¯k are respectively the ramp metering rate and occupancy set by the area-wide control algorithm.
Overall this is perhaps the most complex and comprehensive ramp metering algorithm that we have reviewed in this report. It contains essentially all the elements that an ideal ramp 17
metering algorithm has. It is system-wide, adaptive and predictive. Initial simulation by Chen, Hotz and Ben-Akiva (1997) indicates that the combined local/area-wide control model is more effective than each control model operating alone. It is yet to be seen, however, how smooth this control model will operate in the real world because its effectiveness depends heavily on the accuracy of the state estimation and O-D prediction models.
We would rate this algorithm as very good.
We decide to further evaluate ALINEA, Minnesota’s Zone algorithm, Seattle’s Bottleneck algorithm and NET’s SWARM algorithm using Paramics simulation. The primary reasons of choosing these four algorithms are 1) they are sound algorithms, 2) they can be easily implemented in the field, and 4) some of them have been successfully field-tested but their performances have not been compared.
18
Chapter 3
Implementation Frameworks and APIs for the Selected Metering Algorithms 3.1
Introduction to the Evaluation Framework of Selected Metering Algorithms
The evaluation of selected control algorithms is based on a traffic simulation software — Paramics. Developed by Quadstone of UK, Paramics is a suite of performance software tools that can model the movement and behaviour of individual vehicles on urban and highway road networks. For the purpose of traffic control, Paramics provides an application programming interface (API) that allows advanced users to implement certain logic imposed by a particular control algorithm.
The evaluation of a ramp control algorithm requires the following three categories of API functions: • Ramp API function, responsible for interacting with ramp meters; • Loop aggregation API function, responsible for collecting on-line traffic data; • MOE(measurement of effectiveness) API function, responsible for measuring and evaluating the system performance. The ramp API has two important interface functions : pp_get_ramp_parameters(ramp i); pp_set_ramp_parameters(ramp j);
19
The first function is responsible for collecting ramp’s current metering rates that might be useful for feedback control algorithms such as ALINEA. The latter, once the metering rates are determined according to the control logic, is responsible for implementing actual control during the next simulation step. Ramp API functions are included in “actuated ramp.dll”. When using the ramp API, we need to put this file in a place that can be accessed by Paramics.
Loop aggregator API outputs aggregated loop data and place them into a database. These data are indicators of the current system status, and serve as the decision basis of the metering policy for the next metering interval. However, for the implementation of a metering algorithm, we do not need to call Loop aggregator API explicitly. Loop aggregator API is implemented in “loop agg.dll”. Also, this file needs to be accessible to Paramics.
MOE API can output the mainline travel time, mainline traffic flow, ramp delay/queue length to a text file or database. This API is still under refinement by the UCI team.
For our simulation studies, we use the ramp API and loop aggregator APIs developed by UCI. We calculate the system performance using the standard APIs embedded in Paramics V3.
3.1.1
The Evaluation Framework
The framework of the simulation platform for evaluating ramp metering algorithms is shown in Figure 3.1. The core of the evaluation system is the Paramics simulator that interacts with external modules through API function calls. The interactions between different modules will be explained later in our description of the implementation of selected control algorithms. Now we briefly describe the module that is responsible for traffic data storage management within the framework.
The storage management module is a MySQL database. During each simulation time step, the loop detectors collect the system’s current status (traffic occupancy, density, speed etc.), and store them into the database. Whenever the metering decision is to be made, these data will be retrieved from the database and used by the traffic control logic module.
20
Ramp API
Loop Aggregate. API
MOE API
MySQL Database Paramics Simulation
ALINEA API
Bottleneck API
SWARM API
Figure 3.1: API framework.
3.1.2
MySQL
For this project, knowledge of two aspects about MySQL is necessary. The first is how to install MySQL successfully in a computer. The second, which is more important of the two, is how to store and retrieve the data in and from the database by using APIs.
MySQL Installation MySQL is a relational database management system (RDBMS) that operates under a clientserver architecture. At present, one may find MySQL not as robust as more powerful RDBMS applications currently on the market. This is because MySQL does not provide all the data management features, such as transactions, subqueries (nested queries), and stored procedures. However, MySQL is sufficient for our application because our application requires only simple insertion and data query. In addition, MySQL is a free database that can work on multiple platforms such as Unix workstations, PCs, and Macs .
The installation of MySQL can be as easy as a few lines of commands if we are working with Win2000 and NT 4.0. For other system such as Unix/Linux, it may turn out to be quite complicated. Since we are using Win2000 as the platform for the development of ramp control algorithms though Paramics API, we would like to share our experience of installing MySQL on Win2000. The procedure itself is given as Appendix A at the end of this document. For Unix/Linux platform, one may need to resort to their system administrator for installation guid21
ance.
More information about MySQL installation can be found in Chapter 4 of the MySQL manual. The on-line version is accessible via http://mysql.he.net/documentation/ . The manual also contains other useful topics about running MySQL under various circumstances. One is encouraged to read it if she/he wants to have a better understanding of MySQL. A good introduction about user interactive operation with MySQL can be found at http://195.19.198.3/mysql/intro/page1.html.
MySQL API MySQL API is an interface that allows us to operate the database via codes in our ramp control algorithms. The interface is implemented in both C and Java. For this project, we only need to know its C version since the Paramics APIs are also written in C.
The API interface is distributed with MySQL. It is included in the MySQL client library and allows the user to access it in the format of API function calls. Although mastering all the API functions is not necessary for implementing control algorithms, it is helpful to have a rough idea about what they are. For this project, we are only concerned with those functions that are responsible for data queries.
There are two steps to execute a query. The first is to compose the query command according to certain criteria. When the query is executed and the result is returned, the second step picks up the right item and assign its value to some variables that hold the data. The following piece of code shows how to execute a typical query. #include #include #include "mysql.h"
MYSQL mysql; MYSQL_RES *res; MYSQL_ROW row;
void exiterr(int exitcode) { fprintf( stderr, "%s\n", mysql_error(&mysql) ); exit( exitcode );
22
}
int main() { uint i = 0; if (!(mysql_connect(&mysql,"host","username","password"))) exiterr(1); if (mysql_select_db(&mysql,"payroll")) exiterr(2); if (mysql_query(&mysql,"SELECT name,rate FROM emp_master")) exiterr(3); if (!(res = mysql_store_result(&mysql))) exiterr(4); while((row = mysql_fetch_row(res))) { for (i=0 ; i < mysql_num_fields(res); i++) printf("%s\n",row[i]); } mysql_free_result(res); mysql_close(&mysql); } The call mysql query will send the query to the server. If the query succeeds, the mysql store result call will allocate memory for MYSQL RES structure and retrieve the results from the server. Once we have a MYSQL RES result, we may view the data with mysql fetch row. This will give us a MYSQL ROW pointer to one row of data. The MYSQL ROW pointer is simply an array of character strings. All data types are converted to character strings for the client.
3.1.3
Storing Detector Data into MySQL Database
We now discuss how the detector data are stored into a MySQL database. Two important files are involved in data storage. The first one is named “Loop agg.dll”, which include the loop aggregator API; the second is “loop control”, which defines the current active loop detector. These two files work in coordination in the following manner. If “Loop agg.dll” is defined
23
in the “plugins” configuration file, Paramics will load this file the first time the network files (open a network) are loaded. After the simulation starts, “loop control” will tell Paramics to collect data from which detector and place the data into the MySQL database. At each simulation step, Paramics checks each detector to see if its name is defined in “loop control”. If yes, Paramics records the data and puts an aggregated (summation and then average) data into MySQL database every 30 seconds (simulation time); If not, it simply skips that detector. Such a mechanism allows us to collect data for any detector. If we find any detector is not needed for control, we can simply remove its name from the “loop control” file.
Below is an example of the “plugins” configuration file, the first line guides Paramics to load the loop agg.dll to collect detector data. ( “plugins” is a standard Paramics configuration file that can be found at ../Paramics/plugins/windows.) C:\ramp_metering\api\loop_agg.dll ##C:\Paramics\programmer\plugins\alinea\Debug\ramp_alinea.dll C:Paramics\programmer\plugins\SWARM\Debug\ramp_swarm.dll The “loop control” file is composed under the requirement of a specific control algorithm. In other words, it is the algorithm that determines which detector is going to be employed. A sample “loop control” file for the ALINEA local control algorithm is shown below: detector count 18
name ds405n0.93 \\ gather interval 00:00:30 \\ gather flow complete\\ gather speed complete \\ gather occupancy complete The first line says that data from 18 detectors need to be collected and put into MySQL database. And the second line indicates the name of the first detector, the third line is the simulation interval based on which we are going to take the average. The last three lines instruct Paramics to collect flow, speed and occupancy information for this detector. Other detectors, if
24
required by a particular algorithm, can be similarly defined.
3.1.4
Retrieve Data from MySQL Database
Retrieving data from the database is simply done by executing a query. By using the MySQL API, a query can be sent to the database server with API function calls. The following example code shows how to get a particular detector data.
OpenDatabase (database_name, NULL, NULL, NULL); sprintf(buf, "select * from %s where loop = ’%s’ and timeID = ’%s’", table_name, g_loop[i].loop, time_s); OpenRecordset(buf); occ = atof(GetField("g_occ")); vol = atoi(GetField("g_vol"));
Before starting database operations, the database needs to be opened first. This is done with the first line. The second and the third line construct the query command that will be sent to the MySQL server. OpenRecordset() is responsible for sending queries and fetching data (from the server) that satisfy the criteria specified in the query command. The last two lines retrieve the occupancy and volume data from the query result and convert them into two float type data.
Earlier we mentioned that “Loop agg.dll” is responsible for storing detector data into the database. Actually when “Loop agg.dll” is loaded by Paramics, a default database named “test” is first created. “test” only contains one table named “loop” which has the following data structure as shown in Table 3.1.
The field ‘loop’ stores the name of the loop detector. TimeID is the simulation time at which the data is collected. These two fields are frequently used as keys for a specific query. Fields “g vol”, “g occ” and “g spd” store the aggregated “volume”, “occupancy” and “speed”, that are the averages during the last 30 seconds (simulation time). Fields “vol1” -“vol10” store the volume of lane 1 to lane 10 with the first lane counted from the right. Similarly, “occ-i” is for the i-th lane’s occupancy and “spd-i” is for the i-th lane’s speed. 25
Table 3.1: Data structure used for loop detector in MySQL database Field Type Null Default loop char(15) YES NULL timeID time YES NULL g vol int(11) YES -1 g occ float YES -1 g spd float YES -1 q vol1 int(11) YES -1 occ1 float YES -1 spd1 float YES -1 vol2 int(11) YES -1 occ2 float YES -1 spd2 float YES -1 vol3 int(11) YES -1 occ3 float YES -1 spd3 float YES -1
3.2
ALINEA Algorithm
3.2.1
Algorithm Description
ALINEA (Asservissement Li´eaire d’Entre Autrouti´ere) is a local traffic-responsive strategy for ramp metering. The control strategy is based on a feedback structure and is derived by use of classical automatic control methods. ALINEA has had several successful field applications (Boulevard P´eriph´erique, Paris and A10 West Motorway, Amsterdam). The algorithm takes real-time traffic occupancy as an input. Its main objective is to maintain a smooth traffic flow by setting the metering rate in such a way that the combined flow will not exceed system capacity. ALINEA is a simple feedback control algorithm. For each ramp controlled, it uses only one detector to measure the occupancy at a point about 40 meters downstream of the ramp gore. ALINEA uses the following equation to determine the current metering rate for each ramp:
r(k) = r(k − 1) + KR [Oc − Oout (k)] where r(k) is the metering rate in time step k; r(k − 1) is the metering rate in time step k − 1 (previous); 26
(3.1)
KR is the regulator parameter (constant); Oc is the target occupancy to be maintained, typically slightly less than the critical occupancy (the occupancy corresponding to capacity flow); Oout (k) is the current occupancy measurement. KR is the only parameter to be adjusted in the implementation phase. In real-life experiments, a value of KR = 70 veh/hr was found to yield good results by Parageogiou (1997). (3.1) also shows that a larger KR tends to reduce the regulation time and lead to stronger reaction.
3.2.2
Detectors Used by ALINEA on I-405
ALINEA requires each controlled ramp has an associated detector to provide occupancy information. For its implementation on the south bound of I-405, the following 9 ramp-detector pairs (Table 3.2) have been employed for system control purpose. The location of these ramps as well as their associated detectors can be found in the network description file such as “nodes” and “detectors”. Table 3.2 only reflects the association relationship, where “ramp name” is the node name where the control signal is set; “number of lanes” is the number of lanes on the ramp. For details of the detector locations, refer to Appendix B.
Table 3.2: Detectors for ALINEA local control on I-405 south bound Ramp Name Location Number of Lanes Associated Detector 2079y Jamboree 2 ds405s7.01 3474 Jamboree 2 ds405s6.80 2557y Culver 1 ds405s5.68 3476 Culver 2 ds405s5.50 5424 Jeffrey 1 ds405s4.03 2557x Jeffrey 2 ds405s3.84 1822v Sand Canyon 2 ds405s2.88 452z Irvine Center Dr. 1 ds405s0.96 3481 Irvine Center Dr. 1 ds405s0.74
27
3.2.3
Implementing ALINEA on I-405 Southbound
The implementation of ALINEA ramp control algorithm mainly concerns the overload of the following two Paramics API functions: void api_setup(void); void net_action(void); The first function is called by Paramics during the initialization stage. It allows the user to insert initialization routines before the system actually conducts any control. In ALINEA algorithm, for example, api setup() is used to load ramp parameters from a plain text file named “alinea control” that is prepared in advance. The first few lines of “alinea control” is shown below: total number of ALINEA controlled ramps is:
9
ramp 7567 loop ds405n0.93 targetOcc 0.13 regulator 20000 number of lanes 1 critical queue length 30 ... The first line tells Paramics how many ramps are under control. It is immediately followed by a blank line that serves as a separation line. A ramp node is defined from line 3 to line 8. Line 3 gives the name of the ramp node; line 4 is the associated detector name; line 5 is the desired occupancy that is associated with the local ramp. Line 6 gives the number of lanes on the ramp, which is desired whenever calculating ramp volume. Line 7 provides a restraint on the ramp queue length. Although original ALINEA algorithm does not require queue adjustment, critical queue length is a useful parameter that can be applied on a modified version of ALINEA.
The definition of all other nodes is exactly the same as the first one. However, a blank line is always required to separate the definition of two adjacent ramp nodes. (The best way to create a new “alinea control” is to copy a sample file and modify some of the parameters (numbers) when necessary. Other words such as “ramp”, “loop”, “targetOcc” serve as key words and are
28
not supposed to be modified. )
For the internal representation of ramp node in memory, the following data structure is employed: struct ramp_alinea RAMP_ALINEA; { char *node;
// ramp name
char *loop;
// detector name
float targetOcc;
// desired occupancy
float Regulator;
// regulator
int
// number of lanes on ramp
NumOfLanes;
float queueLength;
// critical ramp queue length
int measuredVol;
// measured mainline volume
float measuredOcc;
// measured mainline occupancy
float oldRampRate;
// metering rate in previous step
float newRampRate;
// current metering rate
}; The comments after // give the meaning of each field, and most of them are self-explanatory. A noteworthy point is that memory for ramp nodes is allocated dynamically by the system – usually after the total number of ramps is determined from file “alinea control” : g_loop = calloc( g_rampNumber, sizeof(RAMP_ALINEA)); Finally, api setup() is also responsible for opening MySQL database where the on-line detector data are stored. A user-defined function called pp open database(void) is developed to finish the task. The following piece of code shows how to use this function: if (!(g_setup = pp_open_database())) return ; If the system fails to open the database, the program will be terminated immediately.
After the initialization part is finished, void net action(void) can be called to implement the control logic. This function is Paramics’ standard overload function that is called once for each simulation step that lasts about 0.5 second. However, for the purpose of traffic control and 29
management, the time scale of 0.5 second tends to be too detailed to show the variation trend, and a larger scale of 30 seconds is usually suggested. Currently, ALINEA uses 30 seconds as its control interval, which means we do not need to call net action(void) in each simulation step. The following piece of code tells Paramics to perform the control logic only under multiples of 30s. if (((int)simulationTime % g_timeInterval) = =0) { // calculate ramp metering rate for every controlled ramp } Detector data stored in MySQL database also use 30-second time scale. That is to say, although detectors report traffic status every 0.5 second, only the 30-second aggregated values are placed into the database.
The metering rates are updated through the following pseudo code, it is also a process of control decision making. For each ramp controlled by ALINEA { read associated detector data from database; retrieve old metering rate calculate new metering rate (control decision making) convert metering rate to control cycle update control cycle } For the above procedure, two points need to be clarified. The first is about the conversion from ramp metering rate ( how many vehicles are allowed to enter the freeway through the ramp per control interval) to the division of signal cycle (the length of green/red phase ) that actually controls the meter. Because the ALINEA algorithm only gives the metering rate of each ramp, this number needs to be converted further into its equivalent format of signal cycle. There are several ways to conduct the conversion. For ramp metering, the green phase is usually assumed to be fixed ( 2 seconds for example) and the red phase is allowed to be adjusted. For example, when a ramp needs to increase its metering rate (more traffic are allowed to enter 30
the freeway), a shorter red phase can be selected which makes most time of a control cycle green.
Two extreme cases need to be emphasized here. If the metering rate is sufficiently high, there may be no red phase in a cycle. On the other hand, if the metering rate is sufficiently low (near zero, for example), there will be a nearly infinitely long red phase. In simulation, these two cases are equivalent to opened and closed ramps. In this project, two boundaries are set to the cycle so that neither of the extreme cases could happen. The boundaries are defined by the following constants: #define FREE_HEADWAY 2.0 #define MAX_CYCLE 20 The lower boundary is 2 seconds which is equivalent to open ramp; and the maximum red cycle can be as long as 20 − 2 = 18 seconds. The following formula defines the conversion from metering rate to control cycle that also takes the number of ramp lanes into account. ram->cycle = g_loop[i].NumOfLanes *3600.0 / g_loop[i].newRampRate; Finally, this number needs to be compared with its two boundaries. If the calculated cycle is less than FREE HEADWAY, the control cycle is set to FREE HEADWAY; and if it is greater than MAX CYCLE, the control cycle is set to MAX CYCLE.
The second point is about the API that can actually set the control signal.
As men-
tioned earlier, these API functions are part of the ramp API module, and are included in a dll file named “actuated ramp.dll”. In order to use these function, a reference to “actuated ramp.dll” must be provided in Paramics’ standard “plugins” file that can be found at .../Paramics/plugins/windows.
The following user-defined data type is used for signal setting: typedef struct Ramp_data RAMP; struct Ramp_data { char *node; char *name; int
type;
float cycle;
// cycle type // the length of the cycle 31
}; A pointer to a RAMP type variable is returned by pp get ramp parameters() that takes a ramp’s name as its parameter. RAMP * ram = pp_get_ramp_parameters(g_loop[i].node); After the pointer is obtained, the corresponding metering rate is set to an appropriate value. ram->cycle = g_loop[i].NumOfLanes * 3600.0 / g_loop[i].newRampRate; ALINEA algorithm is implemented by several C codes that constitute an ALINEA program . Table 3.3 gives a short summary of the program’s contents. Table 3.3: Short summary of the ALINEA program File Name Content Alinea.h Function prototype of ALINEA algorithm( declaration) Alinea.c The implementation of ALINEA algorithm (abstract algorithm) Alinea c.h Constants used by ALINEA algorithm Alinea s.h User-defined data structure used to implement ALINEA with Paramics Alinea p.h Declaration of user-defined Paramics APIs and other external help functions Database p.h Prototypes of MySQL interface (API function declaration) Alinea ramp.c The implementation of ALINEA algorithm on I-405 network.Paramics API overriding. Readme.txt Notes and comments
3.2.4
Parameters for Calibration
Besides the location of the detectors, several other parameters of the ALINEA algorithm should be calibrated. Table 3.4 shows the names, the nominal values and the locations of these parameters.
32
Variable name targetOcc regulator critical queue length
Table 3.4: ALINEA Parameters Description Current value target Occupancy 0.13 for each detector KR value 20,000 Consider metering 30 adjustment
3.3
Bottleneck Algorithm
3.3.1
Algorithm Introduction
Location (file) Alinea control Alinea control Alinea control
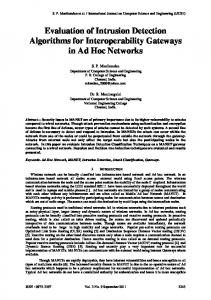
The Washington Department of Transportation began to use the Bottleneck algorithm in 1981 on I-5, north of the Seattle central business district. This algorithm is described as one of the most sophisticated operational ramp metering algorithms. It comprises of a local algorithm and a metering rate adjustment process. At the local level, historical data are used to determine approximate volume-occupancy relations for each ramp location (similar to ALINEA). The local metering rates are calculated to allow ramp volumes to equal the difference between the estimated capacity and the real-time upstream volume. The coordinated Bottleneck algorithm is activated when certain criteria are satisfied. The coordination component of the algorithm computes volume reductions through dynamically identified bottlenecks, then distributes these volume reductions to upstream ramps using predefined weights. According to Jacobsen et al. (1989), the algorithm is rather successful: travel time dropped from 22 minutes before metering to 11.5 minutes after metering, despite higher demand; the accident rate dropped about 39%, average metering delays at each ramp remained at or below three minutes. The whole algorithm is given in Figure 3.2.
3.3.2
Bottleneck Identification and Weighting Factors
Owing to the difficulties of collecting ramp queue information, the last three steps of the original Bottleneck algorithm, queue adjustment, HOV adjustment and advanced queue adjustment, are not considered in our study. For local control, the ALINEA algorithm studied earlier is used to replace the original local control logic in Bottleneck, mainly because ALINEA is a proven robust and effective local control algorithm. The implementation is then primarily focused on
33
Sys. Ramp Control
Local Control Algorithm
Bottleneck Control Algorithm BMR
LMR
BMR>=LMR
Yes
No Sys. MR=BMR
Sys. MR=LMR
Queue Adjustment
HOV Adjustment
Advanced Queue. Adjustment.
To Control
Figure 3.2: Bottleneck algorithm the coordination component. Coordination in the Bottleneck algorithm is based on the notion of a bottleneck. For a specific network such as I-405, the following three sub-problems concerned with a bottleneck need to be considered: • criteria for defining a bottleneck; • the location of the bottleneck; • the influence of the bottleneck on upstream ramps. For the Bottleneck algorithm, the concept of a bottleneck is time-location variant. In other words, where and when a bottleneck will appear cannot be determined in advance. The central 34
control logic uses a dynamic approach to locate a bottleneck. First, the corridor network is divided into multiple segments called “sections”. If a bottleneck appears, it must be in a specific section, and its approximate location can be identified by the location of the corresponding section— a time-invariant variable. Two criteria are used to find possible bottlenecks on a network. The first is the capacity criterion: Oobsv > Othrs
(3.2)
It checks if the occupancy of a section exceeds a pre-determined occupancy threshold. The second is the vehicle storage criterion: [ Iupstream + Ionramp ] > [ Xdownstream + Xof f ramp ]
(3.3)
It checks if a section is storing vehicles. A section is considered a bottleneck if both criteria are met.
During each simulation step, each section is checked to see whether it satisfies the bottleneck criteria. If a bottleneck is identified, the corresponding section is marked as a bottleneck section, which, according to the Bottleneck algorithm, needs a reduction of traffic demand from upstream ramps in the next control step to reduce its congestion. At this moment, the amount of demand reduction can be calculated for each bottleneck section. Since more than one upstream ramps are required to help reduce the demand of a bottleneck section, the burden to each ramp are weighed according to certain considerations, such as O-D fractions. In practice, two factors may affect the weights. One is the relative positions of the ramps to the bottleneck section (upstream ramps near the bottleneck section usually impact the bottleneck more than further upstream ramps). The other is the network traffic demand pattern. For example, it might be unwise to restrict those vehicles that exit the mainline ahead of the bottleneck. In the absence of accurate O-D information, the weights are usually assigned according to the relative positions of the ramps–the further upstream a ramp is from the bottleneck, the smaller is its weight. We use the following example to show how the demand reduction is assigned to each ramp. In Figure 3.3, a bottleneck is located at the immediate downstream of Ramp 4 (R4 ). It is decided that this reduction was to be shared by ramps R1 through R4 . Considering R3 and R4 are nearer to bottleneck B, we can assign the following shares (weights) to them: 0.4,and 0.4,respectively. Since R1 and R2 are further upstream, a share (weight) of 0.1 can be assigned to both ramps. 35
It is necessary that weights related to one bottleneck sum up to 1.0. Certainly the weights can be better decided if O-D information is available.
B
R1 0.1
R2 0.1
R3 0.4
R4 0.4
Figure 3.3: A typical bottleneck in a freeway section If each section and each ramp are considered, we then have a weighting matrix, as shown in Table 3.5. Here each ramp helps its downstream bottleneck sections, and the summation of Table 3.5: Weighting matrix for Bottleneck control weighting section 1 section 2 · · · section n ramp 1 w11 w12 · · · w1n ramp 2 w21 w22 · · · w2n ··· ··· ··· ··· ramp m wm1 wm2 · · · wmn
each column is equal to one:
X
Wij = 1
i
3.3.3
Data Structure and Algorithm Implementation
A section in the Bottlenck algorithm is bounded by two mainline detectors, one upstream and one downstream, and one on-ramp detector for each of its entrance and one off-ramp detector for each of its exits. For adjacent sections, the same mainline detector serves both as the downstream detector for the upper section and upstream detector for the lower section.
Table 3.6 shows the functions of these detectors. The internal (in memory) representation of a section uses a type called SECTION:
36
1
typedef struct section_definition SECTION;
2
struct section_definition {
3
int index;
4
char name[40];
5
int nOnRamp;
6
int nOffRamp;
7
float criticalOcc;
8
float balance;
9
DETECT * upMainLoop;
10
DETECT *downMainLoop;
11
DETECT * onRampLoops;
12
DETECT *offRampLoops;
13
SECTION * next; }; Table 3.6: Functions of mainline and ramp detectors Detector Name Function Upstream detector Measure the total amount of traffic that entered the section during the last simulation interval through mainline Downstream detector Measure the total amount of traffic that left the section during the last simulation interval through mainline On-ramp detector Measure the total amount of traffic (one for each on-ramp) that entered the section during the last simulation interval through entrance Off-ramp detector Measure the total amount of traffic (one for each off-ramp) that left the section during the last simulation interval through exit
All sections form a chain structure (defined in line 13). Within each section the boundary detectors are defined first (line 9 and 10) and then two ramp detector chains (line 11 for onramp, and line 12 for off-ramp). The total number of on/off -ramp is explicitly defined (line 4 and 5) that also determines the length of the on/off ramp chain. And finally, each section has a critical occupancy (line 7) that forms one of the criteria to evaluate whether the section is a bottleneck. For a potential bottleneck section, the traffic balance ( line 8) needs to be calculated during the last control cycle. A positive balance number indicates that the bottleneck section 37
does need help from upstream on-ramps. Corresponding to the “section” definition, an input data file called “bottleneck section def.txt” is defined for initialization as that in the ALINEA algorithm. This file has a special format that should be conformed to: number_of_section_defined_for_the_network
section
1
critical_occupancy
0.2
up_mainline_loop_name
405s7.38ml
down_mainline_loop_name
405s6.21ml
number_of_onRamp_loop_defined
2
onRamp_loops
405s7.01ora 405s6.80ora
number_of_offRamp_loop_defined
1
OffRamp_loops
405s7.14fr
section
2
critical_occupancy
6
0.2
up_mainline_loop_name
405s6.21ml
down_mainline_loop_name
405s5.01mlc
number_of_onRamp_loop_defined
2
onRamp_loops
405s5.68ora
number_of_offRamp_loop_defined
1
OffRamp_loops
405s5.83fr
405s5.50ora
...... The first line defines the total number of the sections. For I-405 south bound, 6 sections are defined. (please refer to Appendix B and C for detailed information on the deployment of the detectors). Then each segment of the code defines one section. A blank line is required to separate two different sections
Since the ramp also uses ALINEA for local control, the data structure of ramp is quite similar to that of the ALINEA. The additional parts, line 15 and line 16 in the code below, provide extra information for reducing the bottleneck traffic. Line 15 defines a chain that keeps all the 38
weights for this ramp to other sections, while line 16 keeps the total number of vehicles that this ramp should reduce to relieve demand pressure for all the bottleneck sections downstream of it, if there is any. 1
typedef struct ramp_bottleneck RAMP_BOTTLENECK;
2
stuctramp_bottleneck
3
{
4
char *node;
5
char *loop;
6
float targetOcc;
7
float Regulator;
8
int NumOfLanes; // # of lanes for ramp
9
float queueLength; // the length of the critical queue
10
int measuredVol;
11
float measuredOcc;
12
float oldRampRate;
13
float newRampRate;
14
int index; /* internal identify */
15
float *sectionWeight;/* point to section weight */
16
float help; /* total number of vehicle this ramp should reduce */ };
// for local ALINEA
The following code is a sample of the “alinea control” file in the Bottleneck algorithm, which is quite similar to that in ALINEA algorithm. After defining the total number of ramps (line 1), an extra line is added to define the total number of sections. At the end of each ramp segment, the weighting factors are defined for each ramp. Note that this line represents one of the rows in the weighting matrix. The total number of weights for each ramp equals to the total number of sections defined.
total number of ALINEA controlled ramps is: total number of section is: 6
ramp 7567 loop ds405n0.93 39
18
targetOcc 0.13 regulator 20000 number of lanes 1 critical queue length 30 0.0 0.1 0.2 0.3 0.0 0.0 ...
3.3.4
Override Paramics API
The implementation the Bottleneck algorithm in Paramics mainly concerns with overriding two Paramics API functions. The first one, void api setup(void), is nearly the same as that for the ALINEA algorithm. The only difference is in reading data for ramp and section definition and input files “alinea control” and “bottleneck section def.txt”. The second function, which is unique to each control algorithm, is net action().
The following tasks need to be carried out within net action() at the beginning of each ramp control cycle. For a clearer presentation, the pseudo code instead of the real code is used to explain the control logic. Except for line 4, all other calculations are straightforward in net action(). 1 For each section, calculate surplus traffic (balance >0 if bottleneck) 2 For each ramp 3 { 4
calculate traffic reduction.
5
calculate bottleneck metering rate, based on the result of step 4 and old metering rate
6
calculate local control metering rate based on ALINEA.
7
compare results from steps 5 and 6, take the less one as the new metering rate
8
set the new metering rate
9 } Line 4 concerns with the calculation of section surplus traffic. This is done through a helper function pp section balance(SECTION * CurrentSect) which takes a pointer to the current section. Within pp section balance(), the section is checked to see if it is a critical section (bottleneck criteria 1). If yes, and it is also storing vehicles (input traffic is greater than output traffic), the current section is a bottleneck section and the demand reduction (positive balance) is computed. 40
Line 5 calculates the bottleneck metering rate (BMR) for each ramp. Based on the result of line 4, the bottleneck metering rate will be equal to: Ã ! X W F j j i rj (t) = Vonramp Vsurplus (t − 1) − (t − 1) × P j W Fj
(3.4)
i
where r(t) is the ramp metering rate of the current control cycle; j (t − 1) is the entrance volume on ramp j during the past control cycle; Vonramp i (t − 1) is the surplus volume of the bottleneck section; Vsurplus
W Fj is the weighting factor for the j-th ramp.
3.3.5
Parameters for Calibration
The parameters in Table 3.7 should be carefully calibrated before operating the Bottleneck algorithm. This table also shows the values of some of the parameters obtained from our calibration effort. Table 3.7: Adjustable parameters for Bottleneck algorithm Variable name Description value Location (file) targetOcc target Occupancy 0.13 Alinea control for each detector regulator KR value 20000 Alinea control critical Consider metering 30 Alinea control queue length adjustment critical occupancy Critical occupancy 0.2 Bottleneck section for each zone def.txt weighting factors Weighting factors Alinea control For each ramp
3.4
Zone Algorithm
Zone algorithm was introduced in the Minneapolis/St. Paul area along I-35 East in 1970. It divides the network into variable length of “metering zones”, usually three to six miles long. The upstream boundary of a zone is required to be a free-flow area while the downstream a critical bottleneck where demand capacity ratio is usually high. A zone may have an arbitrary number of 41
entrance and exit ramps. However, not all of the entrance ramps in a zone are “metered” ramps.
Zone algorithm tries to balance the volume of the traffic entering and leaving the zone. In a 30-second metering interval, it uses the following equation to calculate ramp metering rate:
A+U +M +F =X +B+S
(3.5)
where A is the upstream mainline volume, measured value; U is the sum of volumes from non-metered ramps, measured value; M is the sum of the volume from metered ramps, to be calculated; F is the sum of metered freeway to freeway ramp volumes, to be calculated; X is the sum of exit ramp volumes, measured value; B is the downstream bottleneck capacity; S is the space available within the zone.
B
A M
U
X
Figure 3.4: A typical zone.
42
By letting S = 0, the maximum volume that can enter the system through the metered ramp becomes M + F = (X + B) − (A + U ) The metering rate for each metered ramp is obtained based on the ramp factor and (M + F ): Rr = fr (M + F ) where Rr is the metering rate of ramp r, and fr is the ramp factor that defines the share the current ramp should take to balance the zone traffic demand-supply
3.4.1
Implementing Zone Algorithm on I-405 Southbound
Implementing Zone algorithm concerns with overriding two Paramics API functions similar to those of ALINEA algorithm. Thus only the parts that are unique to this algorithm are discussed here.
The first function is api setup()
This API function is overridden to initialize all the parameters required by Zone algorithm. When api setip() is called by Paramics, it reads data from several input files to initialize internal variables that represent ramps, zones, etc. The data structure for ramp definition is quite similar to that of Bottleneck algorithm:
typedef struct ramp_zone RAMP_ZONE; struct ramp_zone { char *node; char *loop; float targetOcc; float Regulator;
// for local ALINEA
int
// # of lanes for ramp
NumOfLanes;
43
float queueLength;
// the length of the critical queue
int measuredVol; float measuredOcc; float oldRampRate; float newRampRate;
int index; /* internal identify */ float *zoneWeight; /* point to zone weight */ float help; /* total number of vehicle this ramp should reduce */ }; The input file for ramp definition is “zone control”, which uses the following format: total number of controlled ramps is: total number of zone is:
18
6
ramp 7567 loop ds405n0.93 targetOcc 0.13 regulator 20000 number of lanes 1 critical queue length 30 0.0 0.0 0.5 0.0 0.0 0.0
...
The first line defines the total number of ramps under control; and the second line gives the total number of zones. After a blank line, the first ramp is defined. The ramp factor is defined in the last line of each ramp definition. In the code above, for example, ramp 7567 is responsible for 50% of the traffic adjustment of section 3. The ramp factors for I − 405 south bound are listed in Table 3.8. However, these factors need 44
to be calibrated further in the real network in order to achieve the most efficient control. The calibration is based on the consideration of the following three aspects: • Ramp location. For example, upstream ramps may weigh less than downstream ramps in a zone. • Traffic demand pattern. Ramps with heavy demand going through the zone may weigh more than other ramps; • Ramp queue length. Considering the consequence of queue spillback, ramps with long queues may weigh less than those with short queues. There might be also other network-specific factors that also influence the weighting. Table 3.8: Ramp factor of Zone algorithm in our simulation study Ramp Name Zone index 1 2 3 4 5 6 2079 0.5 0 0 0 0 0 3474 0.5 0 0 0 0 0 2557y 0 0.6 0 0 0 0 3476 0 0.4 0 0 0 0 5424 0 0 0.5 0 0 0 2557x 0 0 0.5 0 0 0 1822v 0 0 0 1.0 0 0 452z 0 0 0 0 0 0.5 3481 0 0 0 0 0 0.5
3.4.2
Defining Zones
The data structure for zone definition will be discussed below. Actually, this structure is nearly the same with the SECT ION definition used by Bottleneck algorithm. The only difference is that an additional field named “NumOfLanes” is added to mark the number of lanes on mainline at the end of each zone (in order to calculate the downstream bottleneck capacity). A typical zone is represented in the algorithm by using the following structure: typedef struct zone_definition ZONE; struct zone_definition{ int index; 45
zone index 1 2 3 4 5 6
Table 3.9: Zone definition Upper boundary Lower boundary loop index loop name loop index loop name 1 405s7.38ml 11 405s5.68ml 11 405s5.68ml 18 405s5.01mlc 18 405s5.01mlc 25 405s5.01mlc 25 405s5.01mlc 29 405s2.35ml 29 405s2.35ml 34 ds405s1.01 34 ds405s1.01 40 405s0.6ml
char name[40]; int nOnRamp; int nOffRamp; float bottleCap; int numOfLanes; float balance; DETECT * upMainLoop; DETECT * downMainLoop; DETECT * onRampLoops; DETECT * offRampLoops; ZONE * next; }; For the I-405 south bound implementation of the Zone algorithm, the network is partitioned into 6 zones (first column of Table 3.9) according to the location of the boundary detectors. For each zone, the loop detector in the third column defines the zone’s upper boundary on I − 405 while the fourth column detector defines the zone’s lower boundary. The location of each loop detector is defined in a detector file that is used by Paramics. Under the Windows version of Paramics, this file can be found at “.../network/detectors”
The partition information of Table 3.9 is usually put into a feeding file for the purpose of initialization. When the algorithm ( .dll file ) is loaded, this feeding file is read by the system to fill up the data structure that internally represents zones. The name of the file is not arbitrary. For Zone algorithm, this file is named “zone zone def.txt”. In addition to the boundaries defined 46
in Table 3.9, the zone feeding file also needs to define the on/off-ramps within a zone. The first few lines of “zone zone def.txt” are displayed below: number_of_zone_defined_for_the_network
zone
6
1
downstream_bottleneck_capacity 2220 downstream_bottleneck_number_of_lanes up_mainline_loop_name down_mainline_loop_name number_of_onRamp_loop_defined
5
405s7.38ml 405s5.68ml 2
onRamp_loops 405s7.01ora 405s6.80ora number_of_offRamp_loop_defined
1
OffRamp_loops
405s7.14fr
.... For example, the first zone contains 2 on-ramps and 1 off-ramp, and each ramp has one detector to measure its traffic volume. The ramp detectors also mark the side boundaries of each zone. Similar to the mainline detectors, the locations of these ramp detectors are also defined in “zone zone def.txt”.
3.4.3
Algorithm Implementation
Two Paramics API functions need to be overridden. The first one is api setup(), which uses two data files “zone control” and “zone zone def.txt” to initialize the algorithm. The initialization is quite similar to that of the Bottleneck algorithm and we will not repeat it here. The second function is net action(). It is overridden when the control logic is implemented. The pseudo code is given follow. For calculating the maximum volume, a helper function pp zone balance(g zone[i]) is used to return that number. For each zone calculate maximum volume End 47
Table Variable name bottleneck capacity
3.10: Adjustable parameters for Zone algorithm Description Current value Location (file) Downstream 2220 v/h/lane zone zone def.txt bottleneck capacity of each zone Ramp factors Weighting factor Table (3.8) Zone control to share the maximum Volume for each zone
For each ramp assign metering rate based on the calculated maximum volume and
ramp factors
do boundary adjustment set metering rate End Please refer to (3.4) for the computation of ramp metering rate.
3.4.4
Parameters for Calibration
Parameters in Table 3.10 should be calibrated when using the Zone algorithm.
3.5
SWARM Algorithm
3.5.1
Algorithm Description
SWARM algorithm consists of two individual independent control algorithms: SWARM1 and SWARM2. During each time interval, the more restrictive of the two will be implemented. SWARM2 is a local control algorithm that is much simpler than SWARM1. The latter, using linear regression and Kalman filtering process, aims to forecast system evolution and maintains the real-time density below a pre-defined saturation density for each road segment.
SWARM1 works in the following way (also see Figure 3.5). For each detector, it uses the past data to forecast the density trend. The time into the future to forecast is a tunable parameter named Tcrit. Once the forecast density trend is obtained, it can be combined withTcrit to
48
calculate the excess density (the portion above the saturation density). Excess density is used to calculate the target density for the next metering cycle: Target Density = (Current Density) − (1/Tcrit ) × (Excess Density)
(3.6)
The volume reduction is: Volume Reduction = (Local Density - Target Density) × ( number of lanes) (3.7)
ity
Tr en
d
Density
×(Distance to next Station)
Excess Density
Fo
re
ca
st
De
ns
Satuation Density
Req
u
Den ired
sity
Tcrit
Time
Figure 3.5: SWARM prediction
3.5.2
Prediction — ARX model
The SWARM ramp metering algorithm requires traffic prediction for each detector loop based on the past detector measurements. The original algorithm uses linear regression and a Kalman filtering process to forecast the traffic trend. For our implementation, the prediction part is replaced by an ARX model:
A(z −1 )y(k) = B(z −1 )u(k) + e(k) where 49
(3.8)
y(k) is the predicted variable; u(k) is a vector of input variables; A(z −1 ), B(z −1 ) are polynomials of the shift operator z −1 Model calibration can be shown with the following example. Consider a sub freeway system consisting of section i and (i + 1). Let the occupancy of section i be the output of this system, and the occupancy of section (i + 1) be the input of this system. Define the (na + nb + 1) input-output vector x(k) as x(k) = [−y(k − 1), · · · , −y(k − na ), u(k − nk ), · · · , u(k − nk − nb )]T and the (na + nb + 1) parameter vector θ as θ = [a1 , · · · , ana , b0 , · · · , bnb ] then (3.8) can be rewritten as y(k) = xT (k)θ + e(k)
(3.9)
and the optimal estimation of θ is given by
θˆ = (X T X)−1 X T Y
(3.10)
where Y = [y(n+1), · · · , y(N )]T is a vector of dimension (N −n) and X = [x(n+1), · · · , x(N )]T is an (N − n) by (na + nb + 1) matrix. For I − 405 south bound, the highway is divided into 15 segments, and each segment is combined with a loop detector. So the total number of detector employed on the mainline is also 15. The detector is numbered in the order of from upstream to downstream. And if the forecasting of each detector requires the next two downstream detectors’ data, only the first 13 detectors can be predicted here.
In order to improve the accuracy of prediction, we use detector data collected from three sections ( one current section plus two downstream sections) to calibrate the model. And 50
correspondingly, the prediction is also based on detector data from these three sections. Assume section i is now under consideration, its two adjacent downstream sections are (i + 1) and (i + 2) respectively. The input-output vector x(k) now becomes
x(k) = [−y(k − 1), · · · , −y(k − na ), u(k − nk1 ), · · · , u(k − nk1 − nb ), v(k − nk2 ), · · · , v(k − nk2 − nc )] Through our experiment and another study (Zhang, 2001), [na , nk1 , nb , nk2 , nc ] is suggested to take the following value [na , nk1 , nb , nk2 , nc ] = [3, 1, 2, 1, 2] and θ now is θ = [a1 , a2 , a3 , b1 , b2 , c1 , c2 ] For calibration, we run the simulation with a number of typical demand patterns. The detector data are then collected to construct the X matrix, and θ is estimated through (3.10).
3.5.3
Zone Definition on I-405 Southbound
The implementation of SWARM requires the division of the network into multiple smaller “zones”. On I-405 south bound, the division is conducted according to Table 3.11. These data are contained in a feeding file named “swarm zones” which has the following format. The first line defines the total number of zones of I-405 south bound. After a blank line, the first zone is defined. Each zone has a loop detector to provide traffic data. Also, each zone needs a saturation density which may differ from zone to zone.
Total_number_of_zones 15
zone 1 loop 405s7.38ml number_of_lanes 6 distance_to_next_detector 900 51
Index 1 2 3 4 5 6 7 8 9 10 11 12 13 14 15
Table 3.11: Zone definition for SWARM algorithm Zone Upstream detector Downstream detector length # of Loop Loop Loop Loop lanes # Name # Name 900m 6 1 405s7.38ml 4 ds405s7.01 630m 6 4 ds405s7.01 7 405s6.80 1450m 5.5 7 405s6.80 13 405s5.50mla 830m 5 13 405s5.50mla 16 405s5.01mla 715m 5 16 405s5.01mla 19 405s4.75ml 850m 5 19 405s4.75ml 20 405s4.03ml 460m 5 20 405s4.03ml 24 ds405s3.84 720m 5 24 ds405s3.84 25 405s3.31ml 750m 5 25 405s3.31ml 28 ds405s2.88 850m 5 28 ds405s2.88 29 405s2.35ml 850m 5 29 405s2.35ml 30 405s1.73cd 700m 5 30 405s1.73cd 34 ds405s1.01 750m 6 34 ds405s1.01 36 ds40s0.96 270m 6 36 ds40s0.96 39 ds405s0.74 500m 6 39 ds405s0.74 40 405s0.6ml
saturation_density 50 ... The internal representation of each zone within Paramics uses the following data structure. The field “balance” is used to store the volume reduction of the zone. typedef struct zone_definition SECTION; struct zone_definition{ int index; char name[40]; float saturationDen; float balance; float numOfLanes; float dis2Next; DETECT * upMainLoop; };
52
3.5.4
Ramp Definition on I-405 Southbound
Each ramp is required to store data from two sources. One is local control (SWARM2), and the other is coordinated control (SWARM1). For local control, ALINEA is used to replace SWARM2, and hence most of the ramp definition parts in SWARM are very similar to that of ALINEA. For the coordinated control, the pre-defined weighting factors need to be stored for volume reduction assignments. The following data structure is used to describe the internal representation of each ramp: typedef struct ramp_swarm RAMP_SWARM; struct ramp_swarm { char *node; char *loop; float targetOcc; float Regulator; int
NumOfLanes;
// for local ALINEA // # of lanes for ramp
float queueLength;
// the length of the critical queue
int measuredVol; float measuredOcc; float oldRampRate; float newRampRate; int index; /* internal identify */ float *sectionWeight; float help;
/* point to section weight */
/* total number of vehicle this ramp should reduce */
}; The feeding file, which is used to initialize each ramp, has the following format: total number of ALINEA controlled ramps is: total number of section is: 15
ramp 7567 loop ds405n0.93 targetOcc 0.13 53
18
Table 3.12: Weighting factors for SWARM Zone Ramp 1 2 3 4 5 6 7 8 2079 0.5 0.7 0.3 0.2 0.1 0.1 0 0 3474 0 0.3 0.4 0.2 0.2 0.1 0.1 0 2557y 0 0 0.3 0.3 0.3 0.4 0.3 0.2 3476 0 0 0 0.3 0.4 0.4 0.3 0.2 5424 0 0 0 0 0 0 0.3 0.3 2557x 0 0 0 0 0 0 0 0.3 1822v 0 0 0 0 0 0 0 0 452z 0 0 0 0 0 0 0 0 3481 0 0 0 0 0 0 0 0
Table 3.13: Weighting factors for SWARM algorithm (continued) Zone Ramp 9 10 11 12 13 14 15 2079 0 0 0 0 0 0 0 3474 0 0 0 0 0 0 0 2557y 0.1 0 0 0 0 0 0 3476 0.2 0.1 0.1 0.1 0 0 0 5424 0.3 0.2 0.2 0.2 0.2 0.1 0 2557x 0.4 0.3 0.3 0.3 0.3 0.3 0.1 1822v 0 0.4 0.4 0.4 0.3 0.3 0.2 452z 0 0 0 0 0.1 0.3 0.3 3481 0 0 0 0 0 0 0.4
regulator 20000 number of lanes 1 critical queue length 30 0 0 0 0 0 0 0 0 0 0 0 0 0 0 0 This format is quite similar to that of Bottleneck algorithm. The weighting factors, defined in the last line of each ramp, determine how much a ramp needs to help its downstream zones. For I-405 south bound, the following weighting factor matrix is currently used. In practice, the weighting factors are also parameters for algorithm calibration.
54
3.5.5
Implementing SWARM in Paramics
The implementation of SWARM in Paramics mainly concerns with overriding two Paramics API functions: api setup() and net action(). The first function is used to initialize the input variables, while the second, which usually is unique for a specific control algorithm, implements the control logic.
The first part is defining and loading two files “alinea control” and “swarm zones”. The procedure is the same as in ALINEA, Bottleneck and Zone implementations. The second part is rewriting the function net action(), which collects loop detector data and computes metering rates. The pseudo code for SWARM is as follows. 1
For each zone, calculate the volume reduction
2
For each ramp
3
{
4
calculate traffic reduction based on the weighting factors
5
calculate metering rate, based on line 4 and old metering rate
6
calculate local control metering rate based on ALINEA.
7
compare line 5 and 6, take the less
8
set the new metering rate
as the new metering rate
} The most important function of net action() is the computation of the volume reduction for each zone. This requires the forecast of the density trend, which is done through the ARX model presented earlier.
3.5.6
Parameters for Calibration
The following parameters should be calibrated when using the modified SWARM algorithm.
55
Table 3.14: Parameters for calibration in the modified SWARM algorithm Variable Description Current Location name value (file) Tcrit Time steps into 5 Swarm c.h the future to forecast FORECAST SIZE # of historical records 10 Swarm c.h Saturation Critical density 50 Density for each zone
56
Chapter 4
Paramics Simulation Traffic simulation programs are useful tools for modeling and predicting traffic flow, evaluating traffic management strategies, and designing roadway facilities before field operations. This study employs a microscopic traffic simulation program, Paramics (PARAllel MICroscopic Simulation), to evaluate and compare a number of ramp metering algorithms selected in Chapters 2 and 3. Paramics, developed by Quadstone Limited, is a suite of high performance tools for microscopic simulation, consisting of Paramics Modeller, Processor, Analyzer, Programmer, and Monitor. This chapter introduces Paramics software and discusses about the simulation network, coding and some preliminaries for the simulation.
4.1
Introduction
Paramics comprises a suite of high performance, user programmable software for microscopic traffic simulation. It enables finer descriptions of network structure, vehicle types, vehicle performance, and various kinds of traffic flow information acquisition. The most valuable feature of Paramics is its Application Programming Interface(API). It enables the user to override the default functions in Paramics, such as its car-following, merging, vehicle release, and route choice codes. Users can also add their own APIs to implement many traffic control/managemnet strategies within Paramics. Recently released Paramics version 3.0 by Quadstone Limited consists of five software modules: Modeller, Processor, Analyser, Programmer, and Monitor. (Paramics Modeller V 3.0 User Guide).
57
Modeller is the main module of the Paramics suite. It provides three fundamental operations: geographic and traffic data input, simulation, and acquisition of statistical traffic data output using both graphic user interface or text coding. Processor sets up and runs the traffic simulation in batch mode without visualizing the model. Processor is useful when running sets of different simulations in a much shorter time. Analyser is an analysis tool for displaying the output from simulation. Analyser can provide a range of statistics such as simulated vehicle paths, traffic flow volume by link and turn, maximum queue lengths, and simulated journey times. Programmer is a framework that allows customization of many default Paramics features, such as input/output of traffic data, the specification of driver and vehicle behavior, modification of routing and assignment algorithms. Access to this module is provided through the Application Programming Interface (API). Monitor estimates the levels of traffic emission pollution on a road network.
Figure 4.1: Window display of Paramics Modeller
58
Figure 4.1 depicts the main display windows of Modeller. Most of the Modeller options can be selected by the pull down menus located in the top of the main window. Network can be constructed by using the editor button located in the left bottom toolbars or by coding nodes, links, and link characteristics in the text file format. The main window also contains a number of other sub-windows such as parameter variation sliders, the dash board view window, and the interactive traffic data window.
Paramics Modeller and Programmer serve as the major modules for our ramp metering evaluation study.
4.2 4.2.1
Paramics Coding Network
Paramics simulation begins with building up the study network. To construct a network, node and link data, junction descriptions, roadway facilities and turning movement information are to be coded either by GUI or in the form of text files. In this study, a stretch of the Interstate 405 freeway in Orange County is selected as the study site. The reasons for selecting this site are as follows. First, the Orange County roadway system, including I-405, is already coded and simulated for the ATMS study at University of California, Irvine. Utilizing one of these coded networks not only guarantees time and cost savings but also provides more realistic and reliable network than a hypothetical network. Second, a number of detectors are already installed in this section of I-405 and are producing real time traffic data. These traffic data can be used both for the development of simulation scenarios and the validation of simulation results. Third, in the selected section of I-405, traffic congestion is often observed in peak hours, where ramp metering can play a role in reducing congestion. Moreover, this study may directly help the management of I-405 at the selected location. The study network consists of 6 interchanges with the following crossing roadways from north to south: Jamboree, Culver, Jeffrey, Sand Canyon, Freeway 133, and Irvine Center Drive (Figure 4.2). The distances between two intersections are in the range of 1.3km ∼ 2.7km and it takes about 5.5 minutes to travel from the Jamboree interchange (I.C.) to Irvine Center Drive at free flow speed 65mph. The number of lanes in this section of I-405 varies from 5 to 6, and the
59
I-4
05
Jamboree
no
rth Culver
2472
Jeffrey
m
Sand Canyon
2724
m
Freeway 133
131
2m Irvine Center Dr.
186
1m
1101m I-40
5 so u
Figure 4.2: Configuration of simulation network (I-405) corresponding ramps have 1 or 2 lanes (see Figure 4.3 for details). On the I-405 freeway section, the most left lane is a HOV lane in each travel direction. The existence of HOV lanes and the proportion of vehicles that use the HOV lanes may significantly affect ramp metering. However, HOV lanes are converted to regular lanes in the coded network due to the lack of information on HOV demand. This would not affect our conclusions because all the metering algorithms are compared under the same traffic conditions on the same network. In future studies, it would be desirable to gather HOV demand and evaluate the performances of the ramp metering algorithms for the I-405 network with HOV lanes. The acceleration lane extended from an on-ramp varies from 100m to 500m and the metering signals are located at the stop line about 30∼60 m upstream of the nose of the acceleration lane. The operation of the metering signal is similar for all the interchanges and Figure 4.4 shows the operation of the signal at the Culver I.C. While some of the on-ramps are two-lane roads, Paramics programmer does not allow different signal plans for each lane of the on-ramp. In other words, the signals for each lane of the on-ramp turn green or red at the same time. This might be inconsistent with real ramp metering signals, where the signals of two adjacent lanes turn green or red in an alternate way. But it is thought that the timing of the adjacent lane metering signal does not affect significantly on the general results of the ramp metering.
60
th
44
26 44
13 44 44
44
44
8 44
26
13
44 44
44
7
44
43
43
44
25
8
44 43
43 44
17
7
Category
Lanes
Free speed (mph)
Width (m)
7
2
45
8
8
3
45
12
13
3
50
44
25 44 44 17
2
55
8
25
5
65
20
26
6
65
24
43
1
50
4
44
2
50
8
56
3
60
12
7 44
25
56
44 44
12
17
43
43
43 7
44 26 43
44
43
26 56
Figure 4.3: Roadway categories
4.2.2
Detectors
In the simulation network, 40 detectors are located on the southbound I-405 and 36 detectors are located on the ramps connected to the southbound I-405 (see Appendix B). The names of the detectors follow the format such as 405s5.23ml. Here, ‘405’ denotes Interstate 405, and ‘s’ denotes southbound, ‘5’ denotes the interchange number, ‘23’ is the detector number and the last letter ‘ml’ denotes the location of the detector. For example, ‘ml’ is for mainline, ‘or’ for on ramp, ‘fr’ for off ramp, and ‘orspill’ for on ramp spillback. Some of these detectors represent the real detectors of the network and some of them do not exist in the real network but are coded into the simulation network to collect traffic data that are required by some of the ramp metering algorithms. Figure 4.5 depicts the typical locations of the detectors in the intersections. Refer to Appendix B for the names and locations of all the detectors in the network. The specific functions of detectors located in the intersection are already discussed in the previous chapter and the following will discuss in detail about the traffic data that these detectors produce.
The detectors in Paramics work in the same way as the real induction loop detectors, but can also gather some traffic data that could not be collected by real detectors. Once the loop
61
Figure 4.4: Operation of metering signal detectors have been specified, traffic data can be obtained interactively using detector window or from output ASCII files. The definitions of the traffic data in Paramics are as follows. (Note these definitions are not the same as in traffic engineering literature).
Occupancy: ‘The difference in time between the head of the vehicle crossing the upstream edge of the detector and the tail of the vehicle crossing the downstream edge of the detector.’
Gap: ‘The difference in time between the tail of the leading vehicle crossing the downstream falling edge and the head of the following vehicle crossing the upstream raising edge.’
Headway: ‘The time between the head of the leading vehicle crossing the upstream edge of the detector and the head of the following vehicle crossing the upstream edge of the detector. Thus headway is identical with occupancy + gap.’
Flow rate: ‘The inverse of headway as 3600/h.’ The way Paramics reports flow rate does not conform to the conventional definition of average flow rate produced by a detector. It is better to use count data to obtain average flow rate measured in a time interval.
62
Figure 4.5: Typical locations of detectors at an interchange Count: ‘The total number of vehicles crossing the loop at a particular time.’
These point data are recorded every time a vehicle passes over a detector and there can be three types of point data.
Incomplete: ‘the term used to define the occupancy or gap value associated with a loop detector at a specific time. If incomplete occupancy is non-zero, the associated loop detector is occupied. Incomplete gap is the opposite of incomplete occupancy i.e. incomplete gap is non-zero while the loop is not occupied by a vehicle. Incomplete values are updated at every simulation time step.’
Complete: ‘the term used to define the occupancy, gap, and headway associated with the last vehicle that crosses a loop detector. These values are not necessarily updated every time step, in other words, once these values are set they will be held until a new vehicle crosses the loop.’
Smoothed: ‘the weighted average value of the previous smoothed point data value and new point data value. For example, say a loop has current smoothed occupancy A and a new vehicle just passed the detector has complete occupancy B. Then the new smoothed occupancy will be (1-a)*A+ a*B using a smoothing factor a. Smoothed values are used to dampen the fluctuations
63
of point data that naturally exist in microscopic simulation and the real world.’
As flow rates obtained from Paramics detector change from vehicle pair to vehicle pair, their values can fluctuate significantly even for a short period of time. The raw Modeller loop detector data produced from Paramics are not aggregated ones. Considering most of the real traffic data of the freeway in California produces 30 seconds aggregate data, and we intend to change the ramp metering signal plan for every 30 seconds, we aggregate the Paramics raw traffic data into 30 seconds data. For this purpose, an API (loop detector API) that aggregates the raw loop data is developed. This API produces the count, occupancy, flow, and headway for each lane every 30 seconds and also their average values over all lanes.
Traffic data produced from loop detector API is used to obtain the fundamental diagram (capacity and critical occupancy) offline and 30s occupancy online. Both are used in the selected ramp metering algorithms.
4.2.3
Vehicles
Different types of vehicles have different performance characteristics such as maximum travel speed and acceleration/deceleration rates. Accordingly, the mixture of vehicle types affects the characteristics of traffic flow. For example, the capacity of a road section increases with the increase of passenger cars in the vehicle mix. In Paramics, we can use either default vehicle types or user-defined vehicle types. The default vehicle types include car, lgv (light goods vehicle), lgv1 (ordinary goods vehicle class1), ogv2 (ordinary goods vehicle class 2), coaches, or service buses (large or minibus). In Paramics, file vehicles specifies the vehicle fleet in the network and its characteristics. For each type of vehicles we can specify its physical dimensions and performance characteristics, such as length, height, width, weight, top speed, acceleration and deceleration rates. Our simulation study uses 5 types of vehicles and their specifications are shown in Table 4.1.
64
Table 4.1: Fleet of vehicles and their characteristics Type CAR LGV OGV1 OGV2 COACH
4.2.4
Length (m) 4.6 6.0 8.0 11.0 10.0
Height (m) 1.4 2.6 3.6 4.0 3.0
Width (m) 1.75 2.3 2.4 2.5 2.5
Top speed (km/hr) 163.3 126.0 104.4 118.8 126.0
Acc. (m/sec2 ) 3.0 1.8 1.1 1.4 1.2
Dec. (m/sec2 ) 5.0 3.9 3.2 3.7 3.7
Proportion (%) 90 2 2 3 3
Zoning and Traffic Demand
For modeling origin-destination traffic demand, 16 zones are created in the study network (Figure 4.6). Although size of a zone is not related to its traffic demand or vehicle release rate, it should be large enough to cover at least half of the origin link, where vehicles are released. Otherwise Paramics may not release vehicles in a first-in-first-out manner. The base O-D demand matrix used in our simulation study was estimated from loop data collected from 5:15 to 5:30 PM on Feb. 22, 2001 through UCI ATMS Testbed’s data intertie to Caltrans District 12’s TMC, and is shown in Table 4.2. This demand matrix represents the evening peak hour demand pattern. Figure 4.6 shows the traffic demand for various sections of I-405 computed from Table 4.2. Assuming the capacity of each lane is 2,000vph, it can be seen from this figure that the traffic demand for the section between the Culver interchange and the Freeway 133 interchange exceeds its capacity. Therefore congestion will build up at this location. Three other demand matrices are also created by scaling this peak-demand matrix to create different levels of congestion on the study network.
4.3
Modifications to and Calibration of Paramics Simulation
During several test runs with Paramics Modeller version 3.0, we found some unrealistic traffic behavior that needs to be remedied. One case concerns spontaneous slow-downs of some vehicles in light traffic for no apparent reason. Another case concerns merging vehicles from entrance ramps. The merging vehicles, while waiting for gaps of sufficient length to appear in the rightmost freeway lane, form a long queue on the entrance ramp even though freeway traffic is nearly
65
14
15 16
300
12
1080
932
0
300
600 620
10
385
1042
0 600
13
8
360 620
6
220
1022
4
150
5
355 360
11
865
350
105
90
155
220 500
240
106
40
9 7
460
1027 0 220 500
5
956 50 0
1 2
3
Figure 4.6: Zones and traffic demand free-flowing. The (over-cautious) gap acceptance behavior of ramp merging vehicles in Paramics has thus created the metering effect without the presence of ramp meters. After several rounds of intensive discussions with Quadstone software developers, the causes of the aforementioned problems have been identified and remedies to correct them were also found. They are described below.
4.3.1
Signposting
In Paramics, drivers consider many factors when they decide on their travel speeds and travel lanes. One of the factors is roadway geometry. Among the geometry coding elements, stop line, kerb, and signposting significantly affect vehicle speed. The following is Paramics’s definition of these elements: Stop Line: ‘Stoplines are used to pass a vehicle from one link to another, and a vehicle has to pass through an exit stopline and then entry stopline. If the stoplines are correctly placed and in line with each other, a vehicle does not have to change direction when changing links. However if the stoplines are misaligned the vehicle will have to slow down to make the transfer at a safe speed set as 45mph. For this situation, speed drop can be created in the vicinity of the link joint. The effect of the slow down would be more distinctive when vehicles are traveling in higher speed.’
66
zone 1 2 3 4 5 6 7 8 9 10 11 12 13 14 15 16 Total
1 0 0 0 0 0 0 0 0 0 0 0 0 0 0 0 0 0
2 0 0 50 240 220 220 0 350 840 200 600 360 600 1080 0 4800 9560
3 300 0 0 20 0 0 0 0 0 0 0 0 0 0 0 500 820
4 72 0 20 0 0 0 0 0 0 0 0 0 0 0 0 500 592
5 70 0 0 0 0 400 0 5 10 10 15 10 10 0 0 400 930
Table 4.2: Travel demand matrix 6 100 0 0 0 600 0 0 0 10 10 5 15 10 0 0 300 1050
7 100 0 0 0 0 0 0 20 0 0 0 0 0 0 0 150 270
8 100 0 0 0 0 0 20 0 5 0 0 0 0 0 0 150 275
9 600 0 0 0 0 0 0 0 0 40 0 0 0 0 0 360 1000
10 600 0 0 0 0 0 0 0 0 0 0 0 0 0 0 360 960
11 380 0 0 0 0 0 0 0 0 0 0 40 0 0 0 600 1020
12 380 0 0 0 10 0 0 0 0 0 40 0 0 0 0 600 1030
13 300 0 0 0 0 0 0 0 0 0 0 0 0 40 0 300 640
14 35 0 0 0 0 0 0 0 0 0 0 0 30 0 0 300 365
15 4000 0 900 960 830 830 0 940 60 360 360 480 720 450 0 0 10890
16 0 0 0 0 0 0 0 0 0 0 0 0 0 0 0 0 0
total 7037 0 970 1220 1660 1450 20 1315 925 620 1020 905 1370 1570 0 9320 29402
Kerb: ‘Kerb points represent the inside and outside edge of the road surface. The position of the kerb points affects the default positions of the stop line points and the entry points of the link. Therefore an inappropriate coding of the kerb points also can create a slow down.’
Signposting: ‘Paramics provides signposting function to assign the location of a signpost at which drivers are aware of the hazard (e.g. road narrowing, restrictions, or junctions) ahead. The specification of signposting consists of two numbers (X,Y). X is the distance upstream from the hazard that the driver with highest awareness value sees the hazard. The driver with lowest awareness value sees the hazard at (X-Y) upstream from the hazard. The other drivers see the hazard at some points between X and (X-Y) upstream from the hazard in proportion to their awareness value. Once a driver sees the hazard she/he will determine if a lane change is required. If a lane change is required she/he will attempt to change into the required lane by the normal lane changing procedure. If a gap is not available immediately she/he will carry on until a gap is available.’
During the test runs, we found that many of the unrealistic slow-downs are related with signposting. The default signposting specification is (750,1). Under the default condition, it is found that the speeds of vehicles decreased drastically at the point of 750m upstream from the junction, where vehicles try to change lane. When traffic is heavy, this signposting effect is so strong that traffic congestion begins to appear at the vicinity of the signpost. To remedy
67
this problem, we consulted Quadstone technical support staff and came up with the following solution: we increased X and Y values in the signposting specification as much as the length of a link permits. After increasing the signposting values, we found that vehicles moved quite smoothly at the problem locations and sharp speed drops at the vicinity of the signpost location were eliminated.
4.3.2
Merging Behavior
Realistic merging behavior of drivers is critical to our ramp metering evaluation study. If drivers merge very aggressively, ramp traffic can easily cause congestion on the freeway. On the other hand, if drivers merge only when there is a sufficiently long gap, queues can easily form on an entrance ramp while freeway may be still free-flowing. In reality, drivers merge in such a way that conditions on the freeway and entrance ramps equilibrate if no ramp metering is applied to the entrance ramps. In Paramics Modeller version 3.0, the behavior of merging vehicles is conservative, and there lacks flexible control over the aggressiveness of the merging vehicles. In response to our requests, Paramics software developers have updated the Paramics Modeller to version v3.0.7-beta-c, adding more control over driver merging behavior. The following sections discuss various controls over drivers’ merging behavior in Paramics v3.0 and 3.0.7-beta-c. • Paramics Modeller v3.0
Several measures can be used to influence drivers’ merging in Paramics Modeller v3.0. One is to reduce freeway link headway factor. With a small headway factor, freeway traffic provides more acceptable gaps for merging traffic. Another is to increase drivers’ awareness of merging locations, and still another is to increase the length of the acceleration lane. However, it is found that these remedial measures are not sufficient to overcome the very conservative merging behavior in Paramics Modeller v3.0. Ramp vehicles released from a meter signal still queue up on the acceleration lane while freeway traffic is free-flowing. In reality, a freeway vehicle that approaches the merging point usually anticipates on-coming conflicts with a merging vehicle and tries to either move to an inner lane or slow down. Such lane changing movements or slow-downs are also triggers of traffic congestion. However, Paramics v3.0 did not provide this kind of driver behavior logic. 68
• Paramics Modeller v3.0.7-beta-c
To enhance the merging behavior algorithm of version 3.0, Paramics program developers released a beta version, Paramics Modeller v3.0.7-beta-c . This beta version provides three measures to control ramp merging behavior.
Ramp Headway Factor: ‘Ramp headway factor is used to control the acceptable headway on the freeway, with which each merging vehicle determines whether to merge or not. The default value is 1.0 and reducing this value will allow more vehicles to merge and easier occurrence of traffic congestion caused by merging vehicles. The minimum value is 0.2 and there is no maximum value.’
Minimum Ramp Time: ‘For version 3.0, the merging of a vehicle can be active on the ramp at least in 2 seconds to prevent the vehicle merging almost immediately. For very short ramps, this restriction may not be appropriate. A vehicle can very quickly find itself in the position where it needs to merge. To correct this problem, Minimum Ramp Time parameter is introduced to control the time that vehicles on the ramp begin to attempt merging. This value is used to dampen the ability of drivers to merge with the main line traffic immediately after joining the ramp. The default value is 2, reducing this value will allow vehicles to merge at a much faster rate. The minimum value is 0 and the maximum value is 3.’
Ramp Awareness Distance: ‘Ramp Awareness distance is defined as the distance at which vehicles in the main line traffic will become aware of any approaching ramp. When a vehicle on the left most lane of the main line becomes aware of a vehicle on the ramp, it will attempt to change lanes in order not to be interrupted by the merging vehicle. In version 3.0, ramp awareness distance has always been derived from the signposting distance of the specified link. In version 3.0.7-beta-c, the new Ramp Awareness Distance parameter has been provided to give more control over the specification of this value. The minimum value for this distance is 1m, and the maximum value is constrained by the distance projected backward from the point the ramp joins the main line to the start of the link that the ramp joins. This feature has been
69
provided primarily to aid ramp awareness for those ramps in this simulation network.’
Figure 4.7: Window of the ramp attributes control Figure 4.7 shows the control window of Ramp attributes, Headway factor, Minimum gap time, and Ramp Awareness distance. This window is activated by selecting a subject link and taking ’Modify Ramp’ function. For the simulation, we set Minimum ramp time 1 sec, Headway factor 0.33, and Ramp Awareness Distance 154∼247m. Tests of the network showed that the beta version showed remarkable improvement in modeling ramp merging compared with other versions of Paramics.
4.3.3
Estimation of Critical Occupancy and Capacity
The basic philosophy of many ramp metering algorithms is to alleviate or eliminate traffic congestion of a freeway by maintaining the density of the freeway below critical density. Such metering algorithms usually require the knowledge of critical density downstream of the merging point. Since loop detector produces occupancy instead of density and Paramics can also produce occupancy data, occupancy is used as the control parameter in this ramp metering 70
simulation.
Critical occupancy can be obtained by drawing occupancy and flow scatter plots for a given detector. An accurate occupancy-flow plot of I-405 can be obtained from field detector data. However, due to the car-following algorithm that Paramics employs, the occupancy-flow plots obtained from simulated detector data differ from those obtained from field detector data. In this study the ramp metering algorithm is evaluated through simulation only and it is thought that taking the occupancy-flow diagram obtained by the simulation would be more appropriate for the use in the ramp metering algorithm evaluation.
Six detectors, placed at the downstream of six interchanges respectively, are used to collect the occupancy and flow data (Figure 4.8). To obtain sufficient traffic data that cover a wide range of occupancy, the simulation is run for two hours, which has four 30-minutes periods. As for the traffic demand, we generated 70%, 110%, 60%, and 40% of basic travel demand(Table4.2) for the first, second, third, and fourth period, respectively. This travel demand scenario produced severe traffic congestion from Freeway133 I.C. to Jamboree I.C. The occupancy-flow diagrams are shown in Figure 4.9. The occupancy and flow values in Figure 4.9 are obtained by averaging detector data from all lanes. These 6 occupancy-flow diagrams show quite similar patterns. According to the four occupancy-flow plots corresponding to the four upstream detectors, it is seen that the free flow speed could be maintained until the occupancy value reaches around 0.18. When occupancy is over 0.18 the speed begin to decrease. However, the flow does not decrease as drastically as the speed and there exists a wide range of occupancy (0.18-0.3) that higher flow rate is obtained. The occupancy-flow plots presented in Figure 4.9 show smoother peaks and the critical occupancy could not be clearly identified. Here, we take 0.18 as the critical occupancy and 2000vph as the capacity.
Most of the empirically derived fundamental diagrams show a sharp drop of flow beyond critical occupancy. But the occupancy-flow diagrams obtained from Paramics simulation do not show this kind of flow drop and their boundaries between uncongested and congested traffic are rather obscure. The car-following algorithm used in Paramics clearly has room for improvement.
71
ds405s6.80
ds405s5.50
ds405s3.84
ds405s2.88
ds405s1.01 ds405s0.74
Figure 4.8: Detector locations for the occupancy-flow plots
72
Figure 4.9: Occupancy-flow plots for I-405
73
Chapter 5
Simulation Results and Analysis 5.1
Simulation Design
Numerous simulation runs are performed to estimate the effectiveness of four ramp control strategies, ALINEA, Bottleneck, SWARM, and Zone. For comparison purpose the No Control scenario is also considered. For Bottleneck and SWARM, we used ALINEA to replace their original local control algorithms. The prediction models for the SWARM are also modified. We believe these modifications would enhance rather than degrade the performance of these two algorithms. To differentiate our versions of Bottleneck and SWARM from the original algorithms, we call them as modified bottleneck and modified SWARM. Hereinafter, modified Bottleneck algorithm will be named as MBTN. For modified SWARM, we developed two algorithms. MSWARMI, to be named hereinafter, employs one-step-ahead prediction (30seconds). Another SWARM algorithm, named as MSWARMV, predicts 5-steps ahead (150seconds).
Each simulation is conducted for two hours, which consists of four 30-minutes periods. Each period has its own O-D demand table. During the first period, the traffic is light and no congestion occurs. In the second period, the demand is high such that the congestion begins to occur. For the third and fourth periods, traffic becomes light again and finally at the end of the simulation no congestion exist on both the freeway and on-ramps. We hypothesize that the effectiveness of ramp control varies over the severity of congestion and thus simulate for three different traffic demand levels. Basically the traffic demand of each period is some percentage of the observed peak hour O-D table (Table 4.2) and we have three demand scenarios according to the congestion level as in Table 5.1. For demand Level 3, heavy congestion occurs during simulation periods 2∼3 ,and the length 74
Table 5.1: Demand scenarios for the simulation Congestion level Level 1 Level 2 Level 3
period 1 70% 70% 70%
period 2 90% 100% 110%
period 3 50% 50% 50%
period 4 30% 30% 30%
of the maximum ramp queue is more than 1 km long. This heavy congestion completely dissipates at the end of simulation period 4. On the contrary, for Level 1 demand, freeway congestion is light and ramp queue lengths are relatively short and dissipates at the end of period 3. The occurrence and dissipation of the congestion will be discussed in the following section.
The effectiveness of ramp control are also affected by the parameter values of the algorithm. Because it is difficult to analytically derive the parameters’ values that give the best performance of an algorithm, we conducted some preliminary simulation runs to choose the parameter values that give a good performance. For ALINEA, we tried 0.1 and 0.13 for target occupancy and 10000, 20000, and 30000 for regulator gain (KR ). Accordingly, there exist 6 (2×3) parameter sets with 3 demand levels, resulting in a total of 18 scenarios. We simulated the 5 control alternatives (No control, ALINEA, MBTN, MSWARMV, and Zone) under the 18 scenarios. A set of parameter values was chosen based these simulation runs.
In Paramics, the release of the vehicles can be randomized by a specified seed value. If we use different seed values, even for the same network and demand, the simulation results still differ from each other due to the random release of vehicles. From some preliminary simulation runs it was found that the MOE (measurement of effectiveness) of a ramp control algorithm is slightly different for each different seed value. This fact implies that we cannot definitely say one control algorithm is better over the other control algorithm just based on a single simulation run. Therefore, we conducted 10 simulation runs by changing the seed value from seed #1 to seed #10 so that the average MOE of each algorithm can be inferred.
75
5.2
MOE
5.2.1
Computation of MOE
Several traffic characteristics, such as link speed, queue length, and travel time can be used as MOEs (measurements of effectiveness) and the selection of the proper MOE much depends on the study purpose. In this study, we are interested in the overall performance of each ramp control algorithm and take TVTT (total vehicle travel time) as the MOE. TVTT is defined as the sum of all vehicles’ O-D travel times during the simulation time. In this research, TVTT is obtained from the following procedures.
1. Paramics can produce every vehicle’s destination arrival time and the travel time from its origin to its destination (we can command Paramics to produce this output by simply typing ‘gather trip info’ in ‘measurement’ file. This output is stored in the directory ‘log\run-xxx\trips-ALL’). 2. After the simulation, from each vehicle’s travel time, we can compute the average travel time for a specific O-D pair. 3. We multiply the average travel time of a specific O-D pair with the total demand (during the simulation time) of the corresponding O-D pair. 4. Summing up the vehicle travel time for all the O-D pairs gives the TVTT that is used as the MOE in this research. In a mathematical way, TVTT can be expressed as " PN Vij # k X k=1 Tij Dij TV TT = N Vij
(5.1)
∀i,j
where, N Vij =the total number of vehicles that actually traveled between origin i and destination j during the simulation, Dij =the travel demand of origin i and destination j for the simulation time Tijk =the travel time of kth vehicle that traveled between origin i and destination j. Note that Dij and N Vij are not the same due to the randomness of the vehicle release.
76
In fact, Total Vehicle Travel Time, as the term represents it, could be obtained directly from the output as in (5.2).
TV TT =
Vij X NX
Tijk
(5.2)
∀i,j k=1
However, (5.2) cannot be an appropriate MOE. Because, in this research, we conduct multiple(10) simulation runs by changing the seed value for a subject control algorithm. In this case, the number of vehicles released from an origin can vary according to the seed number and if a lower number of vehicles is released from the origin, it would give a lower TVTT value. To minimize this bias resulting from the randomness of the vehicle release, we compute the average O-D travel time and then multiply it with the original demand as in (5.1).
By comparing the TVTT of two ramp control algorithms, say ALINEA and no control case, we would know how much total vehicle travel time is saved by ALINEA. Considering that saving travel time is one of the primary purposes of ramp control and that travel time can be compared across modes, TVTT is believed to be a good measurement of effectiveness.
5.2.2
Statistical Inferences
To compare the TVTTs of two control algorithms, where each control algorithm is simulated for several times, a statistical technique on the comparison of the mean is required. This section discusses about the inference concerning two population means. (Source: Chase and Bown, 1997).
When two population is independent and sample size is large(usually more than 30), the hypothesis H0 : µa = µb can be tested by the statistic
¯b ¯a − X X z=q . σb2 σa2 + na nb where, z is standard normal distribution, 77
µa , µb are the population mean of sample a and b ¯ b are the sample mean ¯a, X X σa , σb are the population standard deviation of sample a and b na , nb are the sample sizes. When σa and σb are unknown, we can use the sample standard deviations sa and sb as estimates. When the sample size is small(less than 30) and the population can be assumed to be normally distributed, the test hypothesis concerning population means use the test statistic, ¯b ¯a − X X t= q . s2b s2a + na nb
(5.3)
This statistic is a Student’s t distribution and the degree of freedom can be obtained either by the smaller value of na − 1 and nb − 1. However, it is known that the smaller value of na − 1 and nb − 1 as the degree of freedom is too conservative and gives a rather small value for the degree of freedom. If degree of freedom is smaller, it gives too much advantage to the null hypothesis H0 . Statisticians suggest an alternative value for the degree of freedom as ³ df =
µ
s2 a na
s2b s2a na + nb ¶2 µ
na −1
+
´2 s2 b nb
¶2
(5.4)
nb −1
To compare the performance of two control algorithms, we conduct 10 simulation runs for each control algorithm. This is a small sample size inference and we use t value computed by ¯ a is the mean of the TVTTs for one control algorithm (5.3) as the statistics. In this case, X ¯ b is the mean of TVTTs for the other control algorithm. If we intend to test the null and X hypothesis H0 :the TVTT of two control algorithm is the same (in other word, the performances of these two control algorithms are same) two tail-test is to be conducted. In other words, if t > t(α/2, ν) the null hypothesis is rejected and if t ≤ t(α/2, ν) the null hypothesis is accepted, where ν is the degree of freedom.
When we intend to test the null hypothesis H0 :the TVTT of one control algorithm is better than that of the other control algorithm (i.e., the performance of one control algorithm is better 78
than the performance of the other control algorithm) one-sided tail test is to be conducted. In other words,
if t < t(α, ν) the null hypothesis is rejected and if t ≥ t(α, ν) the null hypothesis is accepted.
5.3
Results and Analysis
This section describes the results of the simulation and their analysis. First, we investigate the general pattern of the congestion, say, when and where the congestion begins and how it propagates and dissipates. Understanding the general pattern of the congestion in the study site is important for the further analysis because it could uncover some hidden errors in the simulation or reveal site-specific traffic characteristics and limitations of the simulation. This investigation would be made through observation of the Paramics simulation window or arrival time(AT)/travel time(TT) diagrams, which can be obtained by processing some outputs of the simulation. Second, through a number of simulation runs with different parameter sets, we select a parameter set that seems to give the best performance of the ramp metering algorithm. The effectiveness of the ramp control algorithms can vary according to the parameter values and a fair comparison of the performance of different ramp metering algorithms is valid only when these algorithms are equally well calibrated. Third, we compare the performance of ALINEA, MBTN, MSWARMI, MSWARMV, and Zone based on the TVTT MOE. And last, we conduct sensitivity analysis to investigate how the performance of a ramp metering algorithm is affected by its parameter values and travel demand patterns.
5.3.1
Overview of the Congestion Pattern
According to Table 5.1, traffic demand is heaviest in period 2. In periods 1, 3, and 4 the demand is light. Under this demand pattern, congestion begins in period 2 and dissipates in periods 3 or 4. The congested sections span from Jamboree I.C. to Sand Canyon I.C. Congestion was hardly observed downstream of the Freeway 113 interchange because of relatively light traffic demand on (see Figure 4.6) and sufficient capacity (6 lanes) of this section. Two kinds of vehicle
79
No control 3000
3000
2000
2000
1000
1000
0
0
2000
4000
0
6000
ALINEA
0
2000
MBTN 3000
2000
2000
1000
1000
0
2000
4000
0
6000
0
2000
Zone travel time(sec)(16->2)
3000
2000
1000
0
0
2000 4000 arrival time(sec)
6000
MSARMV
3000
0
4000
6000
Figure 5.1: Arrival time/travel time for O-D 16 → 2
80
4000
6000
No control
ALINEA
3000
3000
2000
2000
1000
1000
0
0
2000
4000 MBTN
0
6000
3000
2000
2000
1000
1000
0
2000
4000
2000
4000
0
6000
0
2000
travel time(sec)(13->2)
Zone 3000
2000
1000
0
0
6000
MSWARMV
3000
0
0
2000 4000 6000 arrival time(sec) Figure 5.2: Arrival time/travel time for O-D 13 → 2
81
4000
6000
No control
ALINEA 3000 travel time(sec)(11->2)
3000
2000
1000
0
0
2000
4000
2000
1000
0
6000
0
MBTN travel time(sec)(11->2)
1000
0
2000
4000
2000
1000
0
6000
0
2000
Zone 3000 travel time(sec)(11->2)
6000
3000
2000
2000
1000
0
4000
MSWARMV
3000
0
2000
0
2000 4000 6000 arrival time(sec) Figure 5.3: Arrival time/travel time for O-D 11 → 2
82
4000
6000
No control
ALINEA 3000 travel time(sec)(9->2)
3000
2000
1000
0
0
2000
4000
2000
1000
0
6000
0
2000
3000 travel time(sec)(9->2)
3000
2000
1000
0
2000
4000
2000
1000
0
6000
0
2000
Zone travel time(sec)(9->2)
3000
2000
1000
0
6000
MSWARMV
MBTN
0
4000
0
2000 4000 6000 arrival time(sec) Figure 5.4: Arrival time/travel time for O-D 9 → 2
83
4000
6000
behavior are observed to cause traffic congestion in the study site. 1) frequent weaving upstream of the Culver, Jeffrey, and Sand Canyon interchanges. It is discussed earlier that the distance of the signpost usually determines where vehicles begin to change lanes. For example, when the signpost distance is short from the exit ramp, the occurrences of vehicle speed drops concentrate in a short section of the freeway. In this case traffic congestion is more easily generated than when the signpost distance is long. In our simulations the distance of the signposting is taken as large as the length of the link to ensure smooth weaving. 2) Vehicles that merge from ramps to the freeway also cause speed drops of the upstream vehicles, especially when the traffic on the freeway is near capacity.
The general congestion pattern of the simulation network can be viewed through arrival time(AT)∼travel time(TT) plots. Figure 5.1 - Figure 5.4 present the AT–TT plots for vehicles traveling from zones 16 to 2, 13 to 2, 11 to 2, and 9 to 2, under the following control scenarios: No control, ALINEA, MBTN, MSWARMV, and Zone. The parameters used to generate these figures are: demand level 2, target occupancy 0.13 and regulator 20000 (the AT–TT plots show similar trends for all demand levels and parameter sets). Here, the arrival time (the time that a vehicle arrived at the destination. Time zero is the beginning of the simulation) is the arithmetic average of the arrival times of 10 vehicles that consecutively arrived at the destination. The travel time is the arithmetic average of origin/destination travel time (the time taken to travel from the origin to the destination) for these 10 vehicles. The reason of taking the arithmetic average of 10 vehicles’ travel times is to smooth out the fluctuations in individual vehicle’s travel time so that we can present a clear view of temporal travel time variations. The fluctuations of individual vehicle travel times are caused by, among other factors, differences in lane speeds. Some vehicles that use the inner most freeway lane, for example, could arrive at their destinations earlier than vehicles that use the outer most freeway lane even though they may have departed from the same origin at the same time. Figure 5.1, which depicts travel times of freeway-to-freeway traffic, shows that the congestion in the mainline began about 5 minutes after the second simulation period starts. It is clear that ramp metering reduces travel times for mainline traffic during the peak period, and congestion on the mainline dissipates early with control than without control. But the travel time patterns under different control algorithms seem to be not much different. It is noted that the congestion
84
dissipates much faster than it develops, regardless of control. This is primarily due to lighter demand in periods 3 &4. Figures 5.2, 5.3, and 5.4 show the AT–TT plots for ramp-to-freeway traffic for O-D pairs zone 13 to zone 2, zone 11 to zone 2, and zone 9 to zone 2. Compared with freeway-to-freeway traffic, these figures show that travel times of ramp-to-freeway traffic are higher with ramp control than without ramp control. This implies that these ramp vehicles incur longer queuing delays on the metered ramps than their travel time savings on the freeway due to metering. Whether ramp metering is beneficial or not clearly depends on if it saves more travel times on the mainline or it causes more delays on the metered ramps.
5.3.2
Selection of the Parameters
Many parameters affect to the performance of ramp metering algorithms. For example, target occupancy and regulator gain are critical to ALINEA’s effectiveness. In the case of ALINEA, a high target occupancy value would mean more delay on the freeway and less delay on the ramps, and a higher regulator value would mean a faster response to downstream traffic conditions. In the case of MBTN, MSWARM, and Zone algorithms, the weighting factors defined in Table 3.6, Table 3.12, and Table 3.8 are critical for the performances of these control algorithms. Because of the complex interactions between simulation and control, to-date there is no systematic procedure to optimize these parameters. As a result, parameter calibration in a simulation study often resorts to trial and error. We illustrate here how the parameters in ALINEA is obtained using this process.
Earlier (Figure 4.9) we found the critical occupancy for our simulated sections is 0.18. It is customary to choose a target value slightly less than the critical occupancy in ALINEA control, leaving a safety margin for ‘overshooting’ by ALINEA. Based on our engineering judgement, we come up with a test set consists of target occupancies 0.10 and 0.13, and regulator gains (KR ) 10000, 20000, and 30000. For each combination of these parameters, one simulation run (using seed value 1) is made and the results are shown in Table 5.3. The numbers in Table 5.3 are the TVTTs in veh·hr unit and the numbers in the parenthesis are the ratios (in percentage unit) of TVTT with and without control. For example, when target occupancy is 0.10 and regulator is 10,000 the TVTT of ALINEA is 97.8 % of the TVTT of no control. In this case ALINEA 85
Table 5.2: Weighting factors of MBTN algorithm Zone Ramp 1 2 3 4 5 6 2079 0.5 0.15 0.05 0 0 0 3474 0.5 0.15 0.05 0.05 0 0 2557y 0 0.35 0.10 0.05 0 0 3476 0 0.35 0.10 0.10 0.10 0 5424 0 0 0.35 0.10 0.10 0.05 2557x 0 0.35 0.10 0.05 0 0 1822v 0 0 0 0.35 0.4 0.2 452z 0 0 0 0 0 0.35 3481 0 0 0 0 0 0.35
reduces the TVTT as much as 2.2 %. Table 5.3 shows that there is no specific parameter set that always gives the lowest TVTT value for ALINEA, MBTN, and MSWARMV with demand levels 1, 2, and 3 (the TVTT of Zone algorithm is constant regardless of target occupancy and regulator because it does not use target occupancy and regulator gain). When target occupancy is 0.10, MSWARMV control performs poorly, although ALINEA, MBTN performs reasonably well in most cases. MSWARMV performs better when target occupancy is 0.13. ¿From this table it is not difficult to pick a reasonably good set of parameters, and it is (0.13, 20,000) in this case. Ideally, these parameters should be adjusted on-line but this is not done here.
5.3.3
Comparison of Control Algorithms
One hundred and eighty simulation runs are made to compare the performances of ALINEA, MBTN, MSWARMI, MSWARMV, and Zone ramp control algorithms. For each algorithm, we run simulation 10 times with different random seeds for three demand levels. The results are shown in Table 5.4. For the lightly congested traffic(Level 1), TVTT of No control varies between 2699∼2876 veh·hr with different random seeds. The mean TVTT of No control is 2778 veh·hr. When ramp control is applied, TVTT decreases. For example, MSWARMI has the smallest TVTT of 2706 veh·hr, achieving 2.5% reduction from the No control case. In this demand scenario MSWARMV performs worst. It reduces TVTT by only 1veh·hr, a statistically insignificant amount. Through visual inspection of the simulation process, it was found that MSWARMV does not respond to
86
Table 5.3: TVTTs for different regulator value KR and target occupancy(veh·hr(%)) Parameters Target Occ.=0.10 Reg.=10,000
Demand level Level 1 Level 2 Level 3
Target Occ.=0.10 Reg.=20,000
Level 1 Level 2 Level 3
Target Occ.=0.10 Reg.=30,000
Level 1 Level 2 Level 3
Target Occ.=0.13 Reg.=10,000
Level 1 Level 2 Level 3
Target Occ.=0.13 Reg.=20,000
Level 1 Level 2 Level 3
Target Occ.=0.13 Reg.=30,000
Level 1 Level 2 Level 3
No control 2876 (100) 3255 (100) 4062 (100) 2876 (100) 3255 (100) 4062 (100) 2876 (100) 3255 (100) 4062 (100) 2876 (100) 3255 (100) 4062 (100) 2876 (100) 3255 (100) 4062 (100) 2876 (100) 3255 (100) 4062 (100)
87
ALINEA 2812 (97.8) 3265 (100.3) 3825 (94.2) 2674 (93.0) 3049 (93.7) 3882 (95.5) 2670 (92.8) 3266 (100.3) 3699 (91.0) 2701 (93.9) 3182 (97.7) 3801 (93.6) 2724 (94.7) 3320 (102.0) 3789 (93.3) 2831 (98.4) 3397 (104.4) 3892 (95.8)
MBTN 2728 (94.9) 3117 (95.8) 3799 (93.5) 2736 (95.1) 3090 (94.9) 3751 (92.3) 2758 (95.9) 3147 (96.7) 3730 (91.8) 2729 (94.9) 3200 (98.3) 3830 (94.3) 2735 (95.1) 3103 (95.3) 3637 (89.5) 2705 (94.0) 3269 (100.4) 3925 (96.6)
MSWARMV 2765 (96.1) 3288 (101.0) 4126 (101.6) 2895 (100.7) 3511 (107.9) 3942 (97.0) 2919 (101.5) 3493 (107.3) 4199 (103.4) 2827 (98.3) 3307 (101.6) 4013 (98.8) 2766 (96.2) 3138 (96.4) 3899 (96.0) 2768 (96.2) 3410 (104.7) 4018 (98.9)
Zone 2720 (94.6) 3126 (96.0) 3706 (91.2) 2720 (94.6) 3126 (96.0) 3706 (91.2) 2720 (94.6) 3126 (96.0) 3706 (91.2) 2720 (94.6) 3126 (96.0) 3706 (91.2) 2720 (94.6) 3126 (96.0) 3706 (91.2) 2720 (94.6) 3126 (96.0) 3706 (91.2)
the changes of mainline traffic conditions promptly. For example, when the mainline traffic congestion rapidly dissipates, MSWARMV still predicts that the traffic will be congested for the next 5 time-steps and exercises harsh control accordingly. MSWARMI (which predicts traffic conditions 1 step-ahead), on the other hand, did not show this kind of retarded action therefore performed better than MSWARMV. This result indicates that the precision of the prediction model is critical to SWARM’s performance.
Various statistical tests are conducted to infer about the performance differences of the four metering algorithms. Table 5.5 shows the t-values and degrees of freedom computed from the simulation results. A one-tail test is conducted to test the null hypothesis—‘the TVTT of a control algorithm is lower than that of No control.’ From the t-table, we know that t(0.05,13)=1.771, t(0.05,16)=1.746, t(0.05,14)=1.761, t(0.05,18)=1.734. Because the computed t-values for ALINEA, MBTN, MSWARMI, and Zone are all larger than the corresponding tvalues form the t-table, we conclude, at the 5% significance level, that the TVTTs for these control algorithms are lower than No control. In other words, these four control algorithms do improve overall traffic conditions (i.e., reducing TVTT) compared with No control. An exception is the MSWARMV algorithm, in which we rejected the null hypothesis and concluded that MSWARMV did not improve overall traffic conditions. To compare the performances of the four control algorithms, two-sided tail tests are conducted. Based on these tests it is concluded that the performance differences in ALINEA, MBTN, and Zone are statistically insignificant under light traffic demand. For moderately congested traffic (Level 2), the lowest TVTT is obtained by the MBTN control algorithm. It reduces the TVTT of No control as much as 5.1%. Table 5.5 shows that all 5 control algorithms have lower TVTT values than No control. The performance of Zone algorithm is superior to ALINEA (t= 2.27), MSWARMI (t=2.20), and MSWARMV (t=2.38), and similar to the modified bottleneck algorithm MBTN with 95% degree of confidence. Conclusively, for the traffic demand Level 2, all five control algorithms reduce TVTT significantly. And among the five control algorithms, MBTN and Zone have better performances than the other three algorithms.
For traffic demand Level 3, as in Level 2, all the five control algorithms reduce TVTT sig-
88
nificantly. And statistical tests reveal no significant performance differences among ALINEA, MBTN, MSWARMI, and Zone. But the performance of MSWARMV is significantly poorer than the other four control algorithms. The TVTT savings varied from 262veh·hr(ALINEA) to 141veh·hr(MSWARMV). This correspond to 6.5% to 3.5% travel time reduction, which is higher than the reductions obtained in demands level 1 and 2. This result indicates ramp metering may be more effective under heavier traffic demand.
5.3.4
Sensitivity Analysis
To check on how much our results presented in Section 5.3.3 are affected by our choice of parameter values and demand patterns, we perform sensitivity analysis of MOEs with respect to the control parameters and traffic demand patterns. Our focus here is on ALINEA because it is used in MBTN, MSWARMI, and MSWARMV. First we investigate the performance sensitivity of ALINEA with respect to target occupancy and regulator gain. Table 5.6 shows the simulation results of ALINEA with target values 0.07, 0.10, and 0.13 while fixing regulator gain at 20,000 and using Level 2 demand. TVTT of target occupancy 0.07 is the highest as 3409 veh·hr and TVTT of target occupancy 0.10 is the lowest as 3162 veh·hr. The difference of TVTT between target occupancy 0.07and 0.10 is 247 veh·hr and the difference of TVTT between target occupancy 0.10 and 0.13 is 76 veh·hr. While statistical tests show the mean TVTTs corresponding to the three parameter values are different to each other, the performance of ALINEA is quite robust within a certain range of target occupancy (say 0.10-0.15). Similar findings were also obtained regarding the regulator gain parameter. Table 5.7 shows the simulation results of ALINEA with regulator gains 1500, 5000, 10000,20000,30000 under Level 2 demand and 0.13 target occupancy. Statistical tests show that TVTT of regulator value 1500 is lower than that of the other regulator values. But TVTT values for regulator gains 5000, 10000, 20000, and 30000 are quite close. This indicates that there is a broad range of regulator gains under which ALINEA’s performance is quite robust. Beside this range ALINEA’s performance deteriorate quickly.
Next, we check ALINEA’s performance sensitivity with respect to traffic demand patterns. Besides the demand matrix in Table 4.2 (demand pattern I), we created a new demand matrix as shown in Table 5.8 (demand pattern II). In demand pattern II, the demand from the main89
Table 5.4: TVTTs for 5 control algorithms with 10 different random seeds, (veh·hr) [Traffic Level 1] seed1 seed2 seed3 seed4 seed5 seed6 seed7 seed8 seed9 seed10 average s2
No control 2876 2744 2793 2825 2639 2799 2726 2801 2812 2761 2778 4181
ALINEA 2724 2798 2717 2701 2703 2683 2713 2693 2719 2710 2716 984
MBTN 2735 2781 2753 2777 2759 2746 2719 2695 2631 2731 2733 1948
MSWARMI 2691 2780 2695 2720 2661 2668 2739 2697 2721 2690 2706 1219
MSWARMV 2766 2721 2722 2760 2776 2743 2803 2893 2850 2737 2777 3198
Zone 2720 2746 2701 2712 2736 2641 2742 2763 2676 2722 2716 1300
MSWARMV 3138 3372 3219 3411 3218 3182 3172 3228 3348 3247 3254 8446
Zone 3126 3199 3168 3177 3130 3216 3250 3223 3125 3153 3177 1958
MSWARMV 3899 3908 3937 3885 3906 3955 3882 4031 3796 3776 3897 5370
Zone 3706 3690 3672 3981 3796 3752 3705 3944 3740 3808 3779 11287
[Traffic Level 2] seed1 seed2 seed3 seed4 seed5 seed6 seed7 seed8 seed9 seed10 average s2
No control 3255 3398 3364 3472 3392 3324 3330 3362 3176 3334 3341 6562
ALINEA 3320 3306 3157 3346 3182 3151 3206 3240 3307 3175 3239 5558
MBTN 3103 3121 3118 3096 3139 3089 3247 3343 3148 3285 3169 8016
MSWARMI 3225 3246 3315 3262 3212 3114 3172 3214 3339 3214 3231 4227
[Traffic Level 3] seed1 seed2 seed3 seed4 seed5 seed6 seed7 seed8 seed9 seed10 average s2
No control 4062 4149 3888 4064 4091 4078 3993 4053 4059 3946 4038 5737
ALINEA 3789 3758 3846 3560 3813 3809 3790 3732 3769 3894 3776 7845
MBTN 3637 3911 3736 3635 3876 3895 3769 3875 3761 3836 3793 10437
90
MSWARMI 3745 3795 3805 3545 3792 3780 3732 3776 3872 3936 3778 10280
Table 5.5: t-values and degrees of freedom [Traffic Level 1]
No control ALINEA MBTN MSWARMI MSWARMV Zone
No control • 2.71(13) 1.81(16) 3.05(14) 0.02(18) 2.64(14)
ALINEA 2.71(13) • 0.97(16) 0.63(18) 2.98(14) 0.01(18)
MBTN 1.81(16) 0.97(16) • 1.45(17) 1.96(17) 0.93(17)
MSWARMI 3.05(14) 0.63(18) 1.45(17) • 3.34(15) 0.57(18)
MSWARMV 0.02(18) 2.98(14) 1.96(17) 3.34(15) • 2.89(15)
Zone 2.64(14) 0.01(18) 0.93(17) 0.57(18) 2.89(15) •
MSWARMV 2.25(18) 0.39(17) 2.09(18) 0.62(16) • 2.38(13)
Zone 5.62(14) 2.27(15) 0.25(13) 2.20(16) 2.38(13) •
MSWARMV 4.22(18) 3.34(17) 2.63(16) 3.03(16) • 0.03(18)
Zone 6.27(16) 0.08(17) 0.29(18) 0.03(18) 0.03(18) •
[Traffic Level 2]
No control ALINEA MBTN MSWARMI MSWARMV Zone
No control • 2.92(18) 4.50(18) 3.33(17) 2.25(18) 5.62(14)
ALINEA 2.92(18) • 1.90(17) 0.25(18) 0.39(17) 2.27(15)
MBTN 4.50(18) 1.90(17) • 1.78(16) 2.09(18) 0.25(13)
MSWARMI 3.33(17) 0.25(18) 1.78(16) • 0.62(16) 2.20(16)
[Traffic Level 3]
No control ALINEA MBTN MSWARMI MSWARMV Zone
No control • 7.12(18) 6.10(17) 6.51(17) 4.22(18) 6.27(16)
ALINEA 7.12(18) • 0.40(18) 0.04(18) 3.34(17) 0.08(17)
MBTN 6.10(17) 0.40(18) • 0.34(18) 2.63(16) 0.29(18)
91
MSWARMI 6.51(17) 0.04(18) 0.34(18) • 3.03(16) 0.03(18)
Table 5.6: TVTTs and t-values for different target occupancy values, ALINEA with demand level 2,(veh·hr)
seed1 seed2 seed3 seed4 seed5 seed6 seed7 seed8 seed9 seed10 average s2
0.07 0.10 0.13
0.07 3414 3403 3421 3351 3467 3347 3399 3448 3419 3422 3409 1407
0.07 • 11.4(15) 6.4(13)
0.10 3049 3210 3146 3130 3161 3133 3223 3238 3128 3198 3162 3238
0.10 11.4(15) • 2.5(16)
0.13 3319 3305 3156 3345 3182 3150 3206 3240 3307 3174 3238 5554
0.13 6.4(13) 2.5(16) •
line is the same as in demand pattern I, but more vehicles exit and enter at Jamboree, Culver, Jeffrey, and Sand Canyon. The logic behind this demand scenario is that congestion, when it spreads upstream from a bottleneck, can trap vehicles that wish to exit before the bottleneck. By metering one can reduce the blockage of those upstream exits, allowing higher outputs from the freeway system that in turn reduces system travel time. Table 5.9 shows the results corresponding to this travel demand pattern. The TVTT values for ALINEA control under levels 1 , 2, and 3 of demand pattern II are respectively 94.3%, 95.1%, and 93.7% of those without ramp control. The corresponding values for demand pattern I are 98.1%, 96.9%, 93.5%, respectively. ALINEA performs better in lightly congested traffic under demand pattern II. When traffic congestion becomes heavier, ALINEA’s performance is not much affected by differences in demand patterns.
92
Table 5.7: TVTTs and t-values for different regulator values, ALINEA with demand level 2,(veh·hr)
seed1 seed2 seed3 seed4 seed5 seed6 seed7 seed8 seed9 seed10 average s2
1500 5000 10000 20000 30000
1500 3373 3429 3256 3444 3302 3293 3274 3265 3188 3472 3329 8884
1500 • 2.61(13) 4.11(13) 2.40(17) 2.88(18)
5000 3233 3289 3234 3301 3308 3221 3180 3219 3206 3251 3244 1814
5000 2.61(13) • 2.57(18) 0.21(14) 1.07(12)
10000 3181 3149 3193 3235 3208 3232 3183 3157 3130 3274 3194 1944
10000 4.11(13) 2.57(18) • 1.61(15) 0.43(13)
93
20000 3319 3305 3156 3345 3182 3150 3206 3240 3307 3174 3238 5554
30000 3396 3304 3163 3076 3259 3153 3171 3237 3223 3105 3208 9186
20000 2.40(17) 0.21(14) 1.61(15) • 0.77(17)
30000 2.88(18) 1.07(12) 0.43(13) 0.77(17) •
14
15 16
300
12
1080
932
0
300
600
10
485 620
1042
460
0
8
6
320 700
13
720
1022
4
250
5 460
11
965
555
350
105
90
220 500
255
240
106
40
9 7
460
1027 0 220 500
5
956 50 0
1 2
3
Figure 5.5: Zones and traffic demand (demand pattern II)
zone 1 2 3 4 5 6 7 8 9 10 11 12 13 14 15 16 Total
1 0 0 0 0 0 0 0 0 0 0 0 0 0 0 0 0 0
2 0 0 50 240 220 220 0 550 840 400 700 460 600 1080 0 4200 9560
3 300 0 0 20 0 0 0 0 0 0 0 0 0 0 0 500 820
4 72 0 20 0 0 0 0 0 0 0 0 0 0 0 0 500 592
5 70 0 0 0 0 400 0 5 10 10 15 10 10 0 0 400 930
Table 5.8: Travel demand matrix 6 100 0 0 0 600 0 0 0 10 10 5 15 10 0 0 300 1050
7 100 0 0 0 0 0 0 20 0 0 0 0 0 0 0 250 270
8 100 0 0 0 0 0 20 0 5 0 0 0 0 0 0 250 275
94
9 600 0 0 0 0 0 0 0 0 40 0 0 0 0 0 460 1000
10 600 0 0 0 0 0 0 0 0 0 0 0 0 0 0 460 960
11 380 0 0 0 0 0 0 0 0 0 0 40 0 0 0 700 1020
12 380 0 0 0 10 0 0 0 0 0 40 0 0 0 0 700 1030
13 300 0 0 0 0 0 0 0 0 0 0 0 0 40 0 300 640
14 35 0 0 0 0 0 0 0 0 0 0 0 30 0 0 300 365
15 4000 0 900 960 830 830 0 940 60 360 360 480 720 450 0 0 10890
16 0 0 0 0 0 0 0 0 0 0 0 0 0 0 0 0 0
total 7037 0 970 1220 1660 1450 20 1315 925 620 1020 905 1370 1570 0 9320 29402
Table 5.9: TVTTs for No control and ALINEA, demand pattern II (veh*hr) [Traffic Level 1]
seed1 seed2 seed3 seed4 seed5 seed6 seed7 seed8 seed9 seed10 average s2
No control 2926 2956 2803 2950 2927 2943 2954 2966 2904 2999 2933 2736
ALINEA 2702 2768 2759 2776 2703 2822 2778 2850 2727 2779 2766 2249
[Traffic Level 2]
seed1 seed2 seed3 seed4 seed5 seed6 seed7 seed8 seed9 seed10 average s2
No control 3608 3567 3367 3372 3352 3379 3414 3531 3556 3450 3460 9382
ALINEA 3304 3311 3280 3333 3200 3204 3406 3346 3162 3362 3291 6248
[Traffic Level 3]
seed1 seed2 seed3 seed4 seed5 seed6 seed7 seed8 seed9 seed10 average s2
No control 4371 4085 4188 4186 4053 4074 4207 4331 4350 4073 4192 95 15051
ALINEA 4034 3885 3896 4010 3893 3977 3983 3869 3935 3817 3930 4811
Chapter 6
Conclusions Over the years, many ramp metering algorithms have been proposed and some of them are already in operation in the field. We have in this report reviewed a sample of these algorithms that we consider to be representative. Prior to our review, we developed a classification scheme and a set of evaluation criteria to aid the categorization and qualitative assessment of the selected metering algorithms. Based on these criteria, ALINEA, Bottleneck, SWARM, and Zone algorithms were selected for further evaluation using a microscopic traffic flow simulation program, Paramics. These four metering algorithms were successfully implemented in Paramics and a systematic evaluation of their performances under different traffic conditions and control settings were conducted. The results of this study produced some insights on the choice and field implementation of ramp metering algorithms. This chapter summarizes the major findings of this study, discusses the lessons learned about using microscopic traffic simulation to evaluate ramp metering algorithms, and gives some suggestions for future ramp metering work.
6.1
Findings Regarding the Performance of Ramp Metering
Using the total vehicle travel time (TVTT) as the measurement of effectiveness (MOE) and Paramics as the simulation platform, our evaluation study finds that • regardless of the type of ramp metering algorithm, travel demand load and pattern, ramp metering reduces the total vehicle travel time compared with no metering. The total vehicle travel time reduction can be as high as 7%. The effectiveness of the ramp control algorithms also depends on the level of traffic demand. As traffic demand increases, ramp metering tends to be more effective in reducing system travel time;
96
• no significant performance differences exist among ALINEA, modified Bottleneck, modified SWARM with 1 time-step-ahead prediction, and Zone algorithms under the tested scenarios; • modified SWARM with five-step-ahead prediction has the poorest performance among all tested algorithms, although SWARM with one-step prediction performs equally well as other tested algorithms. The primary reason is that five-step-ahead prediction is less accurate than one-step prediction. This indicates good traffic prediction is a key to SWARM’s performance; • well tuned parameters are critical for good ramp metering performance. Coordinated ramp metering algorithms employ more complicated control logic and more parameters. On paper they should be more effective than local algorithms. However, these algorithms are also more difficult to calibrate. For example, the weights used in SWARM, Bottleneck and Zone should be calibrated with real-time O-D information, but such information is rarely available. As a result, coordinated ramp metering algorithms do not necessarily perform better than local control algorithms if some of their key parameters are not well calibrated. And this is confirmed by our simulation results. The simplest ramp metering algorithm, ALINEA, performs as well as the more complex algorithms (we suspect that SWARM, Bottleneck and Zone may outperform ALINEA if their weighting matrices are adjusted in real time according accurate O-D information). • Ramp metering performance and parameter values such as critical occupancy and regulator gain are non-linearly related. There is a broad range of parameter values over which ramp metering performance does not change significantly. Outside of this range, however, ramp metering performance deteriorates quickly. • Ramp metering seems to be more effective under certain demand patterns than others. An important qualification needs to be added to these findings. That is, the traffic system we considered consists of a freeway and its ramps only. This means that each ramp has to serve its total demand, and only its demand. In a corridor setting where traffic diversions are possible, ramp metering may yield greater benefits if it is integrated with queue management, traveler information, and arterial street signal coordination. 97
Besides these key findings, this research has also developed a prototype framework for the evaluation of the ramp metering using microscopic simulation. It has demonstrated that microscopic simulation could be a very useful and reliable tool for the assessment of ramp metering algorithms. This study also revealed a number of issues to be addressed in ramp metering system design. First, a systematic procedure to calibrate complex ramp metering algorithms needs to be developed. Because the relation between system performance and ramp metering parameters is very complicated, conventional optimization tools are usually difficult to apply to this problem (for example, one usually cannot obtain relevant gradient information). Heuristic search algorithms such as genetic algorithms, tabu search or simulated annealing can be explored. Second, a proactive ramp metering algorithm requires accurate predictions of traffic conditions. It seems much effort is needed to develop a mid-range prediction model (i.e., predicting 2-5 steps ahead). Third, we know ramp metering performance is affected by traffic demand patterns. Conversely O-D demand may be also affected by ramp metering. We need to close the loop by studying ramp-metering—traffic-demand-shift interactions.
6.2
Lessons for Ramp Metering Simulation
Paramics, one of the most sophisticated commercial microscopic simulation programs in the market, has been used successfully to study ramp metering. Among the five Paramics modules, API plays a major role in implementing ramp metering algorithms into Paramics Modeller. API was used to develop all four key components of a simulated ramp metering system: 1) data collection (obtaining real time data from sensors such as detectors), 2) information management (a database for storing and processing the real time traffic data), 3) generation of ramp metering rates using a ramp metering algorithm, and 4) translation of metering rates into metering signal indications. A significant amount of effort was devoted to develop APIs that realize these functions. Although each ramp metering algorithm requires some special codes, many of the developed APIs are quite flexible and can be used with minor modifications to implement a large class of ramp metering algorithms.
Another major effort of our study concerns fine tuning of driver behavior. The car-following logic in microscopic simulations significantly affect their realism. Many key parameters used in
98
ramp metering, such as critical occupancy and capacity, depends on the car-following logic and its parameters as well as roadway geometry. To obtain realistic control parameters one must carefully calibrate the behavior model embedded in a microscopic traffic simulation program. This is no easy task considering the large number of parameters involved in a simulation model. The substitution effects between certain parameters further complicates the problem. Again, intelligent search methods such as genetic algorithms or simulated annealing may be good candidate tools to tackle this challenging problem.
Apart from the car-following logic of a simulation model, its lane changing behavior, especially in relation to entering and exiting the freeway, critically affects the simulation model’s ability to assess ramp metering. This is evident in the early versions of Paramics in which ramp merging vehicles are quite conservative in accepting gaps, generating a metering effect even under no metering (i.e., vehicles queued up on the unmetered ramp even though freeway traffic is free-flowing). Under such merging behavior ramp traffic, no matter how high its demand is, rarely causes congestion on the freeway because its merging behavior regulates the amount of traffic that can enter the freeway. This was corrected to a certain degree of success in the new beta version of Paramics that we used to perform our ramp metering study. To calibrate the parameters governing the lane change behavior in Paramics, however, remains a challenging task. So far one can only give a qualitative assessment of lane changing based on visual inspections of simulations runs at merging and diverging junctures as well as signposting locations. To this end the GUI of Paramics proves to be quite valuable.
There are other minute details that one has to pay close attention to when using microscopic simulation, such as careful coding of geometries, proper set up of controls such as signposting, and choice of random distributions that govern the stochastic characteristics of various process in a microscopic simulation, because in a microscopic simulation a minute detail may lead to significant differences in simulation outcome. The process of coding and calibrating a microscopic simulation usually consumes much of the project time, often more than one has anticipated. When one carries out a study using microscopic simulation, it is recommended that ample project time be allocated to network coding and calibration of the simulation model.
99
6.3
Remarks on Improvement and Further Directions of Research on Ramp Metering
Ramp metering improves freeway traffic flow because it 1) breaks up vehicle platoon from entrance ramps so as to reduce the chance of traffic breakdown due to merging, and 2) distributes traffic more evenly over time and space to avoid saturation pressure on bottlenecks. When the demand pressure is not high, ramp metering can completely eliminate freeway congestion with a moderate price: some delays on the metered ramps. This, however, is not always achievable when demand pressure exceeds certain thresholds. When this happens, one can either give priority to the freeway and meter the ramps as heavily as one can so as to maintain free flow on the freeway (freeway-first policy), or balance the interests of traffic on the freeway, ramps and feeder streets and meter the ramps at such a level that it improves freeway flow but also does not create long queues on ramps or gridlock on feeder streets (balanced policy).
Among the ramp metering algorithms reviewed in this report, the majority falls inbetween the two kinds of policies. That is, they usually give priority to freeway traffic but also give some consideration to traffic on entrance ramps and arterial streets when delays on entrance ramps become excessive or queues on entrance ramps are about to spill back onto feeder streets. When the sizes of queues on metered ramps become critical, it is customary for these algorithms to raise the entrance flow from ramps to a higher level till the critical queues subside. This often creates a “boom-and-bust” cycle in ramp metering: under high demand pressure, critical conditions on the freeway demand lower metering rates, which often leads to long queues at metered ramps. This makes the ramps become critical that in turn demands higher metering rates. Higher metering rates again put more demand pressure on freeway bottlenecks. The cycle goes on till demand pressure subsides to a sufficient low level.
To eliminate the “boom-and-bust” cycle, one can do a few things. The most straightforward is to monitor the queues on various ramps and adjust the metering rates gradually to prevent the queues become critical in a smooth manner. This can be done effectively when the demand pressure is moderate at most ramps and high at only a few ramps. When the demand pressure is high across board, it may no longer be feasible to maintain free flow conditions on the freeway while keeping the ramp queues under critical. Under such situations, truly system-wide adap100
tive control is called for. Such controls should have a well defined objective that balances the interests of freeway, ramp and feeder streets operations, and links the performance of the system with traffic conditions and ramp control actions. Among all reviewed algorithms, only two (Ball Aerospace and Dynamic metering control algorithm) belong to this category. Although this kind of algorithms are potentially more effective in improving overall system performance, they are also inherently more complex, therefore require a more sophisticated understanding of traffic systems for their successful implementations. As a result, no such ramp metering systems, to the best of our knowledge, have been implemented in the field. The situation can be improved if a testing facility is available to systematically test and refine such complex ramp metering systems before they are put into daily operations. In this way both system developers and operators gain experience and confidence in implementing and operating such complex systems.
We also want to emphasize the importance of accurate O-D information and predictions of traffic conditions in successful ramp metering. O-D information plays a critical role in managing ramp queues and traffic diversions to feeder streets, and the knowledge of future traffic conditions allows proactive actions be taken to prevent traffic congestion rather than cope with it after it has already occurred. Another important factor that a successful ramp metering system has to consider is the response of drivers to ramp metering in both short and long terms. This aspect is almost completely ignored by nearly all reviewed metering algorithms. Drivers’ responses to ramp metering have significant implications to both temporal and spatial distributions of demand to entrance ramps, thus play a critical role in determining metering and infrastructure expansion policies in the long range time scale.
101
Bibliography [1] J. Banks, Effect of response limitations on traffic-responsive ramp metering, TRB Record 1394, 1993. [2] K. Bogenberger and A.D. May, Advanced Coordinated Traffic Responsive Ramp Metering Strategies, Berkeley, October 1999. [3] G.L. Chang, J. Wu and S. Cohen, Integrated real-time ramp metering model for nonrecurrent congestion: framework and preliminary results, Transportation Research Record 1446, 1994. [4] W. Chase and F. Bown, General statistics, 3rd ed., John Wiley and Sons, 1996. [5] O. Chen, A. Hotz and M. Ben-Akiva, Development and evaluation of a dynamic metering control model, IFAC Transportation Systems; Chania, Greece, 1997. [6] L. Jacobsen, K. Henry and O. Mahyar, Real-time metering algorithm for centralized control, Transportation Research Record 1232, TRB, 1989. [7] L. Lipp, L. Corcoran and G. Hickman, Benefits of central computer control for the Denver ramp metering system, Transportation Research Board Record 1320, January 1991. [8] J.C. Liu, J. Kim, Y. Chen, Y. Hao, S. Lee, T. Kim and M. Thomadakis, An advanced real time metering system (ARMS): the system concept, Texas Department of Transportation Report Number 1232-24, 1993. [9] D. Meldrum and C. Taylor, Freeway traffic data prediction using artificial neural networks and development of a Fuzzy Logic Ramp Metering Algorithm, Final Technical Report, Washington State Department of Transportation Report No. WA-RD 365.1, Washington, 1995. 102
[10] G. Paesani, J. Kerr, P. Perovich and E. Khosravi, System wide adaptive ramp metering in southern California, ITS America 7th Annual Meeting, June 1997. [11] M. Papageorgiou, H. Haj-Salem and J. Bloseville, Modeling and real time control of traffic flow on the southern part of the Boulevard Peripherique in Paris: Part II: Coordinated on-ramp metering, Transportation Research, Vol. 24 A, No. 5, 1990. [12] M. Papageorgiou, H. Hadj-Salem and F. Middelham, ALINEA local ramp metering - summary of field results, Transportation Research Record 1603, TRB, 1997. [13] Quadstone Ltd., Paramics Modeller V.3.0 users guide, 2000. [14] D. Schrank and T. Lomax, The 1999 annual mobility report: information for urban America, Texas Transportation Institute, The Texas A&M University System, 1999. [15] Y. Stephanedes, Implementation of on-line Zone Control Strategies for optimal ramp metering in the Minneapolis Ring Road, 7th International Conference on Road Traffic Monitoring and Control, 1994. [16] C.H. Wei and K.Y. Wu, Applying an artificial neural network model to freeway ramp metering control, Transportation Planning Journal, Vol. 25 No. 3, 1996. [17] T. Yoshino, T. Sasaki and T. Hasegawa, The traffic control system on the Hanshin Expressway, Interfaces Magazine, Jan./Feb. 1995. [18] H. M. Zhang, S.G. Ritchie and W.W. Recker, Some general results on the optimal ramp control problem, Transpn Res. -C, Vol. 4, No.2, pp. 51-69, 1996. [19] H. M. Zhang and S.G. Ritchie, Freeway ramp metering using artificial neural networks, Transportation Research C, Vol. 5, No. 5, pp. 273-286, 1997. [20] H. M. Zhang, ARX models for congested traffic flow, working paper, 2000. [21] Report 1: Ramp metering algorithm description, Virginia Department of Transportation, undated. [22] Report 2: Mississauga FTMS system — Ramp metering algorithm, Ontario Ministry of Transportations, undated. 103
[23] Report 3: System wide adaptive ramp metering algorithm - high level design, Final Report, Prepared by NET for Caltrans and FHWA, March 1996. [24] Report 4: Ramp metering project - system functional requirements specification, Ball System Engineering Operation, Prepared for FHWA, November 1998. [25] Report 5: Ramp metering project - algorithm development, Ball System Engineering Operation, Prepared for FHWA, November 1998.
104
Appendix A
MySQL Installation Here are the main steps to install MySQL on Win2000 and NT PCs. Readers are referred to the MySQL manual at http://www.mysql.com for its installation on other operating systems. 1. Download MySQL-Win32 version of the program at http://mysql.he.net/downloads/mysql-3.23.html. The latest version as to the writing of this report is MySQL 3.23.38. 2. Open Windows Explorer. 3. Move the downloaded file into a temporary directory. 4. Double click the file to unzip it (assuming you have a zip utility program). 5. Once the files are extracted, go back to Explorer and double click on Setup.exe. 6. Follow the instructions within the installation program. For most of the times, you don’t need to change the default directory c:\mysql. 7. Delete the temporary directory c:\msdownld.tmp if it still exists. 8. Open up a MS-DOS Prompt window. 9. Switch to the c: drive if you are not already in it. For example, L:\ >c:. 10. Switch to the MySQL bin directory: C:\ >cd mysql\bin 11. Issue a dir command to determine which one of the following methods you will use to install the daemon:
105
(a) If there is a file named mysqld-nt.exe, do c:setminusmysql\bin\mysqld-nt –install (b) If there is not mysqld-nt.exe but you have a file named mysqld-shareware.exe, do c:\mysql\bin\ren mysqld-shareware.exe mysqld.exe. c:\mysql\bin\mysqld –install (c) If neither of those files is found, just do this: c:\mysql\bin\mysqld –install 12. Close the DOS Prompt window: c:\mysql\bin\exit 13. Open up the Services Manager for NT 4.0: Start Menu|Settings|Control Panel|Services for 2000: Start Menu|Programs|Administrative Tools|Services 14. Highlight the line with “MySql” on it. 15. If the “Startup” column says “Manual” or “Disabled”, click on the “Startup” button, and then hit the “Automatic” radio button and click OK. 16. Click on the Start button. 17. Close the Services Manager and the Control Panel.
106
Appendix B
Location Map of Detectors Jamboree I.C.
1
2
r1
3
4
6
5
r2 r3 r4
r5 r6 r7
107
7 8 9 10
Culver I.C.
12
11
13
14
r9 r10 r11
r8
15
16 17 18 19
r12 r13 r14
Jeffrey I.C.
21
20
r15
r16 r17 r18
22
23
24
r19 r20 r21
108
25
Sand Canyon I.C.
26 27
29
28
r23 r24 r25
r22
Freeway 113 I.C.
32 33
30 31
34
r27 r26
r28 r29
109
Irvine Center Dr. I.C.
36
35
r31 r32 r33
r30
37
38
39
40
r34 r35 r36
Table B.1: Detector name(mainline) No. 1 2 3 4 5 6 7 8 9 10 11 12 13 14 15 16 17 18 19 20
Name 405s7.38ml 405s7.01mla 405s7.01mlb ds405s7.01 405s6.80ml ds405s6.80 405s6.22mlc 405s6.22mlb 405s6.22mla 405s6.21ml 405s5.68ml ds405s5.68 405s5.50mla 405s5.50mlb ds405s5.50 405s5.01mla 405s5.01mlb 405s5.01mlc 405s4.75ml 405s4.03ml
No. of lanes 6 6 6 6 6 6 6 6 6 6 5 5 5 5 5 5 5 5 5 5
No. 21 22 23 24 25 26 27 28 29 30 31 32 33 34 35 36 37 38 39 40
110
Name ds405s4.03 405s3.84mla 405s3.84mlb ds405s3.84 405s3.31ml 405s2.88mla 405s2.88mlb ds405s2.88 405s2.35ml 405s1.73cd 405s1.73cdb 405s1.57cd 405s1.57ml ds405s1.01 405s0.96ml ds405s0.96 405s0.77mla 405s0.77mlb ds405s0.74 405s0.6ml
No.of Lanes 5 5 5 5 5 5 5 5 5 5 5 5 5 5 5 6 6 6 6 6
Table B.2: Detector names (ramp) No. r1 r2 r3 r4 r5 r6 r7 r8 r9 r10 r11 r12 r13 r14 r15 r16 r17 r18 r19 r20
Name 405s7.14fr 405s7.01ora 405s7.01orb ds405s7.orc 405s6.80ora 406s6.80orb 405s6.80orc 405s5.83fr 405s5.68ora 405s5.68orb 405s5.68orc 405s5.50ora 405s5.50orb 405s5.50orc 405s4.03fr 405s4.03ora 405s4.03orb 405s4.03orc 405s3.84ora 405s3.84orb
No. of lanes 2 2 2 2 2 2 2 2 1 1 1 2 2 2 1 1 1 1 2 2
No. r21 r22 r23 r24 r25 r26 r27 r28 r29 r30 r31 r32 r33 r34 r35 r36
111
Name 405s3.84orc 405s2.88fr 405s2.88ora 405s2.88orb 405s2.88orc 405s1.10fr 405s1.57ffn-sa 405s1.57ffn-sb 405s1.57ffn-sc 405s0.96fr 405s0.96.ora 405s0.96.orb 405s0.96.orc 405s0.77ora 405s0.77orb 405s0.77orc
No.of Lanes 2 2 2 2 2 1 1 1 1 2 1 1 1 1 1 1
Appendix C
Bottleneck Algorithm Section Definition section critical occupancy upstream mainline loop name downstream mainline loop name number of on ramp loop defined on ramp loops number of off ramp loop defined off ramp loops section critical occupancy upstream mainline loop name downstream mainline loop name number of on ramp loop defined on ramp loops number of off ramp loop defined off ramp loops section critical occupancy upstream mainline loop name downstream mainline loop name number of on ramp loop defined on ramp loops number of off ramp loop defined off ramp loops
112
1 0.18 405s7.38ml 405s6.21ml 2 405s7.01ora, 405s6.80ora 1 405s7.14fr 2 0.18 405s6.21ml 405s5.01mlc 2 405s5.68ora, 405s5.50ora 1 405s5.83fr 3 0.18 405s5.01mlc 405s3.31ml 2 405s4.03ora, 405s3.84ora 1 405s4.03fr
section critical occupancy upstream mainline loop name downstream mainline loop name number of on ramp loop defined on ramp loops number of off ramp loop defined off ramp loops section critical occupancy upstream mainline loop name downstream mainline loop name number of on ramp loop defined on ramp loops number of off ramp loop defined off ramp loops section critical occupancy upstream mainline loop name downstream mainline loop name number of on ramp loop defined on ramp loops number of off ramp loop defined off ramp loops
113
4 0.18 405s3.31ml 405s2.35ml 1 405s2.88ora 1 405s2.88fr 5 0.18 405s2.35ml ds405s1.01 1 405s1.57ffn-sa 1 405s1.10fr 6 0.18 ds405s1.01 405s0.6ml 2 405s0.96ora, 405s0.77ora 1 405s0.96fr