University of California, in cooperation with the State of California Business, ... 1 In freeway sections with good quality detectors spaced at most one-half mile ...
CALIFORNIA PATH PROGRAM INSTITUTE OF TRANSPORTATION STUDIES UNIVERSITY OF CALIFORNIA, BERKELEY
Evaluation of PeMS to Improve the Congestion Monitoring Program Jaimyoung Kwon, Bill McCullough, Karl Petty, Pravin Varaiya California PATH Research Report
UCB-ITS-PRR-2007-6
This work was performed as part of the California PATH Program of the University of California, in cooperation with the State of California Business, Transportation, and Housing Agency, Department of Transportation, and the United States Department of Transportation, Federal Highway Administration. The contents of this report reflect the views of the authors who are responsible for the facts and the accuracy of the data presented herein. The contents do not necessarily reflect the official views or policies of the State of California. This report does not constitute a standard, specification, or regulation. Final Report for Task Order 5319
June 2007 ISSN 1055-1425
CALIFORNIA PARTNERS FOR ADVANCED TRANSIT AND HIGHWAYS
Evaluation of PeMS to improve the Congestion Monitoring program: Final Report for PATH TO 5319 Jaimyoung Kwon, Cal State University, East Bay Bill McCullough, System Metrics Group Karl Petty, Berkeley Transportation Systems Pravin Varaiya, University of California, Berkeley (PI) August 1, 2006
Abstract The highway congestion monitoring program (HICOMP) report is based on data from tach vehicle runs or PeMS. Research under TO 5319 compares the accuracy and cost of these two alternatives. The detailed studies described in the report lead to the following conclusions and suggestions for follow-on work: 1
In freeway sections with good quality detectors spaced at most one-half mile apart, PeMSbased estimates of the magnitude, extent and duration of congestion are incomparably more accurate than those based on tach vehicle runs.
2
Because at most four days of tach run data are used to estimate the annual congestion over a freeway segment, the error in these estimates is on the order of 25 percent. (With only one day of tach runs, which is typical, the error is 50 percent.) The error in year to year comparisons is on the order of 35 percent, and so one can have no confidence in such comparisons published in the HICOMP report.
3
Because the location and number of detectors within a district varies significantly from year to year and the quality of the loop detector data is uneven, it is hazardous to use PeMS-based congestion estimates to make inter-district or year to year comparisons. However, careful analyses using PeMS data can yield valid comparisons.
4
PeMS data collection costs a fraction of tach-vehicle runs that yield estimates with similar accuracy. It would be more beneficial to divert resources from tach runs into improving the detection system.
5
PeMS estimates the components of recurrent and non-recurrent congestion; congestion ‘hotspots’; and travel time reliability. Inclusion of these estimates will make HICOMP reports much more useful.
6
An outline of a standardized congestion reporting protocol is offered. It takes into account the errors introduced from too few tach runs, loop detectors with large spacing or poor quality. It suggests a transition plan to move towards a PeMS-based report.
Keywords: Highway congestion report, HICOMP, tach vehicle runs, detector spacing, cost/benefit comparison, congestion report protocol
Abstract ............................................................................................................................................1 Executive summary..........................................................................................................................3 District practices ......................................................................................................................... 3 Comparing congestion using PeMS and tach vehicle data ......................................................... 4 Impact on accuracy of number of tach vehicle runs and detector spacing ................................. 4 Travel time comparison....................................................................................................................5 Cost of tach runs vs. PeMS ......................................................................................................... 6 A standardized reporting protocol .............................................................................................. 6 1 District practices ...........................................................................................................................8 1.1 Data collection ...................................................................................................................... 8 1.2 Data processing..................................................................................................................... 8 1.3 Consequence of different practices....................................................................................... 9 2 Selection of study sites................................................................................................................11 4.1 Errors in tach-based estimates ............................................................................................ 18 4.2 Errors in PeMS-based estimates ......................................................................................... 22 Aggregation error...................................................................................................................... 27 4.3 Error characteristics of tach-run based and PeMS-based congestion monitoring ............. 30 Effect of detector density .......................................................................................................... 30 Use of the empirical error curves.............................................................................................. 30 5 Cost comparison..........................................................................................................................33 5.1 Tach vehicle cost................................................................................................................. 33 5.2 Detection cost...................................................................................................................... 33 6 Proposal for PeMS-based congestion reporting protocol ...........................................................34 Acknowledgements........................................................................................................................43 References......................................................................................................................................44 Appendix 1: Caltrans District Practices.........................................................................................45 Appendix 2 HICOMP Interim Detector Analysis Database Documentation ................................65 Appendix 3 Available tach vehicle data ........................................................................................73
2
Executive summary The highway congestion monitoring program (HICOMP) report is based on data from tach vehicle runs or PeMS. Research under TO 5319 compares the accuracy and cost of these two alternatives. The detailed studies described in the report lead to the following conclusions: 1
In freeway sections with good quality detectors spaced at most one-half mile apart, PeMSbased estimates of the magnitude, extent and duration of congestion are incomparably more accurate than those based on tach vehicle runs.
2
Because at most four days of tach run data are used to estimate the annual congestion over a freeway segment, the error in these estimates is on the order of 25 percent. (With only one day of tach runs, which is typical, the error is 50 percent.) The error in year to year comparisons is on the order of 35 percent, and so one can have no confidence in such comparisons published in the HICOMP report.
3
Because the location and number of detectors within a district varies significantly from year to year and the quality of the loop detector data is uneven, it is hazardous to use PeMS-based congestion estimates to make inter-district or year to year comparisons. However, careful analyses using PeMS data can yield valid comparisons.
4
PeMS data collection costs a fraction of tach-vehicle runs that yield estimates with similar accuracy. It would be more beneficial to divert resources from tach runs into improving the detection system.
5
PeMS estimates the components of recurrent and non-recurrent congestion; congestion ‘hotspots’; and travel time reliability. Inclusion of these estimates will make HICOMP reports much more useful.
6
An outline of a standardized congestion reporting protocol is offered. It takes into account the errors introduced from too few tach runs, loop detectors with large spacing or poor quality. It suggests a transition plan to move towards a PeMS-based report.
We now summarize the detailed studies described in the main body of the report. District practices Although districts follow broadly similar data collection and processing practices, differences in details are very large. Districts 3, 4, 5, 6 and 10 only use tach data; Districts 7, 8, 11 and 12 also use PeMS data. Districts 3,4 and 10 are beginning to use PeMS. Use of PeMS data is increasing. Inter-district differences in processing tach vehicle data are systematic (e.g. generally, districts assume a flow of 2000 vehicles per hour per lane or vphpl, but District 4 assumes 2200 vphpl); idiosyncratic (e.g. some tach runs are spaced 30 min apart, others are 15 min apart; some districts operate tach vehicles in spring and fall, some only in the fall; some operate the vehicles for two days, some for one day); and random (e.g. the choice of monitored freeway segments). Where they are used, PeMS data, too, are processed in two different ways. Differences in data collection and data processing lead to large differences in congestion estimates and make inter-district comparison meaningless. Tach-based estimates for a single district for a single year are so inaccurate as to make it statistically invalid to make year by year comparison of congestion in the same freeway, same district or statewide. 3
PeMS v.6.3 directly estimates the magnitude, extent, and duration of congestion—the three main elements of the HICOMP report. Since a uniform procedure underlies these estimates, their use appears to permit valid inter-year and inter-district comparison. However, the configuration of the detector system (the number and locations of the detectors) varies significantly from year to year and loop data are of uneven quality. As a result, it is hazardous to make inter-year or interdistrict congestion comparisons. But analysis that takes into account the quality of the underlying data can permit valid comparisons. Comparing congestion using PeMS and tach vehicle data For some freeway segment-days we have both tach and PeMS data. There is qualitative agreement in the congestion measures based on the two data sets, e.g. there is a large, positive correlation between PeMS reported speeds and tach vehicle speeds. But there is disagreement over the quantitative estimates, due to differences in the procedures used to calculate them. A tach run is first processed to estimate the extent and duration of congestion experienced during the run. These estimates are then converted into total delay using the formula
(Vehicles Affected per Hour ) × (Extent ) × (Duration ) × ⎡⎢
1 1 ⎤ ⎥, ⎣ (Congested Speed ) 35mph ⎦
in which ‘vehicles affected per hour’ is a nominal number (typically, 2000 or 2200 vplph), and ‘congested speed’ is the average tach vehicle speed. PeMS uses a similar formula but with one major difference: it uses individual lane speed and the actual volume in each lane. Since volume drops to 1400 vphpl on average during congestion, taking it as 2000 vphpl (as tach-based estimates do) will overestimate congestion by 40 percent! Tach-based estimates will also be unreliable for freeway segments in which speeds in different lanes vary significantly. Impact on accuracy of number of tach vehicle runs and detector spacing The HICOMP report publishes the magnitude of delay (veh-hrs), extent (lane-miles) and duration (hrs) of recurrent congestion for a typical weekday commute. Since congestion varies randomly from one day to the next, we take ‘typical’ weekday to mean that the report estimates the average value of magnitude, extent and duration over the 260 weekdays in the year. We calculate the errors in tach- and PeMS-based estimates of daily peak period delay on four segments. For weekday j denote the delay on one of these segments by D(j), j = 1, 2, …, 260. The average D and the standard deviation σ of the daily delay are
D=
1 ∑ D( j ), 260 j
σ=
1 260
[∑ ( D( j ) − D) ]
2 1/ 2
.
Suppose tach vehicles are operated on n of the 260 weekdays in the year. (Typically n is between 1 and 4.) Then D is estimated by the empirical average Dn of the delay encountered over the n days. Dn will be different from D. The standard deviation of the error | D − Dn | in 1 σ. the estimate is σ n ≈ n
4
For the 51N segment PM peak period for 2002, D = 1116 veh-hrs and σ = 640 veh-hrs. If districts operate tach vehicles once per year (n = 1), the error in the estimate will be σ 1 = σ . Thus if n = 1, there is a 32 percent probability that the error in the estimate of daily statewide PM delay exceeds 640 veh-hrs. (This is a percent error of 640/1116 or 57%!) If n = 4, there is a 32 percent probability that the error exceeds σ 4 = σ / 2 = 320 veh-hrs or 28 percent.1 The large error in tach-based estimates is due to the small number (out of 260) of weekdays tach vehicles are operated. PeMS-based estimates don’t suffer from this error, as PeMS collects data every day. PeMS-based estimates have errors because the detectors only measure traffic at certain locations. The error will grow with inter-detector spacing. From a detailed study of four freeway segments, we find that detectors should be spaced less than 0.5 miles apart to keep the error below 10 percent. PeMS-based estimates have errors also because of changes in detector configuration and errors in measurement. These errors could be reduced by careful analysis. Travel time comparison The HICOMP report relies on travel times experienced by individual probe vehicles driving in a particular lane for a few days. There is general agreement between the travel times measured from the probe vehicles and the travel times computed from the detectors in PeMS. PeMS calculates the travel times for a route by ‘walking the speed matrix.’ Each route is made up of a number of individual segments with a single detector in each segment. PeMS starts at time T0 and uses the speed at time T0 to compute the time to cross the first segment, say t1. It then uses the speed measured at the second segment at time T0 + t1 to compute the time to cross the second segment. It continues in this manner for the entire route.
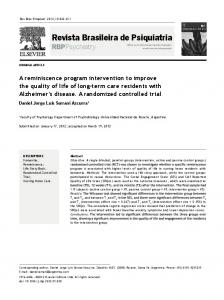
Figure 1 shows a travel time comparison between PeMS and the probe vehicles for 91-E in D12. We show the individual travel times for each lane as well as the individual travel time points from the probe vehicles. The probe drivers are typically told to drive in lane 2, but they are also told to drive with the traffic. In this situation it appears that they were driving at speeds in lane 3. Figure 1 raises another concern with the current HICOMP approach—the variation in speeds across lanes. We can see that the difference in travel time between the fastest and slowest lanes between 5pm and 6pm is approximately 20 minutes. With a single probe vehicle per run it is not possible to capture this variation. Since the current HICOMP approach implicitly assumes that the travel time in all lanes is the same, it can lead to large errors even for a single day.
1
Even with n = 4, there is a 5 percent probability that the error exceeds 640 veh-hrs.
5
Figure 1. Travel times from PeMS and Probes.
Cost of tach runs vs. PeMS
Based on analysis of data for District 8, the cost of monitoring a 10-mile freeway segment for one peak period for four days per year (two days each in fall and spring) is $10,560. The estimate includes labor and operating cost, but excludes vehicle depreciation. Based on 2004 TMS inventory costs, the annualized cost (including capital and O&M costs) of a 10-mile, four-lane urban freeway segment with 0.5 mile detector spacing is $126,400.2 If we assign as much as 25 percent of this cost or $31,600 to congestion monitoring (and the rest to other functions of freeway operations such as ATMS and ATIS), the cost is comparable to that of tach runs.3 To obtain congestion estimates with accuracy similar to that of PeMS-based estimates, one would need tach runs on 100 days each year, at a cost of $250,000 for a 10-mile segment. The detection system would provide much more accurate estimates as well as much other useful information. Clearly, tach vehicle runs should not be used to accurately measure congestion. A standardized reporting protocol
The study proposes a standardized congestion monitoring protocol that can be implemented across districts to document congestion. A short-term and a long-term transition plan are outlined. The short-term plan offers criteria to determine the segments for which PeMS data can 2
This is likely to be an overestimate according to John Wolf. Besides, new sensing technologies provide more accurate detection systems than loop-based systems at one-sixth the cost. 3 The allocation of 25 percent of the detector cost to congestion monitoring is arbitrary, but some allocation formula is needed to compare with the cost of tach runs.
6
be used and measures to overcome the discontinuities in the congestion estimates that will inevitably result when comparing a previous year’s tach-based estimates with current year’s PeMS-based estimates. The long-term transition plan provides criteria for extending detector coverage to segments where such coverage will be most useful in preparing the congestion report.
7
1 District practices Each District is responsible for the congestion monitoring results that appear in the statewide HICOMP report. District practices differ in the data they collect and how they process the data. Appendix 1 fully documents these practices. 1.1 Data collection
Districts use two data collection methods. The most common method consists in driving probe vehicles equipped with tachometers (tach vehicles) at regular intervals along congested freeway segments during typical weekday commute periods. The second method relies on automatically collected data from fixed sensors located along freeways. These data are available from PeMS [1]. Districts use one of three devices to collect tachometer data (Appendix 1, Exhibit 7). Most use Congest/CLOG , a PC-based software developed in the mid-1980s by Caltrans. PC Travel from Jamar Technologies, Inc. is used by District 5. Moving Vehicle Run Analysis Package (MVRAP), developed by the University of Florida Transportation Research Center, is used by District 7. District 4’s Congestion Monitoring Procedures and Guidelines provides general guidelines. Data collection season is typically during the spring and fall, avoiding days adjacent to major holidays. Two days of data collection should be performed during each season, and only “typical” recurrent congested days should be sampled. These guidelines are sometimes sacrificed because of the cost involved. Often only one day in the fall is sampled. The freeway segments are selected on the basis of past practice and intuition. There appears to be no systematic procedure to ensure that all congested freeway segments are covered. A selected segment should be long enough to bracket the congestion and short enough so that repeated runs can be made. The headway between runs should be 15 minutes. Cost considerations restrict adherence to these precepts, and districts frequently use 30 min headways. Drivers are cautioned to “float” with the traffic in order to collect typical trajectories. This is usually interpreted to mean staying in the middle lane, which will lead to erroneous estimates if inter-lane speeds vary considerably. Other sources of error are poorly calibrated vehicles and incorrect time synchronization. Automatic data collection methods use PeMS to extract 5-minute speed and volume. PeMS receives and stores data from 21,000 loop detectors grouped in 8,500 vehicle detector stations, covering 3,000 (out of a total of 30,000) direction-miles of freeway. 1.2 Data processing
The HICOMP report publishes recurrent congestion on urban area freeways for typical weekday commute periods. The report defines recurrent congestion as a “condition lasting for 15 minutes or longer where travel demand exceeds freeway design capacity and vehicular speeds are 35 miles per hour (mph) or less during peak commute periods on a typical incident-free weekday.” HICOMP reports three primary parameters: extent, duration and magnitude of congestion. The HICOMP report discusses the magnitude and extent of congestion in detail, and includes maps that show the location and duration of congestion.
8
Each district follows its own procedure to estimate the congestion parameters. Tach runs are first processed to estimate the duration and extent of congestion. The magnitude of delay is in principle then derived using the formula 1 1 ⎤ ⎥. ⎣ (Congested Speed ) 35mph ⎦
(Vehicles Affected per Hour )× (Extent )× (Duration )× ⎡⎢ However, the application of this formula varies a lot.
District 3’s approach is summarized in Appendix 1, Exhibit 8. The total delay is ultimately calculated using the formula, [Lanes] × [2,000 vphpl] × [Time between runs] × [Average delay between runs]. District 4’s approach differs in three ways (Appendix 1, Exhibits 9,10). First, it uses 2,200 vphpl as the hourly lane volume. Second, it uses a graphical procedure to calculate congestion. Third, instead of the 35 mph reference speed, it uses a “baseline” travel time approach, which takes the speed profile plot for the most congested run of the time period and estimates the travel time for that run as if the tachometer vehicle were traveling at free-flow on the uncongested portions of the segment and at 35mph during the congested segments. District 12’s approach assumes that the delay recorded by the tach vehicle during any 20-minute time slot (Appendix 1, Exhibit 11) is constant for all vehicles traveling during that time slot. Districts 5,6,8,11 use yet another approach (Appendix 1, Exhibit 12). Total delay for a segment is calculated by averaging over all tach vehicle delays and multiplied by the nominal ‘vehicles affected per hour’. Automatically collected detector data are processed in two ways. The “legacy” or “District 7” approach mimics the tach-based approach by having the analyst select two ‘typical’ days whose data are processed. The “interim” approach uses the standard deviation to select two typical days. See Appendix 1, Exhibits 14, 15. The “interim” approach is fully documented in Appendix 2. 1.3 Consequence of different practices
Systematic differences in practice make it meaningless to compare congestion estimates across districts. A district that uses a nominal 2,200 vphpl will, all other things being equal, give 10 percent greater congestion than one that uses 2,000 vphpl for ‘vehicles affected per hour’. PeMS uses actual volumes to estimate congestion, which, during congestion, may be as low as 1,400 vphpl, leading to an estimate of delay that is 40 percent lower. Some districts space tach vehicles 30 min apart while others maintain a 15 min headway; some take tach runs for one day, others sample four days. These idiosyncratic differences cast additional doubt on inter-district or inter-year congestion comparisons. Tach vehicle runs are confined to the AM and PM peaks, which in 2005 accounted for 64 percent of statewide congestion delay, so off-peak periods and weekends account for a significant 36 percent. (These proportions are estimated by PeMS.) Since detectors work continuously, they provide congestion estimates for these periods as well, giving a more complete picture of congestion.
9
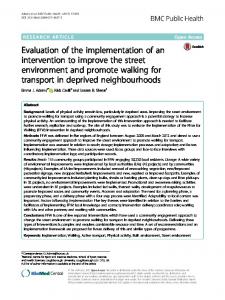
Lastly, the random nature of congestion makes tach-based estimates virtually useless. Figure 1 is a scatter plot of veh-hrs of delay (VHD) vs. veh-miles traveled (VMT) on weekdays during the PM peak period (3-7PM) in 2005. The significant feature to observe is that over the year VHD varies by 300 percent from a low of 150,000 to a high of 500,000, while VMT varies only by 10 percent between 58 and 64 million. This 300 percent variation in the delay implies that one cannot meaningfully estimate the average delay from data obtained from one to four days of tach runs. 600 500
VHD(000)
400 300 200 100 0 40000
45000
50000
55000
60000
65000
70000
VMT(000)
Figure 2 Statewide VHD vs. VMT during weekday PM peak, 2005. Source: [1] PeMS-based estimates also have errors, because the number and locations of loops that comprise the detector system change frequently and because the quality of loop data is uneven. This makes it hazardous to use PeMS data to make inter-district or year to year comparisons, unless the analyst takes into account these features of the data.
10
2 Selection of study sites Appendix 3 lists the available tach runs. The entries highlighted in green in the Appendix and summarized in Table 1 are for segments that have several tach runs on congested days.
Table 1 Congested segments with good tach run data The table lists: number of tach runs, number of loops on the segment, number of loops per mile (Nloops_Std), and number of loops per mile for which PeMS has good observations (Pts_Observed_std) or good + imputed observations (Pts_Obs_Mix_std).4 Four promising sites were selected as indicated in the second to last column. These are sites for which we have tach runs and good PeMS data for the same day. Table 2 gives details of these sites. Fwy
Seg. length Gooddays
Run.bpm
Run.epm
Run.start
Run.ends
Run.date
D03 51N
6.738
241
0.76
8. 44
P St ON
Rte 244 Off
2002-11-6
D12 91E
9.891
261
11.49
19.79
D12 5N
13.587
261
21.30
30.26
Green River 2004-12-9 OFF 5/55 Sep Brdg 2002-11-5
D12 55N
11.547
261
3.09
13.55
ON from EB Imperial 5/405 Sep Brdg NB ON FR 22st
Chapman OFF 2002-10-29
Table 2 The four study sites In Table 2 Run.bpm and Run.epm are the run begin and end postmiles; Run.start and Run.ends are the associated landmarks; Seg.length is the length of the segment in miles; and Gooddays is the number of weekdays for which good PeMS data are available. 4
Caltrans’ detector data vary in quality. PeMS replaces missing or incorrect detector measurements with imputed values. The analyst must ensure that the quality of PeMS data being used is adequate for the purpose.
11
3 Comparison of tach- and PeMS-based congestion measures We compare tach runs with PeMS data for the four sites in Table 2.
Figure 3 Tach runs on 11/06/02 on 51N (left) and PeMS average speed contour plot (right).
Figure 4 Tach runs superimposed on PeMS contour plot 12
Figure 3 (left) shows the 14 tach runs along a 7.68-mile segment of 51N during the PM peak period. The runs are color coded to indicate speed. On the right in Figure 3 is the speed contour plot for the 17-hour period for the same segment. The black rectangle indicates the space-time region covered by the tach runs on the left. Figure 4 is obtained by superimposing the tach runs on the left in Figure 2 on the speed contour plot in the rectangle on the right in Figure 3. The white band just below postmile 6 indicates that the detector data at that location are missing. Three points are worth emphasizing. First, there is broad agreement in the speeds calculated by PeMS and experienced in the tach runs. The areas where PeMS indicates free flow are also experienced as free flows by the tach vehicles; the areas where PeMS indicates speed of 40 mph the tach vehicles also travel at that speed. However, there are some differences. PeMS indicates speeds below 20 mph until 5:30 pm up to postmile 2.2; but the tach vehicles seem to experience these low speeds up to postmile 1.8, depending on the time. This is in part a consequence of the fact that there are detectors at postmiles 1.5 and 2.4 and none in between, so PeMS cannot distinguish speeds at locations between these detectors; and in part because the contour plot takes the average speed across all four lanes, whereas the tach vehicle only records its own speed. Third, we see in Figure 3 (right) that the congestion below postmile 2 began as early as 7AM, but these tach runs began only at 2:45PM, so the AM congestion may have been missed entirely (see Appendix 3). The second site is an 8.3 mile segment of 91E. There are 13 runs between 3:00 and 7:30 PM as seen in the left of Figure 5, corresponding to the rectangle in the PeMS speed contour plot on the right in Figure 5.
Figure 5 Tach runs on 12/09/04 on 91E (left) and PeMS average speed contour plot (right)
13
Once again the contour plot shows congestion outside the tach run rectangle, indicating that the tach runs may underestimate the congestion.
Figure 6 Tach runs superimposed on PeMS contour plot Figure 6 reveals broad agreement in speeds, but there are differences in detail. These are again in part due to detectors at postmiles 35.39 and 36.76 not working on that day. There is also the difference between average speed across all lanes and tach vehicle speed. The difference is also in part an artifact of the color scheme to denote speed. One can see that a slight increase in speed near 30 mph will change the color from blue to green, which exaggerates the speed difference. Figure 7 shows the tach runs for the third study site, an 8.96-mile long segment on I-5N during the PM peak on 11/05/2002. Once again, the tach runs appear to miss congestion that started before the first tach run, as shown in the contour plot outside the rectangle. Figure 8 permits comparison of the speeds given by PeMS and the tach vehicle speeds. The two speeds agree even in some of the fine structure of the contour plots, despite the missing detector data (shown as white stripes).
14
Figure 7 Tach runs on 11/05/02 on 5N (left) and PeMS average speed contour plot (right)
Figure 8 Tach runs superimposed on PeMS contour plot
15
Figure 9 Tach runs on 10/29/02 on 55N (left) and PeMS average speed contour plot (right)
Figure 10 Tach runs superimposed on PeMS contour plot
The fourth study site is a 10.46-mile segment on I-55N. This segment has a denser arrangement of functioning detectors (see Table 1), and the conformity between PeMS speeds and tach vehicle speeds is greater, as evident in Figure 10. Thus the closer the loop detectors are spaced, 16
the better is the agreement between tach speeds and PeMS speeds.
17
4 Accuracy of tach-based and PeMS-based estimates We calculate the accuracy of tach-based and PeMS-based estimates for the four study sites listed in Table 3 (see also Table 2). The column ‘gooddays’ is the number of days in the year for which good (observed and imputed) detector data in PeMS are available. The annual HICOMP report publishes three parameters: the magnitude, duration, and extent of congestion over a freeway segment, averaged over the 260 weekdays of the year. Tach-based estimates have an error because they are based on at most four (out of 260) days of measurements. PeMS-based estimates have an error because they measure the congestion only at discrete locations along the entire segment, and also because of loop detector measurement errors.
Fwy
Gooddays
Run.date
D03 51N
Seg. length Number of stations 6.738 13
241
2002-11-6
D12 91E
9.891
17
261
2004-12-9
D12 5N
13.587
30
261
2002-11-5
D12 55N
11.547
24
261
2002-10-29
Table 3 The four study sites 4.1 Errors in tach-based estimates
Figure 2 shows that the daily delay varies randomly over the year. If we denote the delay on day j by D( j ), the true annual average D and the standard deviation σ of the daily delay are D=
1 ∑ D( j ), 260 j
σ=
1 260
[∑ ( D( j ) − D) ]
2 1/ 2
.
(1)
If we measure the delay on n days, j1, …, jn, and estimate the average by
1 Dn = [ D( j1 ) + D( j 2 ) + ... + D( j n )], n
(2)
the error in our estimate will be | D − Dn | . Furthermore, the smaller the number n of samples, the larger will be the error. We estimate the magnitude of this error by the standard deviation σn of the error | D − Dn | . Errors in the estimates of duration and extent will similarly be quantified by their standard deviation. We estimate these errors for the four study sites using the following procedure. For each study site and each day j, we obtain the delay D(j) (veh-hrs), duration T(j) (hrs) and extent L(j) (miles) from PeMS. The delay is taken to be the extra time spent driving below 60 mph. The duration and extent are obtained taking 35 mph as the reference speed, and calculated from the PeMS speed contour plot as illustrated in Figure 10.
18
The top left plot in Figure 11 is the contour plot of speed on the first study site in 51N for which we have tach runs on 11/06/2002. The three other plots only distinguish speeds above or below the reference speed of 60, 50 and 35 mph. Consider the lower right plot. The blue area is the space-time region that experiences speed below 35 mph. We project this area onto the time (x) axis to obtain duration and onto the space (y) axis to obtain extent. Thus on this day the
Figure 11 Obtaining duration and extent of congestion duration of congestion is the length of the horizontal arrow and its extent is the sum of the lengths of the two vertical arrows. We repeat this for each of the N days for which we have data. (For the first site, as indicated in Table 3, N = 241; for the other sites, N = 261.) In this way we obtain the actual delay D(j), duration L(j), and extent T(j) for each day j = 1, 2, … , N. From these values we calculate the true averages D=
1 N
∑ D( j ), j
L=
1 N
1
∑ L( j ), T = N ∑ T ( j ), j
(3)
j
and standard deviations
σD =
1 N
[∑ ( D( j) − D) ]
2 1/ 2
,σL =
1 N
[∑ ( L( j) − L) ]
2 1/ 2
, σT =
1 N
[∑ (T ( j) − T ) ]
2 1/ 2
(4)
19
for the three congestion parameters. If we have n days of tach runs, we average the measurements on the n days and obtain the estimates Dn, Ln, and Tn similarly to formula (2). The standard deviations of the errors | Dn − D |, | Ln − L |, | Tn − T | are related to σ D , σ L , σ T by
σ D ( N − n) / n( N − 1) , σ L ( N − n) / n( N − 1) , σ T ( N − n) / n( N − 1) , and since n is at most 4, which is much smaller than N, these are approximately
σ D ,n ≈
1 n
σ D , σ L,n ≈
1 n
σ L , σ T ,n ≈
1 n
σT .
(5)
Table 4 lists the true average values and the standard deviations obtained from (3) and (4) for the four study sites. Average 51N D (veh-hrs)
91E
5N
55N
1116.6 3744.7 2072.8 1299.3
L (miles)
3.46
4.74
3.47
3.98
T (hrs)
4.47
6.21
5.54
3.64
640.1 2283.6 1235.3
630.0
Standard deviation
σ D (veh-hrs) σ L (miles)
1.08
1.29
1.58
1.11
σ T (hrs)
1.75
2.43
2.31
1.40
Table 4 Average values of the congestion parameters and their standard deviation The numbers in Table 4 have the following meaning: On roughly 68 percent of the days in 2002, the congestion delay on the 51N study segment was in the interval 1116.6 ± 640.1 veh-hrs, the extent was within 3.46 ± 1.08 miles, and the duration was within 4.47 ± 1.75 hrs. A similar interpretation holds for the other three sites. Observe that the standard deviation is almost 50 percent of the average value, indicating a large variation in congestion from one day to the next. We gain a deeper appreciation of the variation in congestion from Figure 12, which shows the histograms of daily delay, duration and extent for the four sites. The vertical blue lines are the annual averages, calculated from (3) and also given in Table 4. The vertical red lines correspond to the delay, duration and extent of congestion measured on the day of the tach run. The difference between the red and blue lines is the error that one would make by taking the measurements of the tach run to be the true averages. Of the twelve estimates (three parameters for each of the four sites) in Figure 12, eight have an error smaller than their corresponding standard deviation and four have an error exceeding the standard deviation. 20
From the fact that the standard deviations for the four sites in Table 4 are nearly 50% of the true average values, and that typically only one day of tach run data is available, the errors in the tach-based estimates of the true congestion parameters is on the order of 50 percent! (If four days of tach data are available, relation (5) implies that this error would be on the order of 25 percent!) We conclude that tach-run based estimates published in the HICOMP congestion parameters are not reliable.
Figure 12 The histogram of delay, duration, and extent for the four sites Suppose we take tach run estimates over two successive years and use the difference to conclude whether congestion is increasing or decreasing, and by how much. The error in the estimate of 21
the true difference increases by a factor of 2 ≅ 1.4 , which means the error is on the order of 1.4 × 50 = 70 percent!. With such a large error makes it impossible to place any confidence in the congestion trends in Figure 12 published in the HICOMP report. 600
6,000
550
5,500
500
5,000 Total Directional Urban Freeway Miles
4,500
400
4,000
350 300
3,500 Daily Vehicle-Hours of Delay
3,000
250 200
2,500 Congested Directional Miles
2,000
150
1,500
100
1,000
50
Congested Directional Miles
Urban Freeways Daily Delay (1,000 Vehicle-Hours)
450
500
0 0 1987 1988 1989 1990 1991 1992 1993 1994 1995 1996* 1997* 1998 1999 2000 2001 2002 2003 Year
Figure 13 Trends in congestion. Source: Caltrans 2003 HICOMP report 4.2 Errors in PeMS-based estimates
We now calculate the errors in PeMS-based estimates. There are two types of errors. The first type of error occurs because traffic is monitored at a few discrete locations along the freeway segments. We call this (spatial) sampling error. The second type of error arises from aggregating measurements from a system of detectors that changes over time and whose data quality is uneven. We call this aggregation error. Sampling error
This error occurs because the congestion parameters are calculated from measurements at a few discrete locations on the freeway segment. We estimate this error as follows. Consider the 51N study segment, which has13 detectors, corresponding to a detector density of 13/9 = 1.4 detectors/mile. We take the measurements reported by these 13 detectors as ‘ground truth’. We now simulate the effect of having data from fewer stations. Consider one day. We randomly pick n = 1, 2, … ,12 out of the13 stations, and estimate the congestion parameters for that day from the n selected detectors. For each n, we make a different random selection 65 = 5 × 13 times. In this way, for each sample size n, we get 65 measurements of the congestion parameters, which we compare with the ground truth given by measurements from all 13 stations. The three ‘box and whiskers’ plots in Figure 14 summarize the distribution of the 65 values of the congestion parameters for each sample size. The speed contour plot is the ground truth from all 13 detectors on 11/06/2002.
22
We explain how to interpret the box plots. Consider total delay on the study segment displayed in the top left plot. Pick a sample size, say n = 3. The lower limit of the gray box is the 25th percentile, the bold black horizontal line towards the middle of the box is the median or 50th percentile, and the upper limit of the box is the 75th percentile of the 65 values. The two
Figure 14 Simulation of congestion parameters with n = 1, 2, … , 13 detectors over a 9-mile section of 51N on 11/06/2002 ‘whiskers’ extend from the box to smallest/largest points that are within by 1.5 × the interquartile range from the box boundaries. Finally, the small circles denote ‘outliers’. As one can see for n = 3, the median value is 1,100, the 25th percentile is 700, and the 75th percentile is 1,800 veh-hrs. As expected, as n increases, the variability reduces, until for n = 13 we get the ‘ground truth’, which is 1,300 veh-hrs. A commonly accepted statistic that summarizes the error is RMSE, the square root of the mean square error (MSE), defined as 23
MSE = variance + bias 2 , (6) in which ‘bias’ is the difference between the median and the true value. Figure 15 shows how the RMSE decreases with n. We can see from the top left plot of Figure 15 that we must have at least 10 detectors if we want the RMSE error to be less than100 veh-hrs. (Recall that the true average delay is 1,300 veh-hrs.)
Figure 15 RMSE of the congestion parameter estimates with number of detectors n = 1, … , 13 over a 9-mile section of 51N on 11/06/2002. The error calculations summarized in Figures 14 and 15 are for a single day, 11/06/2002. A different day would yield different calculations. We pick 10 random days in the year, and obtain 10 RMSE curves, similar to those of Figure 15. Figure 16 depicts the result for all four sites.
24
Figure 16 RMSE curves of the congestion parameters for 10 randomly selected days for the four sites
25
Figure 17 Summary of the RMSE error for the four sites as a function of detector density (number of detectors per mile) Figure 17 gives the final summary of the accuracy of the congestion parameter estimates. It is obtained as follows. We first replace the 10 curves in Figure 16 by a single curve given by their median values. Next we replace the number of detectors (the x axis in Figure 16) by the detector density, i.e. we divide the number of detectors in each segment by the length of the segment. Thus the x axis in Figure 17 is the number of detectors per mile of freeway. Lastly, we divide the RMSE in Figure 16 by the average value of the congestion parameter over the entire year. Thus the ‘relative RMSE’ of 0.5 means a RMSE equal to 50 percent of the average value. Furthermore, detectors may miss congestion whose extent is smaller than the detector spacing. Combining this observation and Figure 17, we see that if one wants a relative RMSE of 0.1, one must have a density of at least one detector every 0.5 mile. 26
Aggregation error
1500
1900
VMT
12/01/2005
11/01/2005
10/01/2005
09/01/2005
08/01/2005
07/01/2005
06/01/2005
05/01/2005
04/01/2005
03/01/2005
02/01/2005
01/01/2005
12/01/2004
11/01/2004
10/01/2004
1400 09/01/2004
1000 08/01/2004
1500
07/01/2004
1100
06/01/2004
1600
05/01/2004
1200
04/01/2004
1700
03/01/2004
1300
02/01/2004
1800 #Lane Pts('0000)
Lane-Pts 1400
01/01/2004
Monthly VHT(millions) during PM peak
This error in PeMS-based estimates occurs because of frequent changes in the configuration of the detector system, i.e. the number and location of the detectors, and the uneven quality of detector data. Figure 18 illustrates the concern raised by configuration changes.
Figure 18 Total monthly statewide VHT during PM peak and expected number of lane points The red graph in Figure 18 gives the monthly total data coverage, measured as the number of lane points of data that PeMS expects. Observe that this total fluctuates considerably from month to month. For instance, from February 2004 to December 2005, the coverage increased by 23 percent, of which 10 percent is accounted by the increase in the number of days from 28 to 31. The black graph is the monthly statewide VMT during the PM peak hour, calculated from the data whose coverage is depicted by the red curve. The correlation between the two series is so high (0.72), that one cannot avoid the conclusion that the monthly VMT fluctuation is an artifact of the fluctuations in coverage, and reflects changes in the detector system configuration reported by the Districts and in the number of days in each month. We can attempt to compensate for these changes by dividing the monthly VMT by the coverage as in Figure 19. The x-axis is now the monthly PM peak VMT per expected number of lane points. The month-to-month variation is now quite different from that suggested by Figure 18. Indeed, Figure 18 suggests that monthly PM peak delay increased slightly in 2005 compared with 2004, whereas Figure 19 shows the seasonal fluctuations: high VMT during March-May and low VMT during September-December. The point is that one must take care to take into account the underlying detector configuration when using PeMS data.
27
0.082
0.08
VMT/#LanePoints
0.078
0.076
0.074
0.072
12/01/2005
11/01/2005
10/01/2005
09/01/2005
08/01/2005
07/01/2005
06/01/2005
05/01/2005
04/01/2005
03/01/2005
02/01/2005
01/01/2005
12/01/2004
11/01/2004
10/01/2004
09/01/2004
08/01/2004
07/01/2004
06/01/2004
05/01/2004
04/01/2004
03/01/2004
02/01/2004
01/01/2004
0.07
Figure 19 Monthly statewide PM peak VMT/expected number of lane points Figures 20, 21 illustrate the concern about data quality. Figure 20 is the counterpart of Figure 18 for total monthly PM peak delay and detector coverage. The black graph is the monthly delay and the red graph is, as in Figure 18, the expected number of lane points. The correlation of 0.64 between the two series is smaller than in Figure 18, because fluctuations in delay are far more pronounced than fluctuations in demand or VMT, so the quality of the data plays a more significant role. This is suggested in Figure 20: the correlation between the series of observed samples and delay is 0.67. To summarize: Accuracy in PeMS-based congestion estimates requires a detector spacing of less than 0.5 miles. Congestion measures using PeMS data should not be used to make inter-year or inter-district comparisons, unless sufficient care is taken to account for the underlying changes in the configuration of the detector system and the quality of the data.
28
12/01/2005
11/01/2005
10/01/2005
09/01/2005
08/01/2005
07/01/2005
06/01/2005
05/01/2005
04/01/2005
03/01/2005
02/01/2005
01/01/2005
12/01/2004
11/01/2004
10/01/2004
09/01/2004
08/01/2004
7000 17.8
6500 17.1
6000 16.4
5500 15.7
5000 15
8000
Samples
7000 140
6500 130
6000 120
5500 110
5000 100
Lane points (millions)
# Lane Points
Samples collected (millions)
12/01/2005
11/01/2005
10/01/2005
09/01/2005
08/01/2005
07/01/2005
06/01/2005
05/01/2005
04/01/2005
03/01/2005
02/01/2005
01/01/2005
12/01/2004
11/01/2004
10/01/2004
09/01/2004
08/01/2004
07/01/2004
06/01/2004
05/01/2004
04/01/2004
03/01/2004
02/01/2004
01/01/2004
Monthly Delay (veh-hr 000's) 7500
07/01/2004
06/01/2004
05/01/2004
7500
04/01/2004
03/01/2004
02/01/2004
01/01/2004
Monthly Delay (veh-h 000's) during PM peak
8000 Delay 19.2
18.5
Figure 20 Monthly statewide PM peak delay and expected number of lane points
Delay 160
150
Figure 21 Monthly statewide PM peak delay and number of samples collected
29
4.3 Error characteristics of tach-run based and PeMS-based congestion monitoring
This section summarizes the empirical relationship between the error characteristic (in terms of percent error or, equivalently, relative RMSE) and the two ‘sampling’ parameters, the number of days sampled and detector density. Effect of sampling of days We computed the population mean ( D, L and T ) and standard deviation ( σ D , σ L and σ T ) of the three congestion parameters for the four study sites in section 4.1 (Table 4). The percent error in estimating D , the total delay, is given by σ N −n Percent error = D , D n( N − 1) in which N = 260 is the population size (total number of weekdays in a year) and n is the number of days sampled. The percent errors in estimating the two other parameters L and T are defined similarly.
Figure 22 shows the relationship between the percent error and n for the four sites. Thick lines represent the average of the four curves. Effect of detector density
The empirical relationship between the percent error and the detector density was already presented in section 4.2 (Figure 15). Figure 23 summarizes the result. (The only change from Figure 15 is that the independent variable is detectors/mile.) Each line corresponds to the four study sites and thick lines represent the average of the four curves. Since detector density is irregularly spaced, a smooth curve was fitted via LOESS [5] to obtain the average curve. Use of the empirical error curves
The error characteristic curves presented above can be used to approximate the percent error that can be achieved by a given sampling scheme and detection density. For a tach run-based method, assuming that each tach run produces accurate congestion measurements on that day, the percent error can simply be found using Figure 22. For a loop detector-based method, if detectors report on many days (at least 20 days out of 260), detector density will dominate the error and the percent error can be found using Figure 23. Detector data may not be available for many days because of detector or communication failures. In that case, sampling of days and detector density both contribute to the percent error. The simple formula Percent error = Percent error from sampling of days + Percent error from spatial sampling can be used to approximate the percent error in such case. This formula is based on the assumption that errors from sampling of days and detector density are independent, which seems reasonable. Fixed detectors, especially loop detectors, can be unreliable and the data could contain many missing and/or imputed values. The approach described above could be used to handle missing or imputed values as well: detectors that are broken most of times would increase percent error, the effect of which can be quantified in terms of detector density; on the other hand, many
30
detectors that fail together on many days can be analyzed as the reduction in the number of days sampled. Note though that such computation yields a conservative or pessimistic estimate of the accuracy of the loop based method, especially PeMS, since imputation in PeMS is done intelligently to capture and reflect traffic patterns and using imputed values would be better than not using them at all.
Figure 22 Percent error for congestion parameters vs. number of days sampled (out of 260 weekdays in a year)
31
Figure 23 Percent error for congestion parameters vs. detector density (detectors/mile)
32
5 Cost comparison 5.1 Tach vehicle cost
The estimate of probe vehicle cost of $264 per monitored mile per day of data collection is based on: • Analysis of District 8 tach run data for a total of 166 directional miles • Assuming 3 vehicles running at 20-minute headway for one time period monitored (AM or PM), not the entire day • Assuming labor cost of $72,000 per person per year plus 100% overhead or $258 per monitored mile per day • Vehicle operating cost (gas, oil, maintenance, tires, insurance) equal to $0.18 per mile, or $6.00 per monitored mile per day, based on AAA “Cost of driving” analysis. Thus using tach vehicles to monitor 10 miles of freeway for four days in the year will cost $264×10×4 = $10,560. This estimate excludes vehicle depreciation. 5.2 Detection cost
Detection costs are based on an analysis of a 10-mile urban freeway segment with metered interchanges every 0.5 mile. Assumptions for TMS Inventory costs are: •
Typical TMS installation assumes 4 lanes in each direction and 2 loops per lane
•
Annual maintenance and support staff cost is in the Division of Traffic Operations
•
Hardware and software lifecycle is 25 years
•
Hardware lifecycle cost is taken as 60% of the hardware lifecycle cost for traffic signals
•
IT software developed in-house and development cost included in the per unit implementation cost.
These assumptions lead to an annualized life cycle cost (capital + O&M) of $6,300 per station. A10-mile freeway with stations every 0.5 mile needs 20 stations at an annualized cost of $126,000.5 We allocate 25 percent of this cost or $32,000 for the HICOMP application, and the remaining 75 percent to all other PeMS applications.6 This is equal to the cost of 12 days of tach vehicle runs per year. As we have seen, the resulting accuracy of the estimates is much greater.
5
It should be noted again that the detector station cost estimates may be exaggerated. Moreover, new detection technologies provide data that are more accurate than loop data at about one-sixth the cost presented here. 6 These applications include ramp metering, traveler information, vehicle census counts, bottleneck location, etc. Together, these applications are far more valuable than providing HICOMP congestion estimates. Nevertheless, the allocation of 25 percent of the detection cost to the HICOMP application is arbitrary.
33
6 Proposal for PeMS-based congestion reporting protocol The purpose of this section is to outline a standardized congestion reporting protocol that can be implemented across districts to document congestion. Caltrans has been working toward a standardized congestion reporting protocol using a wide range of performance measures since 1998. In that year, Caltrans embarked on an initiative to develop transportation system performance measures and in 2002, the Transportation Management System (TMS) Master Plan included a Performance Measurement Framework report that identified additional measures to analyze the operational aspects of the transportation system. These measures focus on operational strategies to improve the safety, mobility, reliability and productivity of the transportation system. The report recommended a new measure, productivity, and identified additional indicators to evaluate the relative performance of TMS strategies, including ramp metering, incident management, arterial system management, and traveler information systems. Theses measures were incorporated into the Caltrans’ “One Vision/One Mission” statement adopted in 2003 to improve mobility across California. In 2005, Caltrans and regional planning agencies agreed on revised performance measures to include improved productivity and reliability measures. Currently, Caltrans maintains a website within the Division of Transportation System Information (TSI) that provides the public with information related to performance measurement. This site is located at http://www.dot.ca.gov/hq/tsip/tspm/. Beginning in 2002, Caltrans also began to implement some of these measures for congestion monitoring by using PeMS in the annual Comprehensive Monitoring Reports. This on-going effort is used to “test drive” comprehensive performance measurement and to see how they can be routinely be applied to freeway congestion monitoring. Although the comprehensive reports do not address the entire State or all the indicators needed, it is a step in the direction that leverages the wide spectrum of data that automatic congestion reporting can provide including: •
Delay by quarter, month, weekday, and hour of the day for severe (