Evaluation of Shared Cache Architectures for TPC-H Michel Dubois, Jaeheon Jeong**, Shahin Jarhomi, Mahsa Rouhanizadeh and Ashwini Nanda* Department of Electrical Engineering - Systems University of Southern California Los Angeles, CA90089-2562
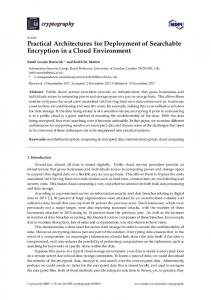
[email protected] 1. Introduction The design of large-scale servers must be optimized for commercial workloads and web-based applications. These servers are high-end, shared-memory multiprocessor systems with large memory hierarchies, whose performance is very workload dependent. Realistic commercial workloads are hard to model because of their complexity and their size. Trace-driven simulation is a common approach to evaluate memory systems. Unfortunately, storing and uploading full traces for full-size commercial workloads is practically impossible because of the sheer size of the trace. To address this problem, several techniques for sampling traces and for utilizing trace samples have been proposed [2][4][5][7][9]. For this study, we have collected time samples obtained from an actual multiprocessor machine running TPC-H [8] using the MemorIES board developed by IBM [6]. MemorIES was originally designed to emulate memory hierarchies in real-time and is plugged into the system bus of an IBM RS/6000 S7A SMP system running DB2 under AIX. This system can run database workloads with up to 1TB of database data. The target system that we evaluate with the TPC-H samples is shown in Figure 1. It is an 8-processor bus based machine. Each processor has 8MB of second level cache (4-way, 128 byte blocks). Cache coherence is maintained by snooping on a high-speed bus. The 24GByte main memory is fronted by a shared cache [11], whose goal is to cut down on the effective latency of the large and slow DRAM memory. One advantage of a shared cache is that it does not require cache coherence. The disadvantages are that L2-miss penalties are only partially reduced and the shared cache does not bring any relieve to bus traffic. We look at the effects of cache block size and cache organization. We observe that IO has a large
*IBM T.J. Watson Research Center Yorktown Heights, NY **IBM Beaverton, OR97006 impact on the cache behavior, especially for very large shared caches (e.g., 1 GBytes) and therefore we evaluate various strategies for handling IO bus request in the shared cache --invalidate, update and allocate. S y stem M em ory 2 4G B y tes of D R A M
S h ared C ach e 64M B -1G B
L2 8M B
L2 8M B
P1
P2
..........
L2 8M B IO P8
Figure 1. Target Multiprocessor System with Shared Cache
The rest of this paper is organized as follows. In Section 2, we present the tracing tool obtained by configuring MemorIES, the trace sampling scheme, and the characteristics of the trace samples. In Section 3, we describe the target shared-cache architectures. In Section 4, 5 and 6, we show the impact of the coldstart effect and classify miss rates into sure maximum and unknown miss rates. Based on that classification, we are able to draw some conclusions on the effectiveness of the shared cache for TPC-H. Finally we conclude this abstract in Section 7. 2. TPC-H Traces Much of this section is reproduced from [6] and [3] and is included here for completeness. 2.1. Tracing Environment The IBM Memory Instrumentation and Emulation System (MemorIES) was designed to evaluate trade-
offs for future memory system designs in multiprocessor servers. The MemorIES board sits on the bus of a conventional SMP and passively monitors all the bus transactions, as shown in Figure 2. The host machine is an IBM RS/6000 S7A SMP server, a bus-based shared-memory multiprocessor. The server configuration consists of eight Northstar processors running at 262MHz and a number of IO processors connected to the 6xx bus operating at 88 MHz. Each processor has a private 8 MB 4-way associative L2 cache. The cache block size is 128 bytes. Currently the size of main memory is 24 Gbytes. C on sole M ach in e
PCI
A M C C C a rd P a ra llel C on so le P ort
M em orIE S
S ystem M em o ry
6x x B u s L2
L2
L2
L2
H O ST M A C H IN E
.......... P1
P2
P3
P8
Figure 2. Operating environment of MemorIES
A finely tuned 100Gbyte TPC-H benchmark [8] runs on top of DB2 under AIX. Its execution takes three days on the server. Although it has been conceived for online cache emulation, MemorIES can be configured as a tracing tool. In this mode, it captures bus transactions in real time and stores them into its on-board memory. Later on, as the on-board memory fills up, the trace is uploaded to a disk. Currently, with its 1GB of SDRAM, MemorIES can collect up to 128M bus transaction records without any interruption, since each record occupies 8 bytes. 2.2. Trace Samples Although MemorIES can store up to 128M references per sample, the size of each sample collected for this study is 64M references. Currently, it takes about one hour to dump to disk a sample of 64M references or 512Mbytes. Our trace consists of 12 samples with roughly one hour between samples and its overall size is 6 Gbytes. The trace samples were taken during the first day of a three-day execution of a 100GB TPC-H. Each sample records about a few minutes of execu-
tion. Table 1 shows the reference counts of every processor and for every transaction type in the first trace sample. It shows that the variance of the reference count among processors (excluding IO processors) is very small. The references by IO processors are dominated by write/flush. We found similar distributions in the rest of the samples. Table 2 shows the reference counts of eight transaction types in each of the 12 trace samples. We focus on the following classes of bus transactions: reads, writes (read-excl, write/inv), upgrades, and write/ flushes (essentially due to IO write). In the 12 samples, processor reads and writes (including upgrades) contribute to around 44% and 21% of all bus transactions, respectively. 35% of all bus transactions are due to IOwrites. IO-writes are caused by input to memory. On each IO-Write, the data block is transmitted on the bus and the processor write-back caches are invalidated to maintain coherence with IO. We also found some noticeable variations in some reference counts across trace samples. For instance, notice the wide variation in the number of upgrades among samples. 3. Target Shared Cache Architectures We focus on the evaluation of L3 cache architectures shared by an 8-processor SMP. The shared cache size varies from 64MB to 1GB. Throughout this paper, LRU replacement policy is used in the shared cache. We evaluate Direct mapped and 4-way cache organizations. We also look at two block sizes, 128 Bytes and 1 Kbytes. The idea of a shared cache is not new as it was proposed and evaluated in [11], in a different environment and using analytical models. The goal of a shared cache as shown in Figure 1 is to cut down on the latency of DRAM accesses to main memory. On every bus cycle, the shared cache is looked up and the DRAM memory is accessed in parallel. If the shared cache hits, then the memory access is aborted. Otherwise, the memory is accessed and the shared cache is updated. Let H be the cache hit rate and let Lcache and LDRAM be the latency of a shared cache hit and of a DRAM access. Then the apparent latency of the large DRAM memory is: (1- H) x LDRAM + H x Lcache. The shared cache can have a high hit ratio even if its size is less than the aggregate L2 cache size in the
PID
read
read-excl
clean
ikill
write/inv
write/clean
upgrade
write/flush
0
3944601
221999
0
192
295218
5677
1629223
67102
1
4001991
217725
64
160
270918
5096
1685160
64724
2
4175661
208862
0
96
303913
5267
1742245
65406
3
3908973
213590
0
0
286916
5430
1610544
66424
4
4101762
209785
64
128
254847
5080
1640377
66063
5
3932938
217326
0
64
314963
5100
1580184
65686
6
4166149
192101
0
0
248305
4533
1821616
65143
7
3851738
200694
0
288
225611
4758
1654915
64449
IO
978887
0
0
0
12
0
0
16232121
TABLE 1. Breakdown of references in the first trace sample in each processor Sample
read
read-excl
clean
ikill
write/inv 2200703
write/clean 40941
upgrade 13364264
write/flush
1
33062700
1682082
128
928
16757118
2
29574629
1446244
0
2272
2677942
43781
10059975
23304021
3
28717853
1335718
0
0
2835185
35304
10637496
23547308
4
27727985
1405457
6432
6720
2900043
54407
8734182
26273638
5
25799000
1774029
0
0
3067320
51339
9517591
26899585
6
28760710
4021657
96
96
6077446
44147
6367359
21837353
7
29087095
1959379
0
608
2953071
57934
7265500
25785277
8
28830726
1929086
0
160
2866096
59072
7312608
26111116
9
26092006
1970931
96
320
3206843
57642
7186243
28594783
10
26899985
1768684
72
66
3279821
50629
7148337
27961270
11
36070868
1079535
0
0
2009423
96048
10462970
17390020
12
36516311
1108966
50560
51936
2159616
145164
10631200
16445111
Avg (%)
44.35
2.66
0.01
0.01
4.50
0.09
13.50
34.88
TABLE 2. Reference count per transaction type in the 12 trace samples
multiprocessor, because the shared cache does not maintain inclusion and also because of sharing. If the main (DRAM) memory is banked and interleaved then a separate shared cache can be used in conjunction with each memory bank. This partitioning of the shared cache may result in lower hit rates than the ones reported here. We assume throughout that the shared cache can buffer any main memory block. IO transactions can have a huge impact on shared cache performance. The standard way to deal with IO transactions is to simply invalidate the cache on each IO transaction detected on the bus. However, other policies are possible, since, on input the transaction carries the data with it. The first policy is IO-update, whereby if the shared cache hits, then the block is updated instead of invalidated. The second policy is IO-allocate, whereby misses due to IO cache accesses allocate a block in the cache. Because allocating means taking a miss in the shared cache, the control
for the cache may be more complex, especially when the bus transaction does not carry the values for the entire block. These two strategies may pay off if the shared cache is big enough to retain database record between the time it is inputted and the time it is accessed. In the shared cache we simulate, we consider each bus transaction as follows: Processor requests: Read: In case of a hit in the shared cache, we update the LRU statistics for the block. On a miss the data is loaded in cache from memory. Read-excl: same as read. Clean,I-kill: Invalidate the block in the shared cache. W-Clean: same as read. W-kill,Dclaim: These are upgrade request. Treated as reads in the shared cache.
Write-Flush: Invalidate the block.
4.2. Cache Set Warm-up Rate
IO requests: There are 3 types of IO requests: IO Read, IO Write and IO Write Flush. By far write flushes are the dominant request type. The request are treated differently, depending to the policy to deal with IO requests. In IO-invalidate, the shared cache is invalidated on all IO references. In IO-update, the block is updated in the case of a hit and its LRU statistics are updated. In IO-allocate the IO references are treated as if they were coming from execution processors. The miss rate counts reported in this abstract do not include misses due to IO since they are not on the critical path of processors’ execution.
Figure 4 shows the warm-up rate of cache sets. A cache set is deemed warm once all its blockframes have been accessed at least once. The graphs indicate that the cache set warm-up rate is much lower than the cache blockframe warm-up rate for large caches. This implies that cold blockframes are spread among many cache sets. If the trace-driven simulation of very large shared caches only uses the references to warm cache sets, the evaluation will be naturally biased to a (relatively) small number of hot cache sets. Thus this approach is debatable since a good set sampling strategy might produce a more usable trace. Thus collecting statistics on warm sets only as was proposed in [5] is not acceptable.
4-w ay
4-way
90
100
80
90
70
80
60
70
w arm se ts (% )
w arm blocks (% )
100
50 40 30
64M B 128 M B 256 M B 512 M B 1G B
20 10 0
0
4
8
12
16
20
24
28
32
36
40
n um ber o f re feren ces
44
48
52
56
60 50 40 30
64M B 128M B 256M B 512M B 1G B
20 60
64
(2 20 )
Figure 3. Blockframe Warm-up
10 0
0
4
8
12
16
20
24
28
32
36
40
44
48
52
56
60
64
num ber of references (2 20 )
Figure 4. Set Warm-up Rate
4. Cache Warm-up Rates 5. Shared Cache Miss Rate Classification 4.1. Cache Blockframe Warm-up Rates Figure 3 shows the average fraction of warm blockframes as a function of the reference number across all 12 samples for each of the four clustering schemes. We simulate each trace sample starting with empty caches. A blockframe is deemed warm after a block has been allocated to it for the first time. For every number of references, we calculate the average number of warm blockframes across all samples. The shared cache size varies from 64MB to 1GB. From the graphs, we see that shared caches larger than 128MB are never completely warm with 64M references.
To evaluate the performance of shared cache architectures with the trace samples, we use the miss rate as a metric. We decompose misses into the following four categories: cold misses, coherence misses due to IO, replacement misses, and upgrade misses. To do this, we first check whether a block missing in the cache was previously referenced. If it was not and is not preceded by an IO invalidation, the miss is classified as a cold miss. If the missing block was the target of an IO-invalidation before the miss is a deemed a coherence miss due to IO, irrespective of other reasons that may have caused the miss. Otherwise, the miss is due to replacement. An upgrade miss happens when an upgrade request
IO -In va lid a te , 4 -w a y ,1 0 2 4 b yte
IO -A llo c a te , 4 -w a y , 1 0 2 4 b yte
IO -U p d a te ,4 -w a y ,1 0 2 4 b yte
25
25
25
u p g ra de re p l co h -IO co ld -w arm co ld -co ld
20
up grad e repl cold-w a rm cold-cold
20
20
15
M iss ratio
M iss ratio
15
M iss ratio
15
10
10
10
5
5
5
0
64M
128M
256M c a c h e s iz e
512M
1024M
up grad e repl cold-w a rm cold-cold
0
0 64M
128M
256M c a c h e s iz e
512M
1024M
64M
128M
256M c a c h e s iz e
512M
1024M
Figure 5. Miss rate classification
on the bus misses in the shared cache. Upgrade misses do not occur when cache inclusion between the processors’ L2 caches and the shared cache is maintained, which is not the case here. To understand the cold-start bias better, cold misses are further decomposed into cold-cold misses and warm-cold misses. A cold-cold miss occurs on a cold miss such that a cache blockframe is allocated in a set that is not filled yet. A warm-cold miss occurs on a cold miss in a set that is already filled. The reason for separating the types of cold misses is that cold-cold misses may not be actual misses if the trace was continuous. These misses are called unknown references in [10]. On the other hand warmcold misses are sure misses, although we don’t know what kind of miss they really would be in the full trace. We analyze the components of the miss rate assuming that the shared cache is empty at the beginning of each sample. To calculate the miss rate, we apply each trace sample to empty caches and then we sum up all the misses and legitimate memory references (the ones listed in Table 1) in each sample. Figure 5 for 1KByte blocks shows that a large fraction of misses are due to IO coherence in the IO-invalidate system. This component is not present in IOupdate or IO-allocate. As the cache size increases, cold-cold misses become a dominant part of the cold miss component, and the large number of cold-cold misses in very large caches shows that the error due to cold start is significant for these systems.
6. Sure vs. Unknown References An interesting classification is between sure and unknown references [10]. Sure references are references such that we know for sure that they would hit or miss in the full trace. Unknown references are references for which we cannot decide whether they would hit or miss in the full trace. Of course all hits are sure references. Cold-cold misses that are not preceded by an IO-invalidate are unknown references. All other misses are sure references. Thus we can classify the miss rates as sure miss rate or unknown miss rate. The maximum miss rate is the ratio of the number of all misses and the number of all references. The sure miss rate is the lower bound on the miss rate. It is the ratio of the number of sure misses by the number of sure references. The unknown miss rate is the difference between the maximum miss rate and the sure miss rate. In the IO-invalidate case, the sure miss rate can be decomposed in the sure miss rate due to IO and other sure miss rate. This is shown in Figure 6. The white component at the top is the zone of uncertainty. That’s what we also call the unknown miss rate. It shows the error range for the results based on our samples. The sure miss rate in Figure 6 (in blue and red) is a lower bound on the expected miss rate. The assumption for this lower bound is that the unknown references have the same hit/miss behavior in the full trace as other references. However, it has been shown that the unknown references tend to miss more than others [10]. The black line superimposed to the stack bar
IO -In v a lid a te , 4 -w a y , 1 0 2 4 b y te
IO -In v a lid a te , 4 -w a y , 1 2 8 b y te 25
25
unknow n s u re m is s ra te n o t d u e to IO s u re m is s ra te d u e to IO
20
20
unknow n s u re m is s ra te n o t d u e to IO s u re m is s ra te d u e to IO
15
M iss ratio
M iss Ratio
15
10
10
5
5
0
64M
128M
256M c a c h e s iz e
512M
1024M
0
64M
128M
256M 512M c a c h e s iz e
1024M
Figure 6. Miss Rates of a 4-way Shared Cache with IO Invalidate
chart shows the average between the maximum miss rate and the sure miss rate. In [10] it was shown to be a pretty good estimate of the actual miss rate. When the block size is 128B, the zone of uncertainty is quite large, but for 1KB blocks, the zone of uncertainty is small. Obviously, under IO-invalidate the 1KB block size is a much better choice and it definitely pays to add more shared cache in this case. Figure 7 shows the impact of the strategy for IO bus requests. When the block size is 128 bytes, the strategy used for IO bus requests does not make much difference and this is a reliable result, since the zone of uncertainty is very small. However, when the block size is 1Kbytes, we see that potentially IO-update and IO-allocate strategies could make a big difference, but the zone of uncertainty is too large in this case to be conclusive. Finally Figure 8 shows the effect of the block size and the cache organization. We see that the block size has a huge impact on performance but that the organization of the cache does not matter much. Obviously conflict misses are few and far between. This is a reliable conclusion given the small size of the zones of uncertainty. 7. Conclusion In this work, we have used 12 time samples of
TPC-H collected during its first day of execution. The trace samples have been used to evaluate various architectures for a shared caches in a typical SMP system with 8 processors. We have looked at block sizes, cache sizes, cache organizations and strategies to handle IO requests. Because of cold start effects in each sample, we are not able to draw definite conclusions on all aspects of the shared cache architecture. Cold start effects in each sample result in a zone of uncertainty due to unknown references. We have observed the following: • Even small shared caches of 64 Mbytes (equal to the aggregate L2 cache size) is very effective, due to sharing and non inclusion • A block size of 1Kbyte is much better than a block size of 128 bytes. • The cache organization does not affect performance much. Thus a simple Direct mapped cache is probably preferable. This indicates few conflicts in the shared cache • With a 1GB cache and a block size of 1KB the shared cache miss rate is only a few percents • It would appear that for larger caches the strategy for handling IO requests (IO-invali-
4 -w a y .1 2 8 b y te b lo c k
4 -w a y . 1 0 2 4 b y te b lo c k .
25
25
unknow n s u re m is s ra te n o t d u e to IO s u re m is s ra te d u e to IO
20
20
unknow n s u re m is s ra te n o t d u e to IO s u re m is s ra te d u e to IO 15
M iss R atio
M iss Ratio
15
10
10
5
5
0
64M B / IN V A L
64M B / UPD
64M B / A LLO C
1GB/ IN V A L
1GB/ UPD
0
1G B / A LLO C
64M B / IN V A L
64M B/ UPD
64M B / A LLO C
1G B/ IN V A L
1G B/ UPD
1G B/ A LLO C
Figure 7. Miss Rates Comparison Between Various Cache Strategies for IO Requests.
We are trying to narrow the zone of uncertainty to get more conclusive evidence. Since the MemorIES board can emulate target cache systems in real time, we can use the time between samples to emulate a set of caches with different architectures and fill these caches up before the next sample is taken so that we have the content of these caches at the beginning of each sample. The content of these emulated caches is dumped with the sample at the end of each time sample. By playing with cache inclusion properties [9], the content of these few emulated caches can be used to restore the state of many different cache configurations at the beginning of each sample, thus eliminating the cold start effect. In this framework, a trace collection experiment consists of several phases, repeated for each time sample: a phase in which we emulate the target caches to get the snapshots, the trace sample collection phase, and the trace dump phase in which the snapshots and the trace samples are dumped to disk. Once we have the trace with the cache snapshots we will be able to firm up the conclusions of this paper.
8. Acknowledgments This work is supported by NSF Grant CCR0105761 and by an IBM Faculty Partnership Award. We are grateful to Ramendra Sahoo and Krishnan Sugavanam from IBM Yorktown Heights who helped us obtain the trace. IO -In v a lid a te 25
unknow n s u re m is s ra te n o t d u e to IO s u re m is s ra te d u e to IO 20
6 4 M B y te cache 1 G B y te cache
15
M iss R atio
date, IO-update or IO-allocate) may have a large impact on the miss rate. However the zone of uncertainty is too large to draw definite conclusions.
10
5
0
4way DM 4way DM 128B 128B 1KB 1KB
4way DM 4way DM 128B 128B 1KB 1K B
Figure 8. Effect of Cache Organization and Block Size
“Performance of Shared Cache for ParallelPipelined Computer Systems,” In Proceedings of
9. References [1] L. Barroso, K. Gharachorloo and “Memory System Characterization of Workloads,” In Proceedings of the International Symposium on Computer June 1998.
E. Bugnion, Commercial 25th ACM Architecture,
[2] J. Chame and M. Dubois, “Cache Inclusion and Processor Sampling in Multiprocessor Simulations,” In Proceeding of ACM Sigmetrics, pp. 36-47, May 1993. [3] J. Jeong, R. Sahoo, K. Sugavanam, A. Nanda and M. Dubois, “Evaluation of TPC-H Bus Trace Samples Obtained with MemorIES” Workshop on Memory Performance Issues, ISCA 2001, http:// www.ece.neu.edu/conf/wmpi2001/full.htm. [4] R. Kessler, M. Hill and D. Wood, “A Comparison of Trace-Sampling Techniques for Multi-Megabyte Caches,” IEEE Transactions on Computers, vol. 43, no. 6, pp. 664-675, June 1994. [5] S. Laha, J. Patel, and R.K. Iyer, “Accurate Low-cost Methods for Performance Evaluation of Cache Memory Systems, IEEE Transactions on Computers, pp. 1325-1336, Vol. 37, No. 11, Nov. 1988. [6] A. Nanda, K. Mak, K. Sugavanam, R. Sahoo, V. Soundararajan, and T. Basil Smith, “MemorIES: A Programmable, Real-Time Hardware Emulation Tool for Multiprocessor Server Design,” In Proceedings of Ninth International Conference on Architectural Support for Programming Languages and Operating Systems, Nov. 2000. [7] T. R. Puzak, “Analysis of Cache ReplacementAlgorithms,” Ph.D. Dissertation, Univ. of Massachusetts, Amherst, MA., Feb. 1985. [8] Transaction Processing Performance Council, “TPC Benchmark H Standard Specification,” Transaction Processing Performance Council, June 1999. http://tpc.org. [9] W. Wang and J. L. Baer, “Efficient Trace-Driven Simulation Methods for Cache Performance Analysis,” ACM Transactions on Computer Systems, vol. 9, no. 3, pp. 222-241, August 1991. [10] D. Wood, M. Hill, and R. Kessler, “A Model for Estimating Trace-Sample Miss Ratios,” In Proceedings of the ACM Sigmetrics Conference on Measurement and Modeling of Computer Systems, pp. 27-36, 1990. [11] P. Yeh, J. Patel, and Ed. Davidson,
the ACM International Symposium on Computer Architecture, pp. 117-123, 1983.