sidered in the HearCom project relies on Wiener filter-based mini- mization of the mean ..... The hardware platform consists of a (laptop) PC running a real-time ...
EVALUATION OF SIGNAL ENHANCEMENT ALGORITHMS FOR HEARING INSTRUMENTS Koen Eneman1 , Heleen Luts1 , Jan Wouters1 , Michael B¨uchler2 , Norbert Dillier2 , Wouter Dreschler3 , Matthias Froehlich4 , Giso Grimm5 , Volker Hohmann5 , Rolph Houben3 , Arne Leijon6 , Anthony Lombard7 , Dirk Mauler8 , Marc Moonen9 , Henning Puder4 , Michael Schulte10 , Ann Spriet1,9 , Matthias Vormann10 1 ExpORL
– Dept. Neurosciences, Katholieke Universiteit Leuven, Herestraat 49 bus 721, B-3000 Leuven, Belgium phone: + (32)16330485, fax: + (32)16330486, email: {koen.eneman, heleen.luts, jan.wouters}@med.kuleuven.be 2 Department of Otorhinolaryngology, University Hospital Z¨ urich, Switzerland 3 AMC, KNO-Audiologie, Amsterdam, the Netherlands, 4 Siemens Audiologische Technik GmbH, Erlangen, Germany 5 Medical Physics Section, Carl von Ossietzky-Universit¨ at Oldenburg, Germany 6 Sound and Image Processing Lab, Royal Institute of Technology (KTH), Stockholm, Sweden 7 Multimedia Communications and Signal Processing, Universit¨ at Erlangen-N¨urnberg, Germany 8 Institute of Communication Acoustics (IKA), Ruhr-Universit¨ at Bochum, Germany 9 ESAT/SISTA, Katholieke Universiteit Leuven, Belgium, 10 H¨ orzentrum Oldenburg GmbH, Oldenburg, Germany ABSTRACT In the frame of the HearCom1 project five promising signal enhancement algorithms are validated for future use in hearing instrument devices. To assess the algorithm performance solely based on simulation experiments, a number of physical evaluation measures have been proposed that incorporate basic aspects of normal and impaired human hearing. Additionally, each of the algorithms has been implemented on a common real-time hardware/software platform, which facilitates a profound subjective validation of the algorithm performance. Recently, a multicenter study has been set up across five different test centers in Belgium, the Netherlands, Germany and Switzerland to perceptually evaluate the selected signal enhancement approaches with normally hearing and hearing impaired listeners. 1. INTRODUCTION Of the many digital signal enhancement techniques that have been proposed during the past decades, only a limited number have been effectively implemented and integrated in commercial hearing instruments. In fact, the customization of a signal processing scheme towards the implementation in a hearing aid or cochlear implant device makes strong demands in terms of computational complexity and processing delay, and requires a profound performance assessment through physical and perceptual validation tests. In the HearCom project (http://hearcom.eu) five promising signal enhancement algorithms are evaluated for future use in hearing instrument devices. In this section the algorithms are presented and some references are given to the literature. More detailed information about the algorithms and several sound demos can be found on http://hearcom.eu/prof/Algorithmdevelopment.html. 1.1 Single-channel noise suppression based on perceptually optimized spectral subtraction (SS1) Spectral subtraction is a well-known computationally efficient noise reduction technique. However, a major drawback of this approach is the presence of musical noise artifacts. By carefully selecting the amount of under- or oversubtraction, the enhanced signal can be perceptually optimized to eliminate the musical noise. To control the trade-off between speech distortion and noise suppression, the subtraction is made adjustable by incorporating a frequency dependent parameter α (k) that is a function of the noisy-signal to 1 The
work presented in this paper has been supported by grants from the European Union FP6 Project 004171 HEARCOM. The information in this document is provided as is and no guarantee or warranty is given that the information is fit for any particular purpose. The user thereof uses the information at its sole risk and liability.
noise ratio. The algorithm variant that has been selected for the HearCom project is a low-delay version of the original perceptually tuned spectral subtraction method (PSS) [15], which was obtained by reducing the time shift between subsequent frames. If the noise reduction filter were allowed to change freely for every frame-shift block, the rapid filter variations would be perceptually unacceptable. Therefore, the parameters controlling the adaptation speed of the algorithm had to be properly tuned [15]. 1.2 Wiener-filter-based single-channel noise suppression (SS2) A second single-channel noise suppression algorithm that is considered in the HearCom project relies on Wiener filter-based minimization of the mean squared error between the (unknown) desired speech signal and a filtered version of the observed noisy speech [13] [14]. Since speech is stationary only on short time intervals, statistical expectation operations have to be replaced by short term averages. Therefore, instead of using the actual a-priori SNR, estimated a-priori SNR values are computed following [11]. The samples of the observed noisy speech signal are partitioned into overlapped frames, are weighted with an analysis window and then transformed to the DFT domain. The enhanced speech spectral coˆ n), with m the frame index and n the DFT bin, are efficients S(m, ˆ n) = H(m, n) ·Y (m, n), where Y (m, n) are the noisy obtained as S(m, DFT coefficients and H(m, n) is a time and frequency dependent gain. As for the Wiener filter approach H(m, n) is real valued, only the modulus of the noisy DFT coefficient is changed and the phase is left unchanged. After weighting with a synthesis window, the time domain signal is reconstructed via overlap and add operations. The algorithm variant used in the HearCom project is a low-complexity and delay-optimized solution. The frame length and frame shift have been reduced resulting in a larger frame overlap and hence an increased correlation of the spectral data. As a consequence, the noise power is typically underestimated. To overcome this problem an improved Minimum Statistics noise power estimator has been developed [14]. 1.3 Broadband blind source separation based on second-order statistics (BSS) The blind source separation (BSS) algorithm considered in the HearCom project is based on work published in [1] [2] [3] [4], and in [5, Sect. II-E], where a class of broadband time-domain and frequency-domain BSS algorithms were derived that are based on second-order statistics. These broadband BSS approaches simultaneously take advantage of nonwhiteness and nonstationarity, and inherently avoid the permutation problem as well as circular convolution effects. Hence, no geometric information about the placement of the sensors is needed. The algorithm selected for evaluation
in the HearCom project is a low-cost, low-delay algorithm variant using frequency-domain-based fast convolution techniques. The algorithm is applied to bilateral hearing aids, using one microphone signal from each hearing aid as its inputs. This two-microphone implementation allows the separation of two point sources, additional diffuse sound sources having only a limited influence on the algorithm performance [1]. It is assumed that the desired source is located in front of the hearing aid user, which is a standard assumption in current state-of-the-art hearing aids. Based on the approach in [4] the time-difference-of-arrival (TDOA) of the sound waves originating from the separated sources can be determined from the demixing filters of the BSS algorithm, which makes it possible to select the right output channel containing the desired signal. 1.4 Spatially preprocessed speech-distortion-weighted multichannel Wiener filtering (MWF) The spatially preprocessed speech-distortion-weighted multichannel Wiener filtering algorithm (SDWMWF) is an adaptive noise suppression technique that is based on work described in [8] [9] [16] [17]. It consists of a fixed spatial preprocessor, i.e. a fixed beamformer and blocking matrix, and an adaptive stage. As a consequence, the SDWMWF can be viewed as a variant of the wellknown generalized sidelobe canceller (GSC) structure. Whereas in the case of the GSC the filter weights converge to a solution that merely reduces the residual noise, the cost function of the SDWMWF approach minimizes a weighted sum of the residual noise energy and the speech distortion energy. In this way, a trade-off is provided between noise reduction and speech distortion. If the tradeoff parameter in the cost function is set to infinity speech distortion is completely ignored and the algorithm reduces to a GSC structure. The SDWMWF algorithm can therefore be considered as an extension of the GSC. As the SDWMWF approach makes a tradeoff between noise suppression and speech distortion, the algorithm is more robust against speech leakage than the standard GSC [16]. Several algorithm variants have been developed, leading to cheaper implementation and/or improved performance [8] [9] [16] [17]. For the evaluation in the HearCom project a three-microphone version of the algorithm is considered that relies on a frequency-domain variant of the cost function and that uses efficient correlation matrix updating. 1.5 Binaural coherence dereverberation filter (COH) Dereverberation algorithms are designed to increase listening comfort and speech intelligibility in reverberating environments and diffuse background noise (e.g. babble noise). The dereverberation technique studied in the HearCom project is a binaural coherence filtering based approach that builds on work described in [18]. It estimates the coherence, i.e. the signal similarity, between the signals captured at the left and the right ear. The estimate is computed in different frequency bands using an FFT-based filterbank with a non-linear frequency mapping that approximates a Bark scale. As a coherence estimate, a time average of the interaural phase difference is computed. If the signals are coherent in a specific frequency band, the sound is expected to be directional, hence the gain in the frequency band is set to a high value. If on the other hand the coherence is low, a diffuse sound field is present, and accordingly, the frequency band is attenuated. The frequency-dependent gains are derived from the phase difference vector strength by applying an exponent (between 0.5 and 2) to the coherence estimate. High values for the exponent provide efficient filtering, but lead to more audible artifacts. Because of the head geometry, the coherence is always high at low frequencies, independently of the type of signal. At medium and high frequencies, on the other hand, the coherence is low for reverberated signal components (late reflections) and for diffuse babble noise, while it is high for the direct-path contribution of the signal of interest. Hence, by applying appropriate gains reverberated signal components and diffuse noise can be suppressed with respect to direct-path signal components.
2. PHYSICAL EVALUATION To properly validate a signal enhancement algorithm in a hearing aid context, dedicated evaluation measures are required that can accurately predict algorithm performance for a number of representative hearing loss profiles. However, a reliable performance assessment would require intensive speech intelligibility testing, listening effort assessment and quality scoring with a large number of test subjects under several realistic environmental conditions, which is highly time consuming. Taking this into account there clearly is a need for advanced physical evaluation measures that incorporate aspects of human hearing, and that can reliably predict algorithm performance through simulation experiments only. In a first phase of our research we relied on a number of physical evaluation measures that incorporate basic aspects of normal human hearing, such as the intelligibility-weighted signal-to-noise ratio (SNR), the segmental intelligibility-weighted SNR, the segmental SNR and a frequency-weighted log-spectral signal distortion measure. However, keeping the hearing aid application in mind, more advanced evaluation measures were put forward that take into account some characteristics of impaired hearing as well. In this respect, a number of physical performance measures have been proposed that assess various aspects of user-perceived signal quality, such as speech intelligibility, signal distortion, and relative loudness of desired and undesired signal components. In order to evaluate algorithm performance across different auditory profiles, the proposed measures make use of an auditory functional model that takes into account aspects of normal as well as impaired hearing. The auditory functional model and the physical evaluation measures are presented in sections 2.1 and 2.2, respectively. Hearing aids present recorded sounds with amplification and spectral shaping, individually adjusted to the user. To allow a fully autonomous performance assessment, the NAL-RP prescription rule [6] was included in the evaluation model to automatically set the amplification and spectral shaping for each profile. 2.1 Functional auditory model In section 2.2 four physical evaluation measures are introduced that are based on a functional auditory model that accounts for normal auditory functions and for some fundamental effects of hearing impairment, for instance loss of audibility at low input levels, loudness recruitment, reduced frequency resolution and reduced ability to extract suprathreshold speech cues for speech recognition. It should be noted, however, that the model attempts to simulate only the most fundamental and reasonably well-known effects of auditory processing. In particular, temporal masking effects and specific deficits in the binaural integration are not included in the model. More information about the functional auditory model can be found in [10]. Typical auditory profiles are incorporated into the model. The profiles have been selected based on a broad study of audiometric data from a large number of hearing impaired listeners, including individual pure-tone air-conduction thresholds, speech recognition, and results of categorical loudness judgements. In this way, six common categories ranging from mild over moderate to severe hearing loss have been considered [10]. Normal hearing was added as a seventh, reference profile. 2.2 Physical performance measures 2.2.1 Speech Intelligibility Index The speech intelligibility index (SII) is a standardized (ANSI-S3.51997) and commonly used measure to predict speech intelligibility in non-fluctuating noise. For broadband external noise that exceeds the hearing threshold at all frequencies, the SII is based on the frequency-weighted SNR (in dB), calculated using long-term average speech and noise power spectra. Once the SII is computed both for the unprocessed signal (SIIin ) and the processed signal (SIIout ), the SII improvement ∆ SII = SIIout − SIIin can be determined. The SII is always a number between 0 and 1. For normally hearing listeners, this range corresponds to SNR values from −15 dB to
+15 dB. Hence, an SII improvement of 0.1 corresponds to a real SNR improvement of 3 dB. It is well known that the standard SII overestimates the speech-recognition performance of hearingimpaired listeners, especially in noisy environments. Various modifications of the SII have been proposed to account for additional suprathreshold deficits in impaired ears such as the incorporation of “desensitization factors” [10]. 2.2.2 Segmental Speech Intelligibility Index The SII standard does not claim to account for the effects of fluctuating noise. Additionally, the frequency-weighted long-term SNR may obscure some segmental effects introduced by the noise reduction algorithms. Therefore, a slightly modified procedure is used to derive a segmental SII measure (segSII). The SII is first calculated for each short-time segment of 50 ms, and is then averaged over the full duration of the test signal. If an algorithm improves only the SII, but not the segSII, it is questionable whether the algorithm will effectively improve speech understanding. 2.2.3 Signal-to-noise Loudness Level Difference By using an auditory excitation model for a specific type of simulated hearing loss [10], the partial loudness of both speech and the competing signals can be calculated, including the masking effect of noise on the speech loudness, and vice versa. First, preliminary instantaneous partial loudness density patterns are computed for the desired and for the competing signals [10]. To represent the reduced partial loudness of speech in the presence of noise, and vice versa, the loudness density is further reduced smoothly towards zero. The instantaneous loudness function is then calculated by numerical integration over the auditory place scale along the basilar membrane in the cochlea (inner ear). Next, the partial-loudness estimates are calculated by three steps of non-linear smoothing of the instantaneous loudness functions, followed by a conversion to a phon scale. Finally, the loudness level difference between desired and competing signals is computed. 2.2.4 Signal Excitation-level Distortion The Signal Excitation-level Distortion is a measure of the spectral deviation between the unprocessed and processed desired signal [10]. This measure is calculated as a root-mean-square average of excitation-level differences between the desired signal component in the unprocessed sound and the desired signal component in the processed sound. To avoid the influence of speech pauses in the test material, signal segments are included in the calculation only, if the segmental signal-to-noise ratio is larger than −15 dB for either the unprocessed or the processed signal. Furthermore, to avoid including distortion elements that are completely masked by noise, non-zero contributions are allowed at those auditory places along the basilar membrane and at those time segments only, where the signal-to-noise excitation ratios exceed a predefined threshold, which is set to match an SNR of −10 dB in normal hearing. At lower signal-to-noise excitation-level differences, any spectral deviations in the desired signal are assumed to be masked by the noise. 2.3 Test conditions For a reliable objective performance assessment realistic acoustic test conditions have to be defined. We have used a database with real-life audio recordings provided by Siemens Audiologische Technik, Erlangen, Germany. The database contains recordings with different kinds of audio signals in a number of representative recording rooms (low-reverberant room, living room, cafeteria, car cabin and street corner). All test material was recorded by small microphones mounted in a behind-the-ear hearing aid case that was placed on an artificial head-and-torso manikin. All signals were simultaneously recorded at a sampling rate of 16 kHz. The selected subset of test material includes both point-source material (speech, music, speech-shaped noise) coming from various directions, and diffuse-like noise (natural noise sound fields recorded on a street corner, in a car cabin or in a crowded restaurant).
algorithm SS1 SS2 BSS MWF COH
% CPU time 8.3 % 4.2 % 59.9 % 4.3 % 1.2 %
Table 1: Computational complexity estimates of the algorithms measured on the real-time PHS–MHA platform 3. COMMON EVALUATION PLATFORM To facilitate intensive subjective listening testing across different test sites, all five signal enhancement algorithms that were discussed in section 1, have been implemented on a common realtime hardware/software platform, called Personal Hearing System (PHS). The hardware platform consists of a (laptop) PC running a real-time (low-latency) Linux kernel. The PC is equipped with a multi-channel RME Multiface sound card, which is connected via a pre-amplifier box to a pair of hearing aids. The hearing aid devices used in this study are Siemens Acuris hearing aid cases with only the 3 microphones and a single receiver (loudspeaker) inside (no processor included). All signal processing is to be done externally on a real-time Linux PC. Thereto, all algorithm developers incorporated a C/C++ version of their algorithm into the real-time Master Hearing Aid (MHA) software environment [12], which is running on the PC. The MHA communicates with the RME Multiface sound card using the Jack sound driver under Linux. In this way, the 3 microphone signals from both the left and the right hearing aid are digitized by the sound card, are sent to the PC, and are processed in real time, resulting into an enhanced stereo audio stream that is output by the sound card and sent to the receiver of the left and the right hearing aid. In this respect, it is important to note that the single-channel noise suppression algorithms SS1 and SS2 only use the front microphone signal and that both hearing aids run the same algorithm with identical parameters, independently of each other. The BSS and COH approaches are truly binaural algorithms using the front microphone of the left and the right hearing aid as their inputs. The MWF beamformer, on the other hand, is a multi-channel noise reduction algorithm that processes all 3 microphone signals of the hearing aid, and hence disposes of more degrees of freedom to cancel background noise. Similar to SS1 and SS2, the left and right hearing aid run the same algorithm, independently of each other. Apart from passing signals to and from the algorithms, the MHA software is also responsible for applying basic hearing aid processing to the signals, such as frequency dependent gain setting and level compression. The parameters of the amplification and level compression unit are automatically computed by a NAL-RP prescription rule [6] according to the amount and type of hearing loss of the user, which is input to the MHA via a MATLAB-based GUI. This same GUI allows the user to toggle between the five signal enhancement algorithms and also provides an interface for calibration and data streaming control. The PHS–MHA system was intensively tested, including a validation of the implementation of the algorithms on the PHS–MHA platform against their initial realization in MATLAB. For a possible future integration in a commercial hearing aid device, the computational complexity of the algorithms has to be monitored. Table 1 shows an estimate of the computational complexity of each algorithm. The measurements are performed on a Dell Latitude D610 with Intel Pentium M 1.6 GHz processor running a low-latency Linux operating system. The baseline processing by the PHS– MHA system with all signal enhancement algorithms switched off requires 10.3% of CPU time. Note that as the primary objective of the HearCom project is to prove the validity of the different algorithmic approaches in a hearing aid context, there is still some room left to further reduce the computational load of the algorithms. Apart from the computational complexity also the total signal delay that is introduced by the system has to be carefully monitored. Most hearing-instrument users receive processed sound together with un-
10
8
6
SRT improvement (dB)
processed sound leaking directly into the ear canal. Noticeable interference then may occur if the processed signal is delayed more than about 5 − 10 ms with respect to the unprocessed sound [7]. Listeners with a severe hearing loss on the other hand, mainly suffer from the asynchrony between the perceived speech sounds and visual information such as lip movements. In this case, delays up to a few tens of milliseconds are acceptable. The total input/output delay from the signal sent into the AD converter to the signal that appears at the DA converter output was measured on a Dell Latitude D620 with Intel Core Duo 1.83GHz processor running a lowlatency Linux operating system. The total input/output delay includes the combined delay of the PHS–MHA system and of the selected signal enhancement algorithm. With all signal enhancement algorithms switched off an input/output delay of 10.6 ms was measured. This number increased to 10.8 ms for SS1, to 16.8 ms for SS2, to 10.8 ms for BSS, to 13.2 ms for MWF and remained equal to 10.6 ms for COH. Based on this data it is still hard to retrieve the actual processing delay that is introduced by the mere signal enhancement algorithms. The measured latencies are always combinations of delays inserted by the algorithm itself, by different overlap–add frameworks and delays due to the PHS-MHA system (e.g. sample rate conversion). One should also keep in mind that there usually is a trade-off between processing delay and computational complexity. In this respect, the numbers in table 1 can typically be reduced at the expense of a larger processing delay.
4
2
0
−2
−4
−6
SS1
SS2
BSS
MWF
COH
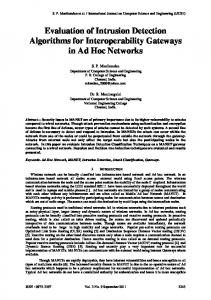
Figure 1: SRT improvements relative to the identity condition for an office-like room with 3 competing multitalker babble noise sources at 90, 180 and 270 degrees : the mean score (averaged over 10 normally-hearing subjects and test+retest) and the standard deviation is shown for each algorithm. For the identity condition, SNR50% = −4.0 dB with standard deviation 1.5 dB.
4. PERCEPTUAL EVALUATION All five signal enhancement algorithms that were discussed in section 1, are currently validated through subjective listening tests in Dutch and German, and this across five different test centers in Belgium, the Netherlands, Germany and Switzerland. Three types of tests are performed : an adaptive speech reception threshold (SRT) sentence test, a listening effort test and a preference rating test. To restrict the number of test conditions, we limit ourselves to two types of listening rooms : a room with a reverberation time T60 between 400 and 600 ms, which is typical for a living or office room, and which is in compliance with standards for school/educational acoustical environments, and a highly reverberating room with T60 larger than 1 s. The maximum permissible background noise level is set to 35 dB(A). During the test the listener is given a PHS–MHAcontrolled hearing aid pair and is seated in the room amidst 4 loudspeakers that are positioned in front (0◦ ), at the right (90◦ ), at the back (180◦ ) and at the left (270◦ ), at 1 m distance from the center of the listener’s head. All loudspeakers are directed towards the listener. Speech is presented through the front (0◦ ) loudspeaker. Three noise scenarios are considered. A diffuse noise field scenario is approximated by simultaneously playing uncorrelated noise through the 3 loudspeakers at the left, right and back of the listener (S0N90180270 condition). A point-source noise scenario is created by playing noise through the loudspeaker at the right (90◦ ) of the listener and muting the loudspeakers at the left and at the back (S0N90 condition). Finally, some of the algorithms (e.g. COH) are evaluated in silence, in the absence of background noise. The noises are calibrated to produce a fixed combined sound level of 65 dB(A) at the reference position, which is the center of the listener’s head (measured when the head is absent). The speech level is then adjusted is such a way that a desired signal-to-noise ratio is obtained at that reference position. Two types of noises are considered : multitalker babble noise of Auditec of St-Louis, and ICRA5 250 noise (ICRA5 with restricted gaps). Three subject groups participate in the tests, each characterized by a specific type of hearing loss : a group of listeners with a moderate sloping-type of perceptual hearing loss, a group with moderate flat perceptual hearing loss, and a group of normally hearing listeners. 5. TEST RESULTS At the time of writing only a subset of the test protocol specified in section 4 has been completed. The first results related to this work are presented in this paper.
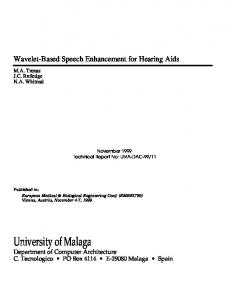
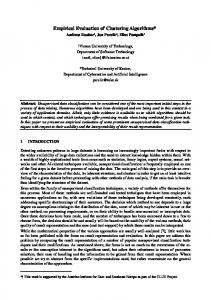
Figures 1, 2 and 3 show the results obtained from an adaptive speech reception threshold (SRT) test that has been performed with 10 normally hearing Belgian subjects using the Dutch VU98 open-set sentence test and competing multitalker babble noise. The subjects have been tested in an office-like room (T60 ≈ 500 ms, critical distance around 130 cm) in the S0N90 and S0N90180270 condition, and in a highly reverberating room (T60 ≈ 2.8 s, critical distance around 35 cm) in the S0N90180270 condition. All test conditions were randomized and conducted twice (test+retest). No significant differences were found between the test and the retest condition. Figures 1, 2 and 3 show the mean SRT improvements (averaged over all subjects and test+retest) and standard deviations that were obtained relative to the identity condition, i.e. when all signal enhancement algorithms were switched off and only the basic processing of the PHS–MHA system was activated. Absolute SRT values can be derived by adding the SRT improvement numbers to SNR50% , the SRT for the identity condition (see figures), which is defined as the average signal-to-noise ratio at which 50% of the presented speech material was intelligible. Hence, positive numbers in the figures indicate an improvement in speech understanding with respect to the identity condition. 6. DISCUSSION AND CONCLUSION A first not very surprising conclusion drawn from figures 1, 2 and 3 is that the reverberating room is a much more challenging condition for speech understanding than the office-like room. Note that the absolute SRT values drop significantly, e.g. by 6.9 dB for the identity condition, when going from the reverberating to the office-like room. The same figures furthermore suggest that multi-microphone enhancement techniques such as BSS and MWF can take advantage of the spatial diversity of the setup and therefore succeed in improving speech intelligibility. Furthermore, for the scenarios under test and the low input SNR values obtained with normally hearing listeners, single-channel noise suppression algorithms appear to offer limited SRT improvements, or sometimes even seem to fail to enhance the SRT. The BSS algorithm on the other hand, seems optimally suited for the point-source scenario. An explanation for the rather poor performance of the COH and BSS algorithms in the presence of diffuse-like noise (S0N90180270 condition) might be that the noise field was created by playing back time-shifted multitalker babble noise files through 3 distinct loudspeakers, which is not truly realistic and probably offers a higher binaural coherence
10
8
8
6
6
SRT improvement (dB)
SRT improvement (dB)
10
4
2
0
4
2
0
−2
−2
−4
−4
−6
BSS
MWF
−6
SS1
SS2
BSS
MWF
COH
Figure 2: SRT improvements relative to the identity condition for an office-like room with 1 competing multitalker babble noise source at 90 degrees : the mean score (averaged over 10 normally-hearing subjects and test+retest) and the standard deviation is shown for BSS and MWF. For the identity condition, SNR50% = −7.2 dB with standard deviation 1.5 dB.
Figure 3: SRT improvements relative to the identity condition for a reverberating room with 3 competing multitalker babble noise sources at 90, 180 and 270 degrees : the mean score (averaged over 10 normally-hearing subjects and test+retest) and the standard deviation is shown for each algorithm. For the identity condition, SNR50% = 2.9 dB with standard deviation 2.8 dB.
than a natural multitalker babble noise, especially if the loudspeakers are located within the critical distance (such as in the office-like room). This observation in fact reveals the trade-off that had to be made between a real-life diffuse sound reproduction that is as realistic as possible for the application we have in mind, on the one hand, and compliance with standardized SRT testing procedures and preserving reproducibility and compatibility of test results across test sites, on the other hand.
pean Signal Processing Conference (EUSIPCO), Vienna, Austria, pp. 2007–2010, Sep. 2004. [9] S. Doclo, A. Spriet, J. Wouters, and M. Moonen. Speech distortion weighted multi-channel wiener filtering techniques for noise reduction (chapter 9), in Speech Enhancement, J. C. J. Benesty, S. Makino, Eds., Springer, pp. 199–228, 2005. [10] K. Eneman, A. Leijon, S. Doclo, A. Spriet, M. Moonen, and J. Wouters. Auditory-profile-based Physical Evaluation of Multimicrophone Noise Reduction Techniques in Hearing Instruments (chapter 15), in Advances in Digital Speech Transmission, R. Martin, U. Heute, C. Antweiler, Eds., Wiley, pp. 431– 458, 2008. [11] Y. Ephraim, and D. Malah. Speech Enhancement Using a Minimum Mean-Square Error Short-Time Spectral Amplitude Estimator, IEEE Transactions on Acoustics, Speech, and Signal Processing, ASSP-32(6):1109–1121, 1984. [12] G. Grimm, T. Herzke, D. Berg, and V. Hohmann. The master hearing aid: a PC based platform for algorithm development and evaluation, Acta acustica united with Acustica, no. 92, pp. 618–628, 2006. [13] R. Martin. Noise Power Spectral Density Estimation Based on Optimal Smoothing and Minimum Statistics, IEEE Trans. on Speech and Audio Processing, 9(5):504-512, 2001. [14] D. Mauler. Noise Power Spectral Density Estimation on Highly Correlated Data, Proc. Intl. Workshop Acoustic Echo and Noise Control (IWAENC), Paris, France, 2006. [15] J. Samuelsson. Single-channel noise reduction with short delay, Masters thesis, KTH Sound and Image Processing, Stockholm, 2006. [16] A. Spriet, M. Moonen, and J. Wouters. Spatially pre-processed speech distortion weighted multi-channel Wiener filtering for noise reduction, Signal Processing, vol. 84, no. 12, pp. 2367– 2387, Dec. 2004. [17] A. Spriet, M. Moonen, and J. Wouters. Stochastic gradient based implementation of spatially pre-processed speech distortion weighted multi-channel Wiener filtering for noise reduction in hearing aids, IEEE Transactions on Signal Processing, vol. 53, no. 3, pp. 911–925, Mar. 2005. [18] T. Wittkop, and V. Hohmann. Strategy-selective noise reduction for binaural digital hearing aids, Speech Communication, 39:111–138, 2003.
REFERENCES [1] R. Aichner, H. Buchner, F. Yan, and W. Kellermann. A realtime blind source separation scheme and its application to reverberant and noisy acoustic environments, Signal Processing, 86(6):1260–1277, 2006. [2] R. Aichner, H. Buchner, and W. Kellermann. Exploiting Narrowband Efficiency for Broadband Convolutive Blind Source Separation, EURASIP Journal on Applied Signal Processing, Special Issue on Advances in Blind Source Separation, September 2006. [3] H. Buchner, R. Aichner, and W. Kellermann. Blind Source Separation for Convolutive Mixtures: A Unified Treatment, in Audio Signal Processing for Next-Generation Multimedia Communication, Y. Huang, J. Benesty, Eds., Kluwer Academic Publishers, pp. 255–293, 2004. [4] H. Buchner, R. Aichner, J. Stenglein, H. Teutsch, and W. Kellermann. Simultaneous localization of multiple sound sources using blind adaptive MIMO filtering, Proc. IEEE International Conference on Acoustics, Speech and Signal Processing (ICASSP), Philadelphia, Pennsylvania, 2005. [5] H. Buchner, R. Aichner, and W. Kellermann. A generalization of blind source separation algorithms for convolutive mixtures based on second-order statistics, IEEE Trans. Speech Audio Processing, 13(1):120-134, 2005. [6] D. Byrne, A. Parkinson, P. Newall. Modified Hearing Aid Selection Procedures for Severe/profound Hearing Losses, in G. Studebaker; F. Bess; L. Beck (eds.), The Vanderbilt Hearing Aid Report II, York Press, Parkton, MD, pp. 295–300, 1991. [7] H. Dillon. Hearing Aids, Boomerang Press, Sydney, 2001. [8] S. Doclo, A. Spriet, and M. Moonen. Efficient frequencydomain implementation of speech distortion weighted multichannel Wiener filtering for noise reduction, Proc. of the Euro-